Cities with the Lowest Male Poverty Level in Maryland
RELATED REPORTS & OPTIONS
Lowest Poverty | Male
Maryland
Compare Cities
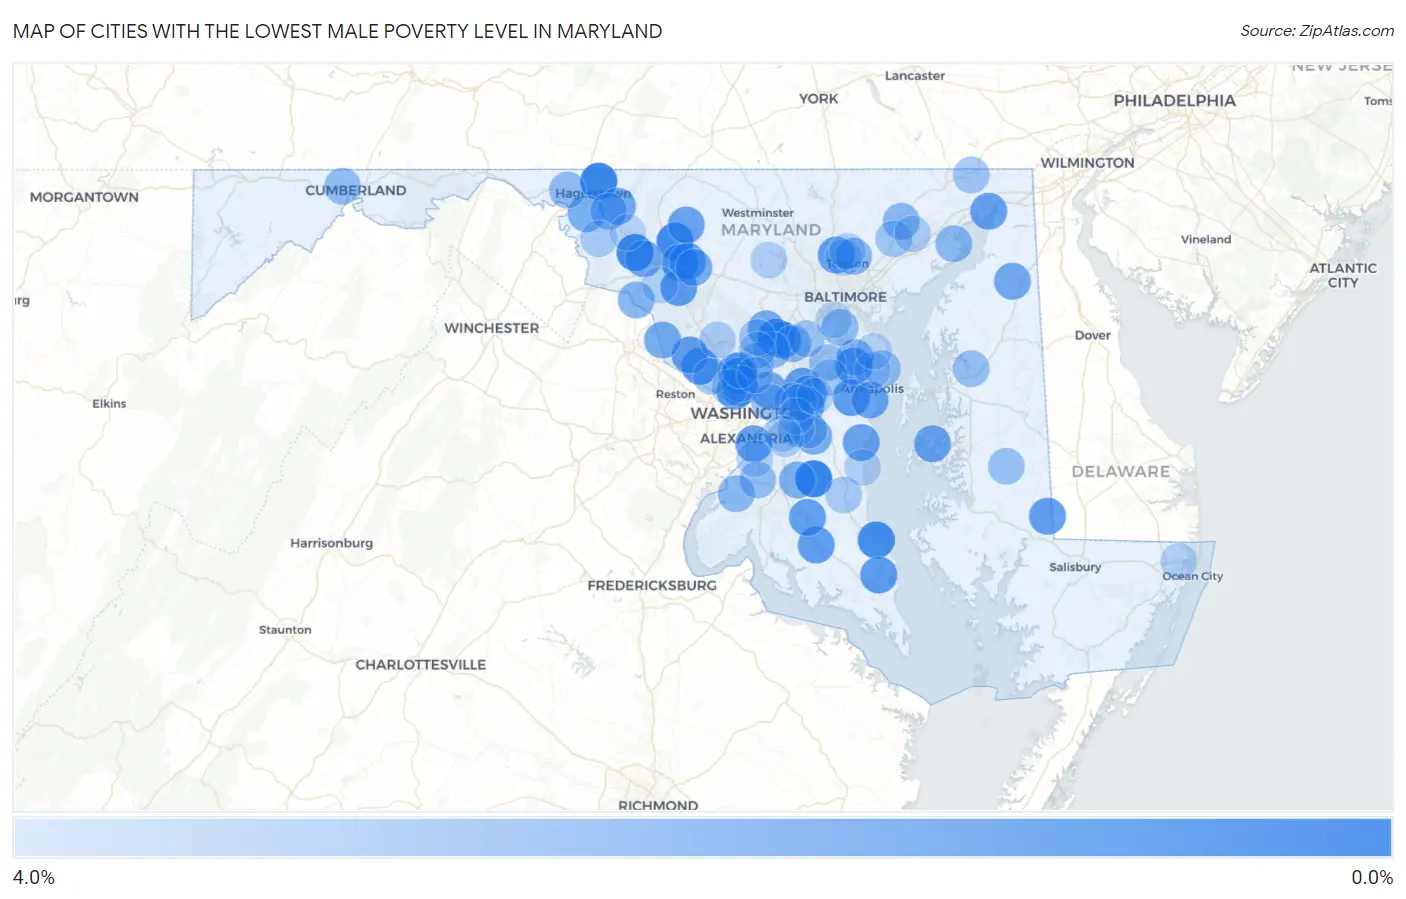
Map of Cities with the Lowest Male Poverty Level in Maryland
4.0%
0.0%
Cities with the Lowest Male Poverty Level in Maryland
| City | Male Poverty | vs State | vs National | |
| 1. | Baden | 0.10% | 8.2%(-8.12)#1 | 11.3%(-11.2)#9 |
| 2. | Fulton | 0.11% | 8.2%(-8.12)#2 | 11.3%(-11.2)#10 |
| 3. | Paramount Long Meadow | 0.16% | 8.2%(-8.07)#3 | 11.3%(-11.2)#23 |
| 4. | Walkersville | 0.32% | 8.2%(-7.91)#4 | 11.3%(-11.0)#56 |
| 5. | Brown Station | 0.33% | 8.2%(-7.90)#5 | 11.3%(-11.0)#59 |
| 6. | Middletown | 0.33% | 8.2%(-7.90)#6 | 11.3%(-11.0)#65 |
| 7. | Long Beach | 0.41% | 8.2%(-7.82)#7 | 11.3%(-10.9)#99 |
| 8. | Spring Ridge | 0.64% | 8.2%(-7.59)#8 | 11.3%(-10.7)#225 |
| 9. | Herald Harbor | 0.81% | 8.2%(-7.42)#9 | 11.3%(-10.5)#342 |
| 10. | Scaggsville | 0.84% | 8.2%(-7.39)#10 | 11.3%(-10.5)#364 |
| 11. | Travilah | 0.92% | 8.2%(-7.31)#11 | 11.3%(-10.4)#425 |
| 12. | Urbana | 1.00% | 8.2%(-7.23)#12 | 11.3%(-10.3)#485 |
| 13. | Chevy Chase View | 1.0% | 8.2%(-7.21)#13 | 11.3%(-10.3)#500 |
| 14. | Chevy Chase Section Three | 1.0% | 8.2%(-7.19)#14 | 11.3%(-10.3)#514 |
| 15. | Solomons | 1.1% | 8.2%(-7.16)#15 | 11.3%(-10.3)#533 |
| 16. | Riva | 1.1% | 8.2%(-7.15)#16 | 11.3%(-10.3)#542 |
| 17. | Mechanicsville | 1.1% | 8.2%(-7.09)#17 | 11.3%(-10.2)#589 |
| 18. | Glenn Dale | 1.2% | 8.2%(-7.08)#18 | 11.3%(-10.2)#606 |
| 19. | Sharptown | 1.2% | 8.2%(-7.07)#19 | 11.3%(-10.2)#620 |
| 20. | Darnestown | 1.2% | 8.2%(-7.05)#20 | 11.3%(-10.2)#632 |
| 21. | Garrett Park | 1.2% | 8.2%(-7.04)#21 | 11.3%(-10.2)#640 |
| 22. | National Harbor | 1.2% | 8.2%(-7.04)#22 | 11.3%(-10.1)#654 |
| 23. | Mays Chapel | 1.2% | 8.2%(-7.03)#23 | 11.3%(-10.1)#658 |
| 24. | Hughesville | 1.2% | 8.2%(-7.00)#24 | 11.3%(-10.1)#693 |
| 25. | Charlestown | 1.3% | 8.2%(-6.93)#25 | 11.3%(-10.0)#745 |
| 26. | Fairwood | 1.4% | 8.2%(-6.87)#26 | 11.3%(-9.99)#810 |
| 27. | Annapolis Neck | 1.4% | 8.2%(-6.86)#27 | 11.3%(-9.97)#816 |
| 28. | Deale | 1.4% | 8.2%(-6.83)#28 | 11.3%(-9.94)#848 |
| 29. | Woodsboro | 1.4% | 8.2%(-6.82)#29 | 11.3%(-9.93)#856 |
| 30. | Linganore | 1.4% | 8.2%(-6.80)#30 | 11.3%(-9.91)#870 |
| 31. | St Michaels | 1.4% | 8.2%(-6.80)#31 | 11.3%(-9.91)#875 |
| 32. | Somerset | 1.5% | 8.2%(-6.78)#32 | 11.3%(-9.89)#898 |
| 33. | Green Valley | 1.5% | 8.2%(-6.76)#33 | 11.3%(-9.87)#913 |
| 34. | Mount Aetna | 1.6% | 8.2%(-6.65)#34 | 11.3%(-9.77)#1,005 |
| 35. | Abingdon | 1.6% | 8.2%(-6.64)#35 | 11.3%(-9.75)#1,018 |
| 36. | Braddock Heights | 1.6% | 8.2%(-6.62)#36 | 11.3%(-9.74)#1,027 |
| 37. | Woodmore | 1.6% | 8.2%(-6.61)#37 | 11.3%(-9.72)#1,040 |
| 38. | Galena | 1.6% | 8.2%(-6.61)#38 | 11.3%(-9.72)#1,041 |
| 39. | University Park | 1.6% | 8.2%(-6.59)#39 | 11.3%(-9.70)#1,067 |
| 40. | Poolesville | 1.7% | 8.2%(-6.54)#40 | 11.3%(-9.65)#1,128 |
| 41. | New Market | 1.8% | 8.2%(-6.48)#41 | 11.3%(-9.59)#1,202 |
| 42. | Highland | 1.8% | 8.2%(-6.41)#42 | 11.3%(-9.52)#1,283 |
| 43. | St James | 1.9% | 8.2%(-6.34)#43 | 11.3%(-9.45)#1,355 |
| 44. | Cedarville | 1.9% | 8.2%(-6.32)#44 | 11.3%(-9.43)#1,382 |
| 45. | Upper Marlboro | 1.9% | 8.2%(-6.32)#45 | 11.3%(-9.43)#1,383 |
| 46. | Hampton | 2.1% | 8.2%(-6.13)#46 | 11.3%(-9.25)#1,593 |
| 47. | Point Of Rocks | 2.1% | 8.2%(-6.13)#47 | 11.3%(-9.24)#1,600 |
| 48. | Beaver Creek | 2.1% | 8.2%(-6.10)#48 | 11.3%(-9.21)#1,630 |
| 49. | North Laurel | 2.2% | 8.2%(-6.07)#49 | 11.3%(-9.18)#1,672 |
| 50. | Severna Park | 2.2% | 8.2%(-6.04)#50 | 11.3%(-9.15)#1,714 |
| 51. | Springdale | 2.2% | 8.2%(-6.00)#51 | 11.3%(-9.11)#1,767 |
| 52. | Bryans Road | 2.3% | 8.2%(-5.97)#52 | 11.3%(-9.09)#1,807 |
| 53. | Bel Air North | 2.3% | 8.2%(-5.97)#53 | 11.3%(-9.08)#1,811 |
| 54. | South Kensington | 2.3% | 8.2%(-5.95)#54 | 11.3%(-9.06)#1,837 |
| 55. | Aberdeen Proving Ground | 2.3% | 8.2%(-5.94)#55 | 11.3%(-9.05)#1,846 |
| 56. | Ferndale | 2.4% | 8.2%(-5.86)#56 | 11.3%(-8.97)#1,952 |
| 57. | Marlboro Village | 2.4% | 8.2%(-5.85)#57 | 11.3%(-8.96)#1,963 |
| 58. | Wilson Conococheague | 2.4% | 8.2%(-5.80)#58 | 11.3%(-8.91)#2,031 |
| 59. | Accokeek | 2.5% | 8.2%(-5.70)#59 | 11.3%(-8.81)#2,171 |
| 60. | La Vale | 2.6% | 8.2%(-5.67)#60 | 11.3%(-8.78)#2,219 |
| 61. | Odenton | 2.6% | 8.2%(-5.61)#61 | 11.3%(-8.73)#2,274 |
| 62. | Colmar Manor | 2.6% | 8.2%(-5.61)#62 | 11.3%(-8.72)#2,282 |
| 63. | Burtonsville | 2.6% | 8.2%(-5.60)#63 | 11.3%(-8.72)#2,288 |
| 64. | Centreville | 2.6% | 8.2%(-5.60)#64 | 11.3%(-8.72)#2,289 |
| 65. | Cape St Claire | 2.6% | 8.2%(-5.60)#65 | 11.3%(-8.71)#2,301 |
| 66. | Colesville | 2.7% | 8.2%(-5.53)#66 | 11.3%(-8.64)#2,387 |
| 67. | Preston | 2.7% | 8.2%(-5.50)#67 | 11.3%(-8.62)#2,425 |
| 68. | Jessup | 2.8% | 8.2%(-5.47)#68 | 11.3%(-8.58)#2,463 |
| 69. | Ashton Sandy Spring | 2.8% | 8.2%(-5.46)#69 | 11.3%(-8.57)#2,480 |
| 70. | Westphalia | 2.8% | 8.2%(-5.40)#70 | 11.3%(-8.51)#2,557 |
| 71. | Rising Sun | 2.9% | 8.2%(-5.37)#71 | 11.3%(-8.49)#2,589 |
| 72. | Crofton | 2.9% | 8.2%(-5.34)#72 | 11.3%(-8.45)#2,645 |
| 73. | Pleasant Hills | 2.9% | 8.2%(-5.33)#73 | 11.3%(-8.44)#2,658 |
| 74. | Potomac | 3.0% | 8.2%(-5.23)#74 | 11.3%(-8.35)#2,786 |
| 75. | Chevy Chase | 3.0% | 8.2%(-5.22)#75 | 11.3%(-8.33)#2,812 |
| 76. | Honeygo | 3.0% | 8.2%(-5.21)#76 | 11.3%(-8.32)#2,825 |
| 77. | Bethesda | 3.0% | 8.2%(-5.18)#77 | 11.3%(-8.29)#2,879 |
| 78. | Huntingtown | 3.1% | 8.2%(-5.18)#78 | 11.3%(-8.29)#2,883 |
| 79. | Keedysville | 3.1% | 8.2%(-5.13)#79 | 11.3%(-8.24)#2,935 |
| 80. | Washington Grove | 3.1% | 8.2%(-5.11)#80 | 11.3%(-8.23)#2,954 |
| 81. | Cloverly | 3.2% | 8.2%(-5.08)#81 | 11.3%(-8.19)#3,005 |
| 82. | Andrews Afb | 3.2% | 8.2%(-5.07)#82 | 11.3%(-8.18)#3,011 |
| 83. | Mitchellville | 3.2% | 8.2%(-5.04)#83 | 11.3%(-8.16)#3,045 |
| 84. | Bel Air South | 3.2% | 8.2%(-5.04)#84 | 11.3%(-8.15)#3,050 |
| 85. | North Kensington | 3.2% | 8.2%(-5.01)#85 | 11.3%(-8.12)#3,093 |
| 86. | Four Corners | 3.2% | 8.2%(-5.00)#86 | 11.3%(-8.11)#3,122 |
| 87. | Arnold | 3.3% | 8.2%(-4.97)#87 | 11.3%(-8.08)#3,161 |
| 88. | Buckeystown | 3.3% | 8.2%(-4.97)#88 | 11.3%(-8.08)#3,166 |
| 89. | Eldersburg | 3.3% | 8.2%(-4.96)#89 | 11.3%(-8.07)#3,179 |
| 90. | Fort Washington | 3.3% | 8.2%(-4.93)#90 | 11.3%(-8.04)#3,222 |
| 91. | Largo | 3.3% | 8.2%(-4.92)#91 | 11.3%(-8.03)#3,249 |
| 92. | Ocean Pines | 3.3% | 8.2%(-4.92)#92 | 11.3%(-8.03)#3,253 |
| 93. | North Beach | 3.3% | 8.2%(-4.88)#93 | 11.3%(-8.00)#3,300 |
| 94. | Bowie | 3.4% | 8.2%(-4.86)#94 | 11.3%(-7.98)#3,332 |
| 95. | Morningside | 3.4% | 8.2%(-4.85)#95 | 11.3%(-7.96)#3,357 |
| 96. | Lutherville | 3.4% | 8.2%(-4.83)#96 | 11.3%(-7.95)#3,381 |
| 97. | Myersville | 3.4% | 8.2%(-4.80)#97 | 11.3%(-7.91)#3,433 |
| 98. | Timonium | 3.4% | 8.2%(-4.79)#98 | 11.3%(-7.90)#3,436 |
| 99. | Lake Shore | 3.4% | 8.2%(-4.79)#99 | 11.3%(-7.90)#3,439 |
| 100. | Linthicum | 3.4% | 8.2%(-4.79)#100 | 11.3%(-7.90)#3,440 |
Common Questions
What are the Top 10 Cities with the Lowest Male Poverty Level in Maryland?
Top 10 Cities with the Lowest Male Poverty Level in Maryland are:
#1
0.10%
#2
0.11%
#3
0.16%
#4
0.32%
#5
0.33%
#6
0.41%
#7
0.64%
#8
0.81%
#9
0.84%
#10
0.92%
What city has the Lowest Male Poverty Level in Maryland?
Baden has the Lowest Male Poverty Level in Maryland with 0.10%.
What is the Poverty Level Among Males in the State of Maryland?
Poverty Level Among Males in Maryland is 8.2%.
What is the Poverty Level Among Males in the United States?
Poverty Level Among Males in the United States is 11.3%.