Cities with the Lowest Male Poverty Level in Illinois
RELATED REPORTS & OPTIONS
Lowest Poverty | Male
Illinois
Compare Cities
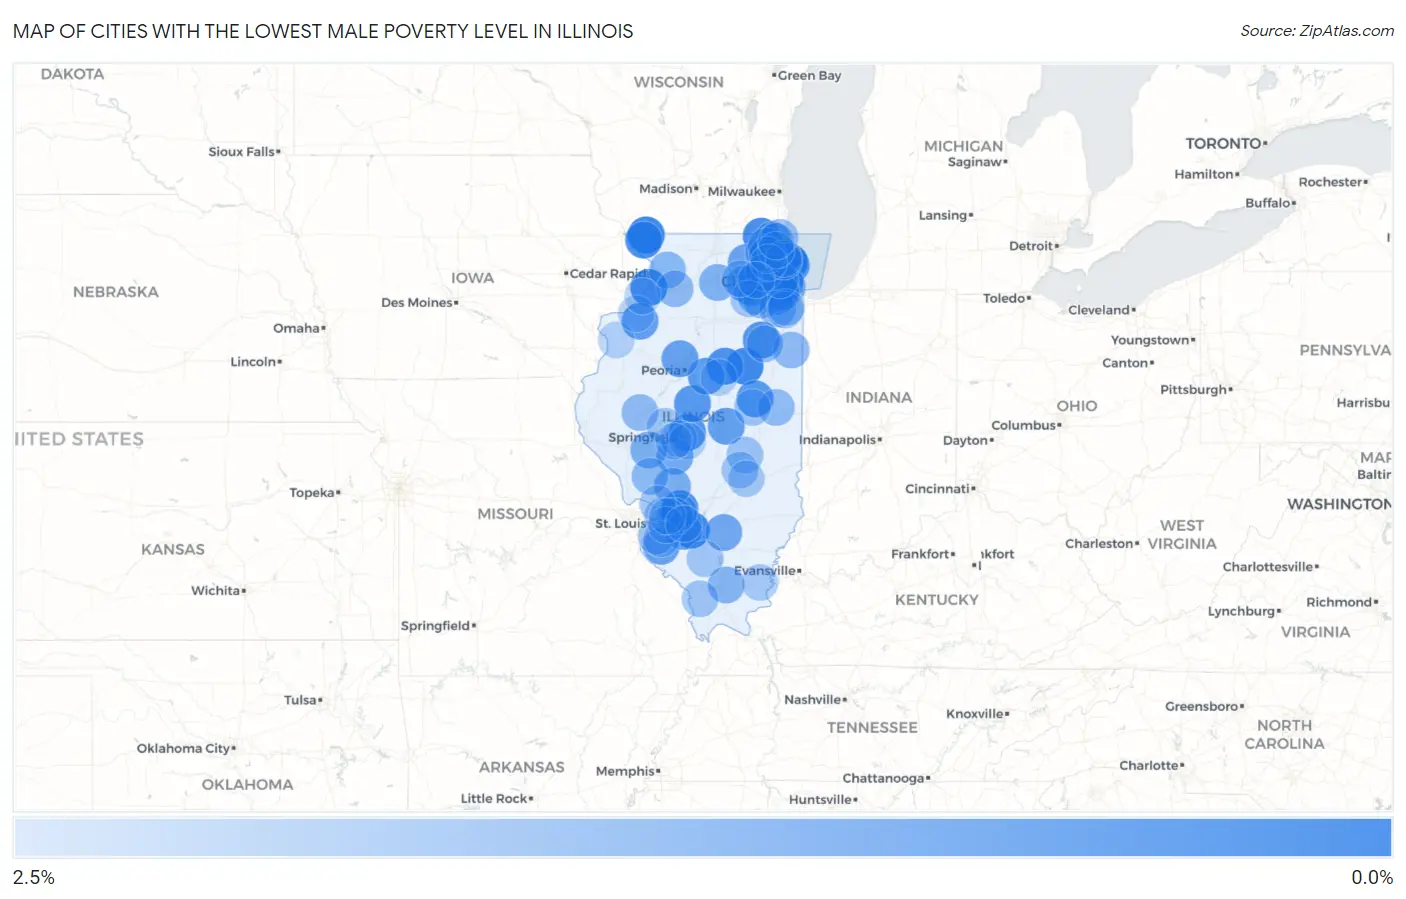
Map of Cities with the Lowest Male Poverty Level in Illinois
2.5%
0.0%
Cities with the Lowest Male Poverty Level in Illinois
| City | Male Poverty | vs State | vs National | |
| 1. | Golf | 0.34% | 10.6%(-10.2)#1 | 11.3%(-11.0)#69 |
| 2. | Scales Mound | 0.41% | 10.6%(-10.2)#2 | 11.3%(-10.9)#96 |
| 3. | Fairbury | 0.48% | 10.6%(-10.1)#3 | 11.3%(-10.9)#134 |
| 4. | Bartelso | 0.50% | 10.6%(-10.1)#4 | 11.3%(-10.8)#142 |
| 5. | Spring Grove | 0.55% | 10.6%(-10.0)#5 | 11.3%(-10.8)#169 |
| 6. | Albany | 0.56% | 10.6%(-10.0)#6 | 11.3%(-10.8)#173 |
| 7. | Kenilworth | 0.57% | 10.6%(-10.0)#7 | 11.3%(-10.8)#182 |
| 8. | Long Grove | 0.59% | 10.6%(-9.99)#8 | 11.3%(-10.8)#194 |
| 9. | The Galena Territory | 0.62% | 10.6%(-9.97)#9 | 11.3%(-10.7)#207 |
| 10. | Gridley | 0.70% | 10.6%(-9.88)#10 | 11.3%(-10.6)#266 |
| 11. | South Barrington | 0.73% | 10.6%(-9.85)#11 | 11.3%(-10.6)#285 |
| 12. | Wayne | 0.74% | 10.6%(-9.85)#12 | 11.3%(-10.6)#293 |
| 13. | Deer Park | 0.77% | 10.6%(-9.82)#13 | 11.3%(-10.6)#312 |
| 14. | Grantfork | 0.78% | 10.6%(-9.81)#14 | 11.3%(-10.6)#319 |
| 15. | Reddick | 0.83% | 10.6%(-9.75)#15 | 11.3%(-10.5)#363 |
| 16. | Spaulding | 0.84% | 10.6%(-9.74)#16 | 11.3%(-10.5)#365 |
| 17. | Hawthorn Woods | 0.87% | 10.6%(-9.71)#17 | 11.3%(-10.5)#390 |
| 18. | Glencoe | 0.87% | 10.6%(-9.71)#18 | 11.3%(-10.5)#391 |
| 19. | Hartsburg | 0.88% | 10.6%(-9.71)#19 | 11.3%(-10.5)#393 |
| 20. | Riverside | 0.89% | 10.6%(-9.69)#20 | 11.3%(-10.5)#401 |
| 21. | Fisher | 0.89% | 10.6%(-9.69)#21 | 11.3%(-10.4)#408 |
| 22. | Congerville | 0.95% | 10.6%(-9.63)#22 | 11.3%(-10.4)#449 |
| 23. | River Forest | 0.99% | 10.6%(-9.59)#23 | 11.3%(-10.3)#480 |
| 24. | Itasca | 1.1% | 10.6%(-9.53)#24 | 11.3%(-10.3)#519 |
| 25. | Oreana | 1.1% | 10.6%(-9.53)#25 | 11.3%(-10.3)#523 |
| 26. | Hinsdale | 1.1% | 10.6%(-9.52)#26 | 11.3%(-10.3)#530 |
| 27. | Orion | 1.1% | 10.6%(-9.49)#27 | 11.3%(-10.3)#550 |
| 28. | Prestbury | 1.1% | 10.6%(-9.46)#28 | 11.3%(-10.2)#576 |
| 29. | Dunlap | 1.1% | 10.6%(-9.45)#29 | 11.3%(-10.2)#581 |
| 30. | Damiansville | 1.1% | 10.6%(-9.45)#30 | 11.3%(-10.2)#583 |
| 31. | Venetian Village | 1.1% | 10.6%(-9.45)#31 | 11.3%(-10.2)#586 |
| 32. | Hecker | 1.1% | 10.6%(-9.44)#32 | 11.3%(-10.2)#594 |
| 33. | Hampshire | 1.2% | 10.6%(-9.43)#33 | 11.3%(-10.2)#609 |
| 34. | Winfield | 1.2% | 10.6%(-9.40)#34 | 11.3%(-10.2)#642 |
| 35. | Tower Lakes | 1.2% | 10.6%(-9.36)#35 | 11.3%(-10.1)#686 |
| 36. | Winnetka | 1.3% | 10.6%(-9.31)#36 | 11.3%(-10.1)#729 |
| 37. | Kell | 1.3% | 10.6%(-9.27)#37 | 11.3%(-10.0)#776 |
| 38. | Kaneville | 1.3% | 10.6%(-9.25)#38 | 11.3%(-10.0)#788 |
| 39. | Bannockburn | 1.3% | 10.6%(-9.24)#39 | 11.3%(-10.00)#792 |
| 40. | Thayer | 1.3% | 10.6%(-9.24)#40 | 11.3%(-9.99)#799 |
| 41. | Highland | 1.4% | 10.6%(-9.20)#41 | 11.3%(-9.96)#834 |
| 42. | Port Barrington | 1.4% | 10.6%(-9.18)#42 | 11.3%(-9.94)#853 |
| 43. | East Gillespie | 1.4% | 10.6%(-9.15)#43 | 11.3%(-9.90)#884 |
| 44. | Woodson | 1.5% | 10.6%(-9.09)#44 | 11.3%(-9.85)#933 |
| 45. | Burr Ridge | 1.5% | 10.6%(-9.07)#45 | 11.3%(-9.83)#947 |
| 46. | Steward | 1.5% | 10.6%(-9.05)#46 | 11.3%(-9.80)#974 |
| 47. | Lemont | 1.6% | 10.6%(-8.97)#47 | 11.3%(-9.72)#1,038 |
| 48. | Lake Carroll | 1.6% | 10.6%(-8.95)#48 | 11.3%(-9.70)#1,061 |
| 49. | Pittsburg | 1.6% | 10.6%(-8.95)#49 | 11.3%(-9.70)#1,062 |
| 50. | Western Springs | 1.7% | 10.6%(-8.93)#50 | 11.3%(-9.68)#1,085 |
| 51. | Oswego | 1.7% | 10.6%(-8.90)#51 | 11.3%(-9.66)#1,125 |
| 52. | Volo | 1.7% | 10.6%(-8.87)#52 | 11.3%(-9.62)#1,160 |
| 53. | Chadwick | 1.7% | 10.6%(-8.86)#53 | 11.3%(-9.62)#1,167 |
| 54. | Rockbridge | 1.8% | 10.6%(-8.83)#54 | 11.3%(-9.59)#1,207 |
| 55. | Forest View | 1.8% | 10.6%(-8.82)#55 | 11.3%(-9.58)#1,220 |
| 56. | Como | 1.8% | 10.6%(-8.80)#56 | 11.3%(-9.56)#1,240 |
| 57. | Papineau | 1.8% | 10.6%(-8.80)#57 | 11.3%(-9.56)#1,242 |
| 58. | Browning | 1.8% | 10.6%(-8.80)#58 | 11.3%(-9.56)#1,243 |
| 59. | Plainfield | 1.8% | 10.6%(-8.78)#59 | 11.3%(-9.53)#1,264 |
| 60. | Royal | 1.8% | 10.6%(-8.77)#60 | 11.3%(-9.52)#1,275 |
| 61. | Willow Springs | 1.8% | 10.6%(-8.76)#61 | 11.3%(-9.52)#1,286 |
| 62. | Buckingham | 1.8% | 10.6%(-8.75)#62 | 11.3%(-9.51)#1,297 |
| 63. | Bartlett | 1.9% | 10.6%(-8.72)#63 | 11.3%(-9.48)#1,330 |
| 64. | New Lenox | 1.9% | 10.6%(-8.68)#64 | 11.3%(-9.44)#1,372 |
| 65. | Wadsworth | 1.9% | 10.6%(-8.67)#65 | 11.3%(-9.43)#1,384 |
| 66. | Millstadt | 2.0% | 10.6%(-8.63)#66 | 11.3%(-9.39)#1,426 |
| 67. | St Jacob | 2.0% | 10.6%(-8.59)#67 | 11.3%(-9.35)#1,468 |
| 68. | Allenville | 2.0% | 10.6%(-8.58)#68 | 11.3%(-9.34)#1,479 |
| 69. | Frankfort | 2.0% | 10.6%(-8.55)#69 | 11.3%(-9.30)#1,523 |
| 70. | Maryville | 2.0% | 10.6%(-8.54)#70 | 11.3%(-9.29)#1,539 |
| 71. | Mahomet | 2.0% | 10.6%(-8.53)#71 | 11.3%(-9.29)#1,540 |
| 72. | Alto Pass | 2.1% | 10.6%(-8.52)#72 | 11.3%(-9.28)#1,554 |
| 73. | Strasburg | 2.1% | 10.6%(-8.52)#73 | 11.3%(-9.28)#1,559 |
| 74. | Tallula | 2.1% | 10.6%(-8.51)#74 | 11.3%(-9.27)#1,566 |
| 75. | Frankfort Square | 2.1% | 10.6%(-8.49)#75 | 11.3%(-9.24)#1,598 |
| 76. | Rosewood Heights | 2.1% | 10.6%(-8.47)#76 | 11.3%(-9.23)#1,613 |
| 77. | Tamaroa | 2.1% | 10.6%(-8.47)#77 | 11.3%(-9.23)#1,617 |
| 78. | Yorkville | 2.1% | 10.6%(-8.45)#78 | 11.3%(-9.21)#1,641 |
| 79. | Berkeley | 2.1% | 10.6%(-8.45)#79 | 11.3%(-9.21)#1,642 |
| 80. | Sigel | 2.1% | 10.6%(-8.45)#80 | 11.3%(-9.20)#1,647 |
| 81. | Northbrook | 2.1% | 10.6%(-8.45)#81 | 11.3%(-9.20)#1,648 |
| 82. | North Barrington | 2.2% | 10.6%(-8.42)#82 | 11.3%(-9.18)#1,683 |
| 83. | Ridgway | 2.2% | 10.6%(-8.40)#83 | 11.3%(-9.16)#1,701 |
| 84. | Leland Grove | 2.2% | 10.6%(-8.40)#84 | 11.3%(-9.16)#1,703 |
| 85. | Maple Park | 2.2% | 10.6%(-8.36)#85 | 11.3%(-9.11)#1,766 |
| 86. | Deerfield | 2.3% | 10.6%(-8.28)#86 | 11.3%(-9.03)#1,870 |
| 87. | Hudson | 2.3% | 10.6%(-8.27)#87 | 11.3%(-9.02)#1,880 |
| 88. | Libertyville | 2.3% | 10.6%(-8.24)#88 | 11.3%(-9.00)#1,901 |
| 89. | Smithton | 2.4% | 10.6%(-8.23)#89 | 11.3%(-8.98)#1,927 |
| 90. | Seaton | 2.4% | 10.6%(-8.22)#90 | 11.3%(-8.98)#1,936 |
| 91. | Rochester | 2.4% | 10.6%(-8.22)#91 | 11.3%(-8.98)#1,938 |
| 92. | Coal Valley | 2.4% | 10.6%(-8.21)#92 | 11.3%(-8.97)#1,953 |
| 93. | Cordova | 2.4% | 10.6%(-8.20)#93 | 11.3%(-8.96)#1,967 |
| 94. | Inverness | 2.4% | 10.6%(-8.18)#94 | 11.3%(-8.94)#1,999 |
| 95. | O Fallon | 2.4% | 10.6%(-8.18)#95 | 11.3%(-8.93)#2,000 |
| 96. | Curran | 2.4% | 10.6%(-8.17)#96 | 11.3%(-8.93)#2,005 |
| 97. | Grandwood Park | 2.4% | 10.6%(-8.16)#97 | 11.3%(-8.92)#2,022 |
| 98. | Geneva | 2.4% | 10.6%(-8.16)#98 | 11.3%(-8.91)#2,029 |
| 99. | Troy | 2.4% | 10.6%(-8.14)#99 | 11.3%(-8.90)#2,048 |
| 100. | Aviston | 2.5% | 10.6%(-8.12)#100 | 11.3%(-8.88)#2,076 |
Common Questions
What are the Top 10 Cities with the Lowest Male Poverty Level in Illinois?
Top 10 Cities with the Lowest Male Poverty Level in Illinois are:
#1
0.34%
#2
0.41%
#3
0.48%
#4
0.50%
#5
0.55%
#6
0.56%
#7
0.57%
#8
0.59%
#9
0.62%
#10
0.70%
What city has the Lowest Male Poverty Level in Illinois?
Golf has the Lowest Male Poverty Level in Illinois with 0.34%.
What is the Poverty Level Among Males in the State of Illinois?
Poverty Level Among Males in Illinois is 10.6%.
What is the Poverty Level Among Males in the United States?
Poverty Level Among Males in the United States is 11.3%.