Cities with the Lowest Male Poverty Level in Virginia
RELATED REPORTS & OPTIONS
Lowest Poverty | Male
Virginia
Compare Cities
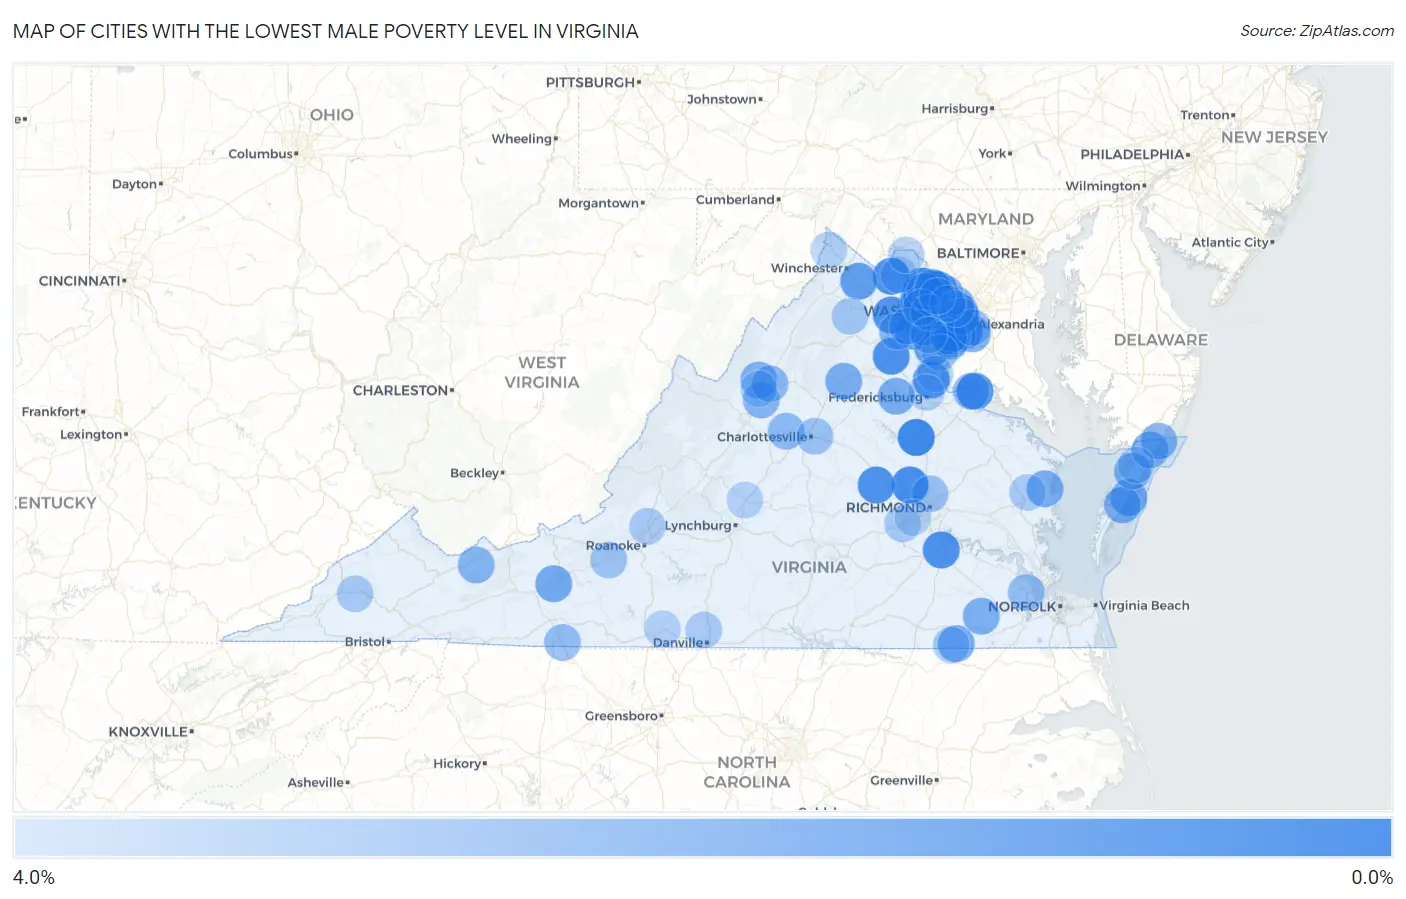
Map of Cities with the Lowest Male Poverty Level in Virginia
4.0%
0.0%
Cities with the Lowest Male Poverty Level in Virginia
| City | Male Poverty | vs State | vs National | |
| 1. | Braddock | 0.061% | 8.9%(-8.81)#1 | 11.3%(-11.3)#2 |
| 2. | Belmont | 0.079% | 8.9%(-8.79)#2 | 11.3%(-11.3)#6 |
| 3. | Lake Land Or | 0.22% | 8.9%(-8.66)#3 | 11.3%(-11.1)#33 |
| 4. | South Run | 0.29% | 8.9%(-8.59)#4 | 11.3%(-11.1)#50 |
| 5. | Hayfield | 0.31% | 8.9%(-8.56)#5 | 11.3%(-11.0)#53 |
| 6. | Lowes Island | 0.32% | 8.9%(-8.55)#6 | 11.3%(-11.0)#58 |
| 7. | Fairfax Station | 0.43% | 8.9%(-8.44)#7 | 11.3%(-10.9)#114 |
| 8. | Wyndham | 0.49% | 8.9%(-8.39)#8 | 11.3%(-10.9)#136 |
| 9. | Round Hill | 0.56% | 8.9%(-8.31)#9 | 11.3%(-10.8)#174 |
| 10. | Stone Ridge | 0.59% | 8.9%(-8.28)#10 | 11.3%(-10.8)#191 |
| 11. | Goochland | 0.64% | 8.9%(-8.23)#11 | 11.3%(-10.7)#222 |
| 12. | Bealeton | 0.64% | 8.9%(-8.23)#12 | 11.3%(-10.7)#223 |
| 13. | Dahlgren Center | 0.64% | 8.9%(-8.23)#13 | 11.3%(-10.7)#227 |
| 14. | Fort Lee | 0.65% | 8.9%(-8.23)#14 | 11.3%(-10.7)#228 |
| 15. | The Plains | 0.76% | 8.9%(-8.11)#15 | 11.3%(-10.6)#309 |
| 16. | Difficult Run | 0.78% | 8.9%(-8.09)#16 | 11.3%(-10.6)#324 |
| 17. | One Loudoun | 0.89% | 8.9%(-7.99)#17 | 11.3%(-10.5)#400 |
| 18. | Falls Church | 0.91% | 8.9%(-7.96)#18 | 11.3%(-10.4)#420 |
| 19. | Stafford Courthouse | 1.0% | 8.9%(-7.85)#19 | 11.3%(-10.3)#504 |
| 20. | Brambleton | 1.1% | 8.9%(-7.82)#20 | 11.3%(-10.3)#518 |
| 21. | Linton Hall | 1.1% | 8.9%(-7.81)#21 | 11.3%(-10.3)#528 |
| 22. | Broadlands | 1.2% | 8.9%(-7.72)#22 | 11.3%(-10.2)#607 |
| 23. | Independent Hill | 1.2% | 8.9%(-7.67)#23 | 11.3%(-10.1)#659 |
| 24. | Boyce | 1.2% | 8.9%(-7.67)#24 | 11.3%(-10.1)#672 |
| 25. | Mantua | 1.5% | 8.9%(-7.34)#25 | 11.3%(-9.81)#966 |
| 26. | Floris | 1.5% | 8.9%(-7.32)#26 | 11.3%(-9.79)#983 |
| 27. | Wachapreague | 1.7% | 8.9%(-7.22)#27 | 11.3%(-9.69)#1,076 |
| 28. | Arcola | 1.7% | 8.9%(-7.21)#28 | 11.3%(-9.68)#1,084 |
| 29. | Draper | 1.7% | 8.9%(-7.20)#29 | 11.3%(-9.67)#1,108 |
| 30. | Mallow | 1.7% | 8.9%(-7.20)#30 | 11.3%(-9.67)#1,111 |
| 31. | Boykins | 1.7% | 8.9%(-7.15)#31 | 11.3%(-9.62)#1,168 |
| 32. | Lake Wilderness | 1.8% | 8.9%(-7.11)#32 | 11.3%(-9.58)#1,217 |
| 33. | Burke | 1.8% | 8.9%(-7.07)#33 | 11.3%(-9.54)#1,256 |
| 34. | Irvington | 1.8% | 8.9%(-7.04)#34 | 11.3%(-9.51)#1,293 |
| 35. | Quinby | 1.8% | 8.9%(-7.03)#35 | 11.3%(-9.50)#1,301 |
| 36. | Fort Hunt | 1.8% | 8.9%(-7.03)#36 | 11.3%(-9.50)#1,309 |
| 37. | Brightwood | 1.9% | 8.9%(-7.00)#37 | 11.3%(-9.47)#1,335 |
| 38. | Rose Hill Cdp Fairfax County | 1.9% | 8.9%(-7.00)#38 | 11.3%(-9.47)#1,338 |
| 39. | Parksley | 1.9% | 8.9%(-6.97)#39 | 11.3%(-9.44)#1,370 |
| 40. | Sedley | 1.9% | 8.9%(-6.95)#40 | 11.3%(-9.41)#1,401 |
| 41. | Mclean | 2.0% | 8.9%(-6.90)#41 | 11.3%(-9.37)#1,448 |
| 42. | Wattsville | 2.0% | 8.9%(-6.90)#42 | 11.3%(-9.36)#1,452 |
| 43. | Great Falls Crossing | 2.0% | 8.9%(-6.86)#43 | 11.3%(-9.33)#1,498 |
| 44. | Dayton | 2.0% | 8.9%(-6.85)#44 | 11.3%(-9.32)#1,504 |
| 45. | Newington | 2.0% | 8.9%(-6.85)#45 | 11.3%(-9.31)#1,509 |
| 46. | Great Falls | 2.1% | 8.9%(-6.81)#46 | 11.3%(-9.27)#1,560 |
| 47. | Franklin Farm | 2.1% | 8.9%(-6.81)#47 | 11.3%(-9.27)#1,562 |
| 48. | Loudoun Valley Estates | 2.1% | 8.9%(-6.80)#48 | 11.3%(-9.27)#1,567 |
| 49. | Captains Cove | 2.1% | 8.9%(-6.80)#49 | 11.3%(-9.27)#1,571 |
| 50. | Weyers Cave | 2.1% | 8.9%(-6.76)#50 | 11.3%(-9.23)#1,614 |
| 51. | Cascades | 2.1% | 8.9%(-6.73)#51 | 11.3%(-9.20)#1,653 |
| 52. | North Garden | 2.2% | 8.9%(-6.71)#52 | 11.3%(-9.18)#1,680 |
| 53. | Loch Lomond | 2.2% | 8.9%(-6.69)#53 | 11.3%(-9.16)#1,702 |
| 54. | Gratton | 2.2% | 8.9%(-6.69)#54 | 11.3%(-9.15)#1,711 |
| 55. | Union Mill | 2.2% | 8.9%(-6.67)#55 | 11.3%(-9.14)#1,737 |
| 56. | Oak Grove | 2.2% | 8.9%(-6.65)#56 | 11.3%(-9.12)#1,764 |
| 57. | New Baltimore | 2.2% | 8.9%(-6.63)#57 | 11.3%(-9.09)#1,793 |
| 58. | Ashburn | 2.2% | 8.9%(-6.63)#58 | 11.3%(-9.09)#1,796 |
| 59. | Countryside | 2.3% | 8.9%(-6.59)#59 | 11.3%(-9.06)#1,843 |
| 60. | Crozet | 2.3% | 8.9%(-6.53)#60 | 11.3%(-9.00)#1,906 |
| 61. | Laurel Hill | 2.4% | 8.9%(-6.52)#61 | 11.3%(-8.99)#1,925 |
| 62. | Massanetta Springs | 2.4% | 8.9%(-6.46)#62 | 11.3%(-8.93)#2,013 |
| 63. | Newington Forest | 2.4% | 8.9%(-6.45)#63 | 11.3%(-8.92)#2,023 |
| 64. | Gainesville | 2.5% | 8.9%(-6.37)#64 | 11.3%(-8.84)#2,120 |
| 65. | Dahlgren | 2.5% | 8.9%(-6.37)#65 | 11.3%(-8.84)#2,121 |
| 66. | Cana | 2.5% | 8.9%(-6.36)#66 | 11.3%(-8.82)#2,157 |
| 67. | Midlothian | 2.5% | 8.9%(-6.33)#67 | 11.3%(-8.80)#2,201 |
| 68. | Benns Church | 2.6% | 8.9%(-6.28)#68 | 11.3%(-8.75)#2,248 |
| 69. | Occoquan | 2.6% | 8.9%(-6.23)#69 | 11.3%(-8.70)#2,332 |
| 70. | Chamberlayne | 2.7% | 8.9%(-6.15)#70 | 11.3%(-8.62)#2,416 |
| 71. | Lake Barcroft | 2.7% | 8.9%(-6.14)#71 | 11.3%(-8.60)#2,438 |
| 72. | Chantilly | 2.7% | 8.9%(-6.13)#72 | 11.3%(-8.60)#2,444 |
| 73. | Pantops | 2.8% | 8.9%(-6.11)#73 | 11.3%(-8.58)#2,470 |
| 74. | Crosspointe | 2.8% | 8.9%(-6.07)#74 | 11.3%(-8.54)#2,518 |
| 75. | Shawsville | 2.8% | 8.9%(-6.04)#75 | 11.3%(-8.51)#2,554 |
| 76. | Belle Haven | 2.9% | 8.9%(-6.00)#76 | 11.3%(-8.46)#2,626 |
| 77. | Pimmit Hills | 3.0% | 8.9%(-5.89)#77 | 11.3%(-8.36)#2,774 |
| 78. | Montclair | 3.0% | 8.9%(-5.88)#78 | 11.3%(-8.35)#2,778 |
| 79. | Chester Gap | 3.0% | 8.9%(-5.87)#79 | 11.3%(-8.34)#2,799 |
| 80. | Branchville | 3.1% | 8.9%(-5.80)#80 | 11.3%(-8.26)#2,915 |
| 81. | Riverview | 3.1% | 8.9%(-5.78)#81 | 11.3%(-8.25)#2,926 |
| 82. | Woodlake | 3.1% | 8.9%(-5.74)#82 | 11.3%(-8.21)#2,983 |
| 83. | Urbanna | 3.2% | 8.9%(-5.70)#83 | 11.3%(-8.17)#3,029 |
| 84. | Daleville | 3.2% | 8.9%(-5.69)#84 | 11.3%(-8.16)#3,041 |
| 85. | Mount Hermon | 3.2% | 8.9%(-5.68)#85 | 11.3%(-8.15)#3,051 |
| 86. | South Riding | 3.2% | 8.9%(-5.63)#86 | 11.3%(-8.10)#3,131 |
| 87. | Wolf Trap | 3.2% | 8.9%(-5.63)#87 | 11.3%(-8.09)#3,148 |
| 88. | Earlysville | 3.3% | 8.9%(-5.62)#88 | 11.3%(-8.09)#3,155 |
| 89. | Purcellville | 3.3% | 8.9%(-5.61)#89 | 11.3%(-8.08)#3,177 |
| 90. | Aquia Harbour | 3.3% | 8.9%(-5.59)#90 | 11.3%(-8.06)#3,202 |
| 91. | Bloxom | 3.3% | 8.9%(-5.59)#91 | 11.3%(-8.06)#3,205 |
| 92. | Buckhall | 3.3% | 8.9%(-5.58)#92 | 11.3%(-8.05)#3,216 |
| 93. | Lovettsville | 3.3% | 8.9%(-5.57)#93 | 11.3%(-8.04)#3,235 |
| 94. | Dranesville | 3.3% | 8.9%(-5.56)#94 | 11.3%(-8.03)#3,256 |
| 95. | Laurel Park | 3.4% | 8.9%(-5.49)#95 | 11.3%(-7.96)#3,350 |
| 96. | Lake Holiday | 3.4% | 8.9%(-5.49)#96 | 11.3%(-7.96)#3,352 |
| 97. | Amherst | 3.4% | 8.9%(-5.49)#97 | 11.3%(-7.96)#3,355 |
| 98. | Falmouth | 3.4% | 8.9%(-5.46)#98 | 11.3%(-7.93)#3,399 |
| 99. | Mount Crawford | 3.5% | 8.9%(-5.38)#99 | 11.3%(-7.85)#3,519 |
| 100. | Rockwood | 3.5% | 8.9%(-5.36)#100 | 11.3%(-7.82)#3,556 |
Common Questions
What are the Top 10 Cities with the Lowest Male Poverty Level in Virginia?
Top 10 Cities with the Lowest Male Poverty Level in Virginia are:
#1
0.079%
#2
0.22%
#3
0.29%
#4
0.31%
#5
0.32%
#6
0.43%
#7
0.49%
#8
0.56%
#9
0.59%
#10
0.64%
What city has the Lowest Male Poverty Level in Virginia?
Belmont has the Lowest Male Poverty Level in Virginia with 0.079%.
What is the Poverty Level Among Males in the State of Virginia?
Poverty Level Among Males in Virginia is 8.9%.
What is the Poverty Level Among Males in the United States?
Poverty Level Among Males in the United States is 11.3%.