Roseville, CA Map & Demographics
Roseville Map
Roseville Overview
$51,684
PER CAPITA INCOME
$132,941
AVG FAMILY INCOME
$112,265
AVG HOUSEHOLD INCOME
29.8%
WAGE / INCOME GAP [ % ]
70.2¢/ $1
WAGE / INCOME GAP [ $ ]
$10,139
FAMILY INCOME DEFICIT
0.41
INEQUALITY / GINI INDEX
148,879
TOTAL POPULATION
72,697
MALE POPULATION
76,182
FEMALE POPULATION
95.43
MALES / 100 FEMALES
104.79
FEMALES / 100 MALES
39.8
MEDIAN AGE
3.1
AVG FAMILY SIZE
2.6
AVG HOUSEHOLD SIZE
77,233
LABOR FORCE [ PEOPLE ]
64.8%
PERCENT IN LABOR FORCE
4.5%
UNEMPLOYMENT RATE
Income in Roseville
Income Overview in Roseville
Per Capita Income in Roseville is $51,684, while median incomes of families and households are $132,941 and $112,265 respectively.
| Characteristic | Number | Measure |
| Per Capita Income | 148,879 | $51,684 |
| Median Family Income | 39,125 | $132,941 |
| Mean Family Income | 39,125 | $155,152 |
| Median Household Income | 56,133 | $112,265 |
| Mean Household Income | 56,133 | $134,360 |
| Income Deficit | 39,125 | $10,139 |
| Wage / Income Gap (%) | 148,879 | 29.79% |
| Wage / Income Gap ($) | 148,879 | 70.21¢ per $1 |
| Gini / Inequality Index | 148,879 | 0.41 |
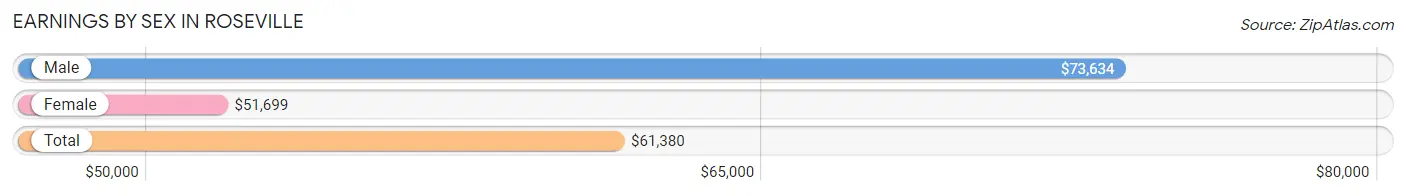
Earnings by Sex in Roseville
Average Earnings in Roseville are $61,380, $73,634 for men and $51,699 for women, a difference of 29.8%.
| Sex | Number | Average Earnings |
| Male | 41,467 (52.1%) | $73,634 |
| Female | 38,084 (47.9%) | $51,699 |
| Total | 79,551 (100.0%) | $61,380 |
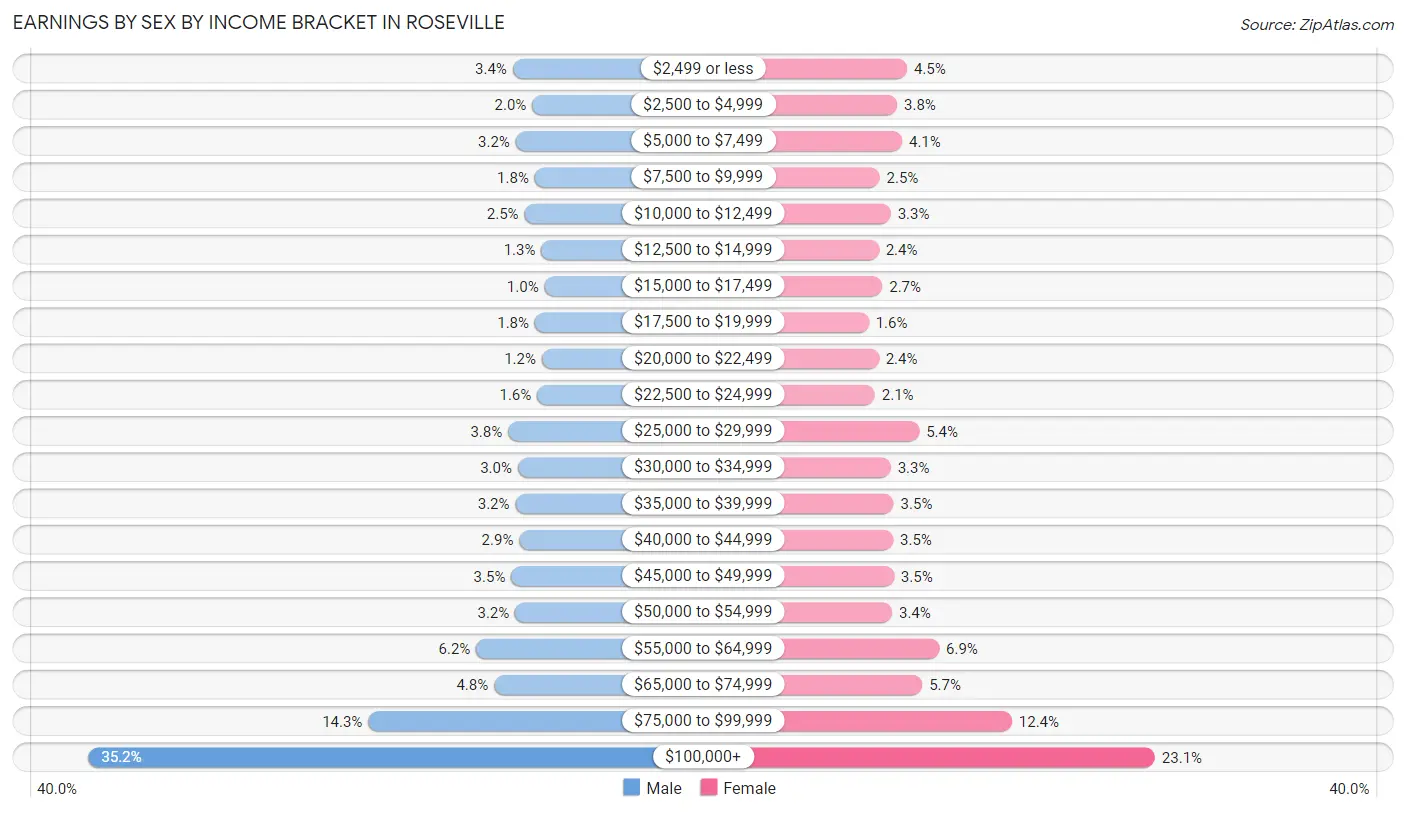
Earnings by Sex by Income Bracket in Roseville
The most common earnings brackets in Roseville are $100,000+ for men (14,605 | 35.2%) and $100,000+ for women (8,794 | 23.1%).
| Income | Male | Female |
| $2,499 or less | 1,417 (3.4%) | 1,716 (4.5%) |
| $2,500 to $4,999 | 814 (2.0%) | 1,436 (3.8%) |
| $5,000 to $7,499 | 1,326 (3.2%) | 1,578 (4.1%) |
| $7,500 to $9,999 | 736 (1.8%) | 936 (2.5%) |
| $10,000 to $12,499 | 1,055 (2.5%) | 1,252 (3.3%) |
| $12,500 to $14,999 | 532 (1.3%) | 911 (2.4%) |
| $15,000 to $17,499 | 431 (1.0%) | 1,012 (2.7%) |
| $17,500 to $19,999 | 728 (1.8%) | 625 (1.6%) |
| $20,000 to $22,499 | 516 (1.2%) | 910 (2.4%) |
| $22,500 to $24,999 | 661 (1.6%) | 800 (2.1%) |
| $25,000 to $29,999 | 1,565 (3.8%) | 2,067 (5.4%) |
| $30,000 to $34,999 | 1,260 (3.0%) | 1,253 (3.3%) |
| $35,000 to $39,999 | 1,336 (3.2%) | 1,337 (3.5%) |
| $40,000 to $44,999 | 1,215 (2.9%) | 1,320 (3.5%) |
| $45,000 to $49,999 | 1,463 (3.5%) | 1,346 (3.5%) |
| $50,000 to $54,999 | 1,343 (3.2%) | 1,292 (3.4%) |
| $55,000 to $64,999 | 2,556 (6.2%) | 2,635 (6.9%) |
| $65,000 to $74,999 | 1,998 (4.8%) | 2,153 (5.7%) |
| $75,000 to $99,999 | 5,910 (14.2%) | 4,711 (12.4%) |
| $100,000+ | 14,605 (35.2%) | 8,794 (23.1%) |
| Total | 41,467 (100.0%) | 38,084 (100.0%) |
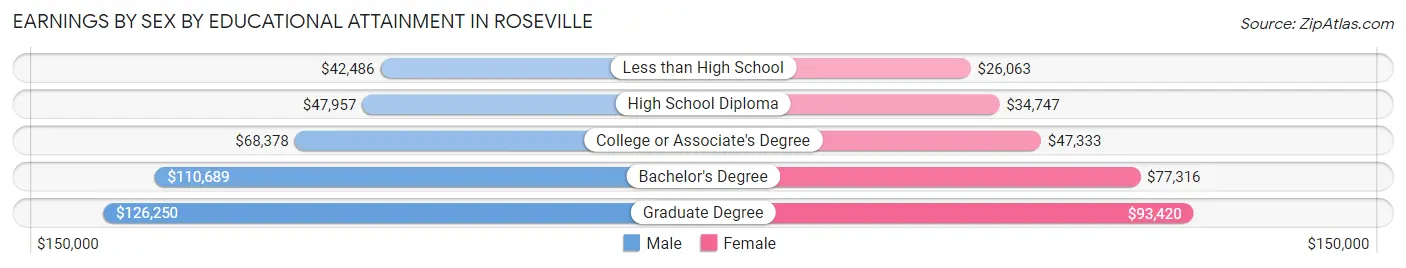
Earnings by Sex by Educational Attainment in Roseville
Average earnings in Roseville are $83,134 for men and $60,262 for women, a difference of 27.5%. Men with an educational attainment of graduate degree enjoy the highest average annual earnings of $126,250, while those with less than high school education earn the least with $42,486. Women with an educational attainment of graduate degree earn the most with the average annual earnings of $93,420, while those with less than high school education have the smallest earnings of $26,063.
| Educational Attainment | Male Income | Female Income |
| Less than High School | $42,486 | $26,063 |
| High School Diploma | $47,957 | $34,747 |
| College or Associate's Degree | $68,378 | $47,333 |
| Bachelor's Degree | $110,689 | $77,316 |
| Graduate Degree | $126,250 | $93,420 |
| Total | $83,134 | $60,262 |
Family Income in Roseville
Family Income Brackets in Roseville
According to the Roseville family income data, there are 10,446 families falling into the $200,000+ income range, which is the most common income bracket and makes up 26.7% of all families. Conversely, the $10,000 to $14,999 income bracket is the least frequent group with only 313 families (0.8%) belonging to this category.
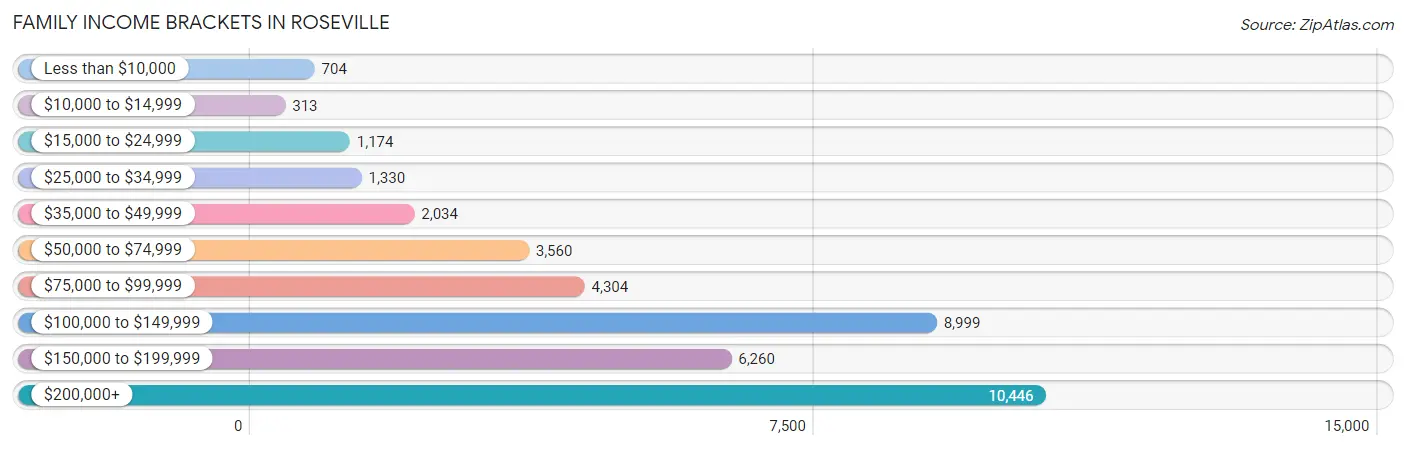
| Income Bracket | # Families | % Families |
| Less than $10,000 | 704 | 1.8% |
| $10,000 to $14,999 | 313 | 0.8% |
| $15,000 to $24,999 | 1,174 | 3.0% |
| $25,000 to $34,999 | 1,330 | 3.4% |
| $35,000 to $49,999 | 2,034 | 5.2% |
| $50,000 to $74,999 | 3,560 | 9.1% |
| $75,000 to $99,999 | 4,304 | 11.0% |
| $100,000 to $149,999 | 8,999 | 23.0% |
| $150,000 to $199,999 | 6,260 | 16.0% |
| $200,000+ | 10,446 | 26.7% |
Family Income by Famaliy Size in Roseville
4-person families (8,153 | 20.8%) account for the highest median family income in Roseville with $173,884 per family, while 2-person families (17,063 | 43.6%) have the highest median income of $56,357 per family member.
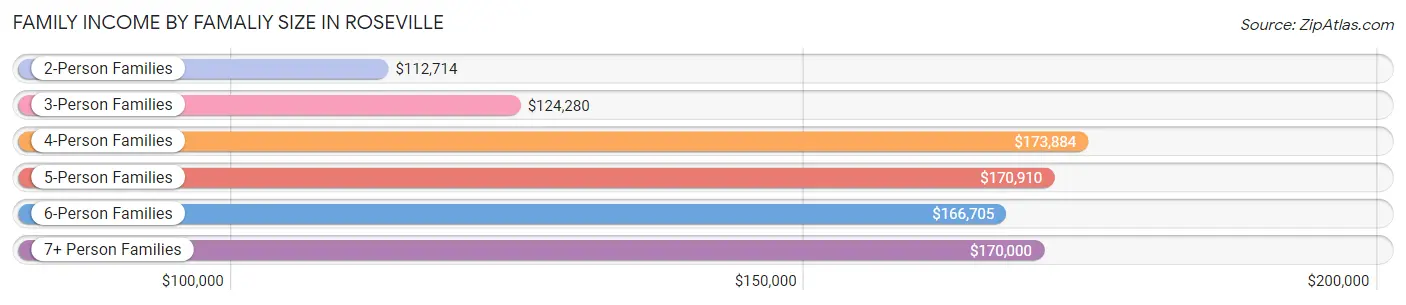
| Income Bracket | # Families | Median Income |
| 2-Person Families | 17,063 (43.6%) | $112,714 |
| 3-Person Families | 9,077 (23.2%) | $124,280 |
| 4-Person Families | 8,153 (20.8%) | $173,884 |
| 5-Person Families | 3,467 (8.9%) | $170,910 |
| 6-Person Families | 1,125 (2.9%) | $166,705 |
| 7+ Person Families | 240 (0.6%) | $170,000 |
| Total | 39,125 (100.0%) | $132,941 |
Family Income by Number of Earners in Roseville
The median family income in Roseville is $132,941, with families comprising 3+ earners (4,704) having the highest median family income of $199,865, while families with no earners (5,568) have the lowest median family income of $71,129, accounting for 12.0% and 14.2% of families, respectively.
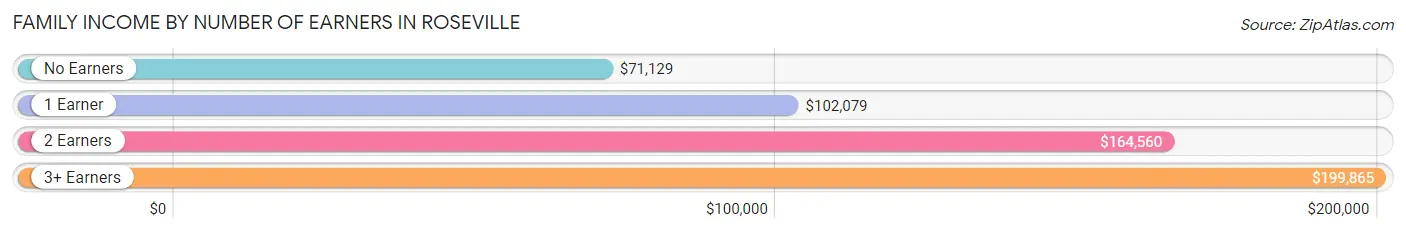
| Number of Earners | # Families | Median Income |
| No Earners | 5,568 (14.2%) | $71,129 |
| 1 Earner | 12,089 (30.9%) | $102,079 |
| 2 Earners | 16,764 (42.8%) | $164,560 |
| 3+ Earners | 4,704 (12.0%) | $199,865 |
| Total | 39,125 (100.0%) | $132,941 |
Household Income in Roseville
Household Income Brackets in Roseville
With 11,788 households falling in the category, the $100,000 to $149,999 income range is the most frequent in Roseville, accounting for 21.0% of all households. In contrast, only 786 households (1.4%) fall into the $10,000 to $14,999 income bracket, making it the least populous group.
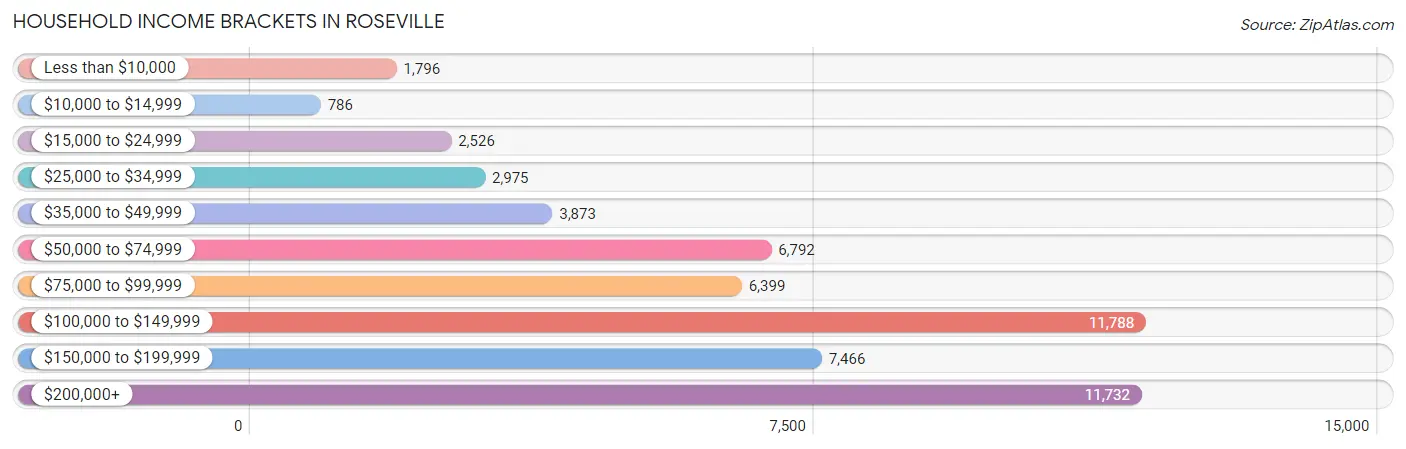
| Income Bracket | # Households | % Households |
| Less than $10,000 | 1,796 | 3.2% |
| $10,000 to $14,999 | 786 | 1.4% |
| $15,000 to $24,999 | 2,526 | 4.5% |
| $25,000 to $34,999 | 2,975 | 5.3% |
| $35,000 to $49,999 | 3,873 | 6.9% |
| $50,000 to $74,999 | 6,792 | 12.1% |
| $75,000 to $99,999 | 6,399 | 11.4% |
| $100,000 to $149,999 | 11,788 | 21.0% |
| $150,000 to $199,999 | 7,466 | 13.3% |
| $200,000+ | 11,732 | 20.9% |
Household Income by Householder Age in Roseville
The median household income in Roseville is $112,265, with the highest median household income of $136,834 found in the 45 to 64 years age bracket for the primary householder. A total of 21,535 households (38.4%) fall into this category. Meanwhile, the 65+ years age bracket for the primary householder has the lowest median household income of $67,007, with 15,068 households (26.8%) in this group.
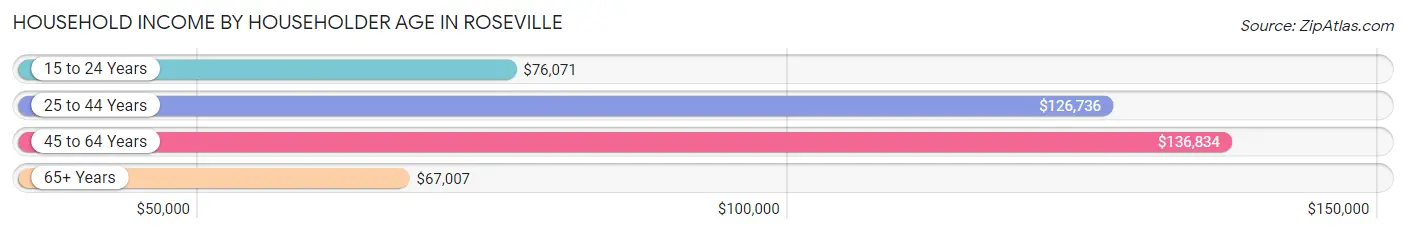
| Income Bracket | # Households | Median Income |
| 15 to 24 Years | 1,324 (2.4%) | $76,071 |
| 25 to 44 Years | 18,206 (32.4%) | $126,736 |
| 45 to 64 Years | 21,535 (38.4%) | $136,834 |
| 65+ Years | 15,068 (26.8%) | $67,007 |
| Total | 56,133 (100.0%) | $112,265 |
Poverty in Roseville
Income Below Poverty by Sex and Age in Roseville
With 5.2% poverty level for males and 7.5% for females among the residents of Roseville, 75 year old and over males and 16 and 17 year old females are the most vulnerable to poverty, with 404 males (9.0%) and 396 females (18.5%) in their respective age groups living below the poverty level.
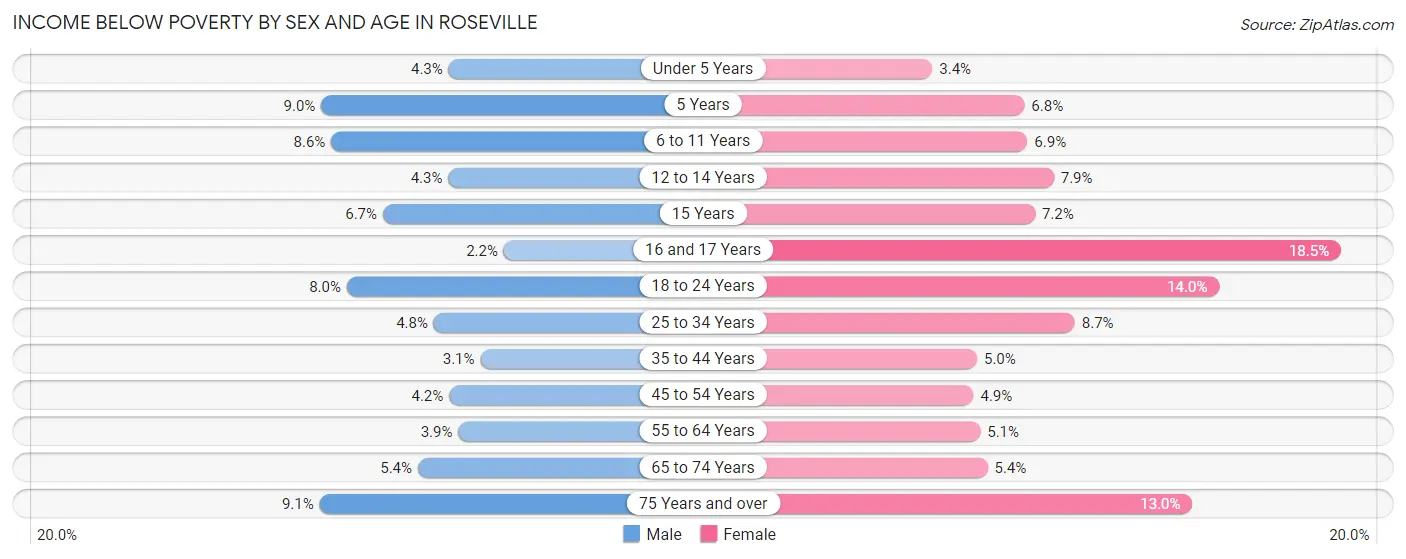
| Age Bracket | Male | Female |
| Under 5 Years | 202 (4.3%) | 135 (3.4%) |
| 5 Years | 93 (9.0%) | 49 (6.8%) |
| 6 to 11 Years | 447 (8.6%) | 394 (6.9%) |
| 12 to 14 Years | 135 (4.3%) | 222 (7.9%) |
| 15 Years | 75 (6.7%) | 65 (7.2%) |
| 16 and 17 Years | 45 (2.2%) | 396 (18.5%) |
| 18 to 24 Years | 478 (8.0%) | 777 (14.0%) |
| 25 to 34 Years | 448 (4.8%) | 831 (8.6%) |
| 35 to 44 Years | 335 (3.1%) | 528 (5.0%) |
| 45 to 54 Years | 396 (4.2%) | 489 (4.9%) |
| 55 to 64 Years | 341 (3.9%) | 489 (5.1%) |
| 65 to 74 Years | 342 (5.4%) | 408 (5.4%) |
| 75 Years and over | 404 (9.0%) | 875 (13.0%) |
| Total | 3,741 (5.2%) | 5,658 (7.5%) |
Income Above Poverty by Sex and Age in Roseville
According to the poverty statistics in Roseville, males aged 16 and 17 years and females aged under 5 years are the age groups that are most secure financially, with 97.8% of males and 96.6% of females in these age groups living above the poverty line.
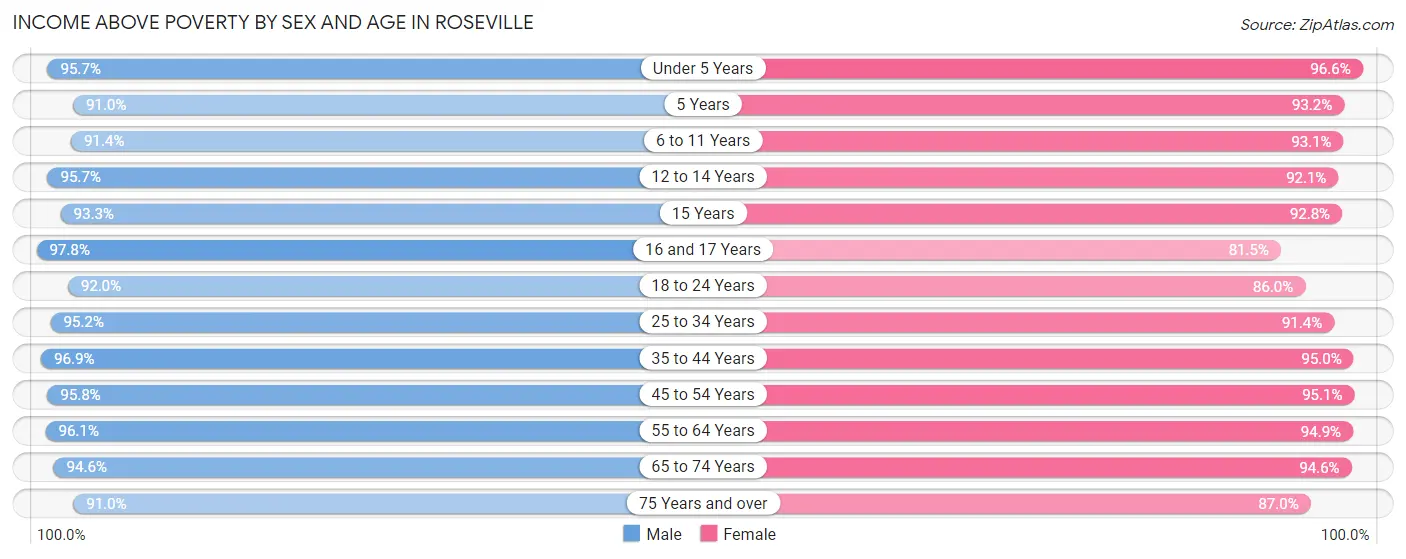
| Age Bracket | Male | Female |
| Under 5 Years | 4,544 (95.7%) | 3,877 (96.6%) |
| 5 Years | 941 (91.0%) | 674 (93.2%) |
| 6 to 11 Years | 4,738 (91.4%) | 5,321 (93.1%) |
| 12 to 14 Years | 3,027 (95.7%) | 2,599 (92.1%) |
| 15 Years | 1,045 (93.3%) | 841 (92.8%) |
| 16 and 17 Years | 1,987 (97.8%) | 1,741 (81.5%) |
| 18 to 24 Years | 5,469 (92.0%) | 4,770 (86.0%) |
| 25 to 34 Years | 8,868 (95.2%) | 8,779 (91.3%) |
| 35 to 44 Years | 10,527 (96.9%) | 9,984 (95.0%) |
| 45 to 54 Years | 8,946 (95.8%) | 9,520 (95.1%) |
| 55 to 64 Years | 8,396 (96.1%) | 9,024 (94.9%) |
| 65 to 74 Years | 5,995 (94.6%) | 7,133 (94.6%) |
| 75 Years and over | 4,058 (90.9%) | 5,851 (87.0%) |
| Total | 68,541 (94.8%) | 70,114 (92.5%) |
Income Below Poverty Among Married-Couple Families in Roseville
The poverty statistics for married-couple families in Roseville show that 2.3% or 690 of the total 30,378 families live below the poverty line. Families with 5 or more children have the highest poverty rate of 6.2%, comprising of 3 families. On the other hand, families with 3 or 4 children have the lowest poverty rate of 2.1%, which includes 55 families.
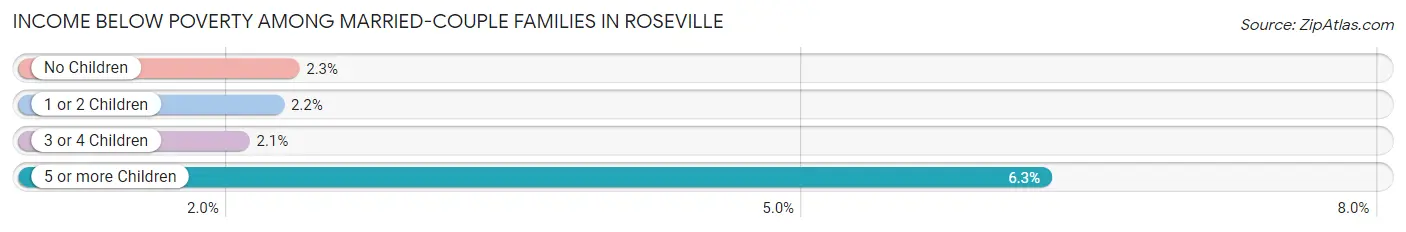
| Children | Above Poverty | Below Poverty |
| No Children | 15,887 (97.7%) | 377 (2.3%) |
| 1 or 2 Children | 11,146 (97.8%) | 255 (2.2%) |
| 3 or 4 Children | 2,610 (97.9%) | 55 (2.1%) |
| 5 or more Children | 45 (93.8%) | 3 (6.2%) |
| Total | 29,688 (97.7%) | 690 (2.3%) |
Income Below Poverty Among Single-Parent Households in Roseville
According to the poverty data in Roseville, 9.7% or 301 single-father households and 13.7% or 772 single-mother households are living below the poverty line. Among single-father households, those with 1 or 2 children have the highest poverty rate, with 260 households (18.8%) experiencing poverty. Likewise, among single-mother households, those with 3 or 4 children have the highest poverty rate, with 185 households (47.6%) falling below the poverty line.
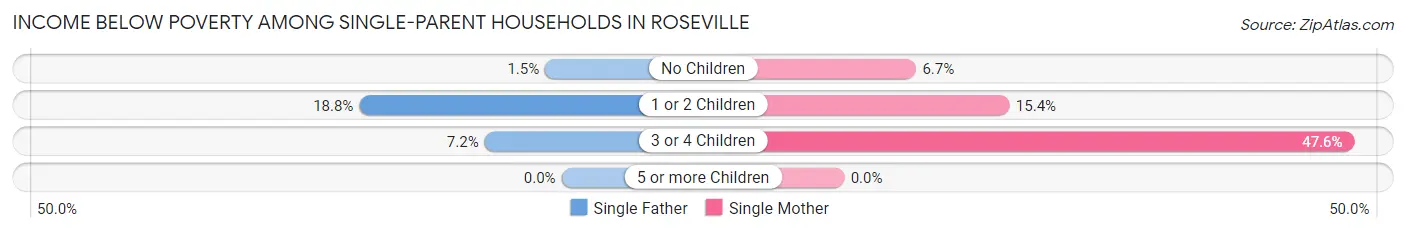
| Children | Single Father | Single Mother |
| No Children | 22 (1.5%) | 172 (6.7%) |
| 1 or 2 Children | 260 (18.8%) | 415 (15.4%) |
| 3 or 4 Children | 19 (7.2%) | 185 (47.6%) |
| 5 or more Children | 0 (0.0%) | 0 (0.0%) |
| Total | 301 (9.7%) | 772 (13.7%) |
Income Below Poverty Among Married-Couple vs Single-Parent Households in Roseville
The poverty data for Roseville shows that 690 of the married-couple family households (2.3%) and 1,073 of the single-parent households (12.3%) are living below the poverty level. Within the married-couple family households, those with 5 or more children have the highest poverty rate, with 3 households (6.2%) falling below the poverty line. Among the single-parent households, those with 3 or 4 children have the highest poverty rate, with 204 household (31.2%) living below poverty.
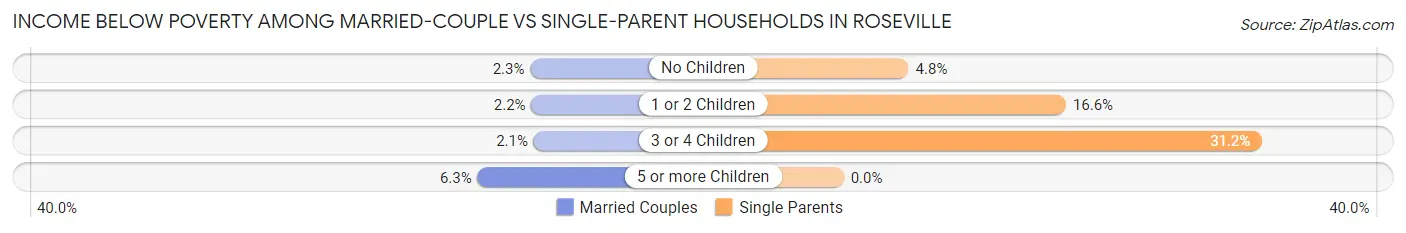
| Children | Married-Couple Families | Single-Parent Households |
| No Children | 377 (2.3%) | 194 (4.8%) |
| 1 or 2 Children | 255 (2.2%) | 675 (16.6%) |
| 3 or 4 Children | 55 (2.1%) | 204 (31.2%) |
| 5 or more Children | 3 (6.2%) | 0 (0.0%) |
| Total | 690 (2.3%) | 1,073 (12.3%) |
Race in Roseville
The most populous races in Roseville are White / Caucasian (105,325 | 70.8%), Hispanic or Latino (23,699 | 15.9%), and Asian (18,919 | 12.7%).
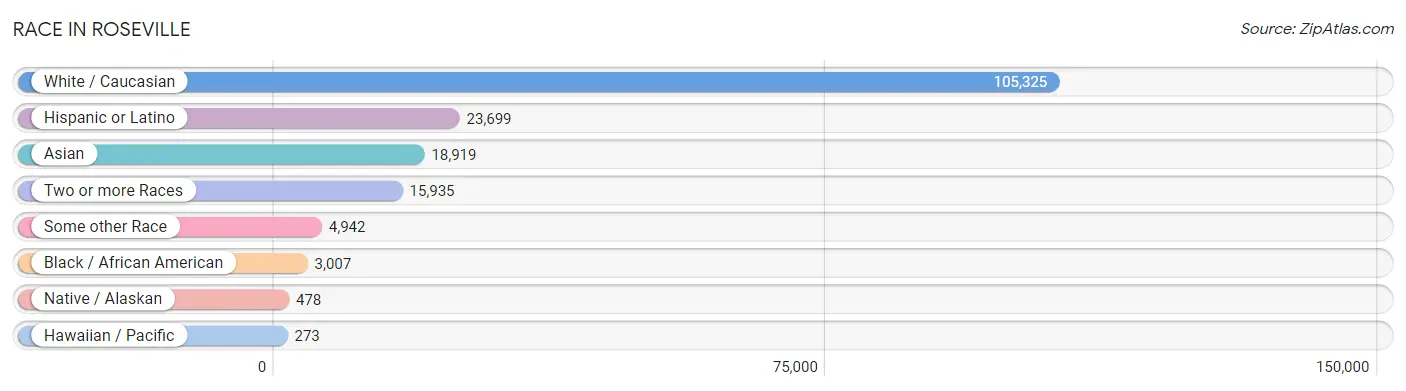
| Race | # Population | % Population |
| Asian | 18,919 | 12.7% |
| Black / African American | 3,007 | 2.0% |
| Hawaiian / Pacific | 273 | 0.2% |
| Hispanic or Latino | 23,699 | 15.9% |
| Native / Alaskan | 478 | 0.3% |
| White / Caucasian | 105,325 | 70.8% |
| Two or more Races | 15,935 | 10.7% |
| Some other Race | 4,942 | 3.3% |
| Total | 148,879 | 100.0% |
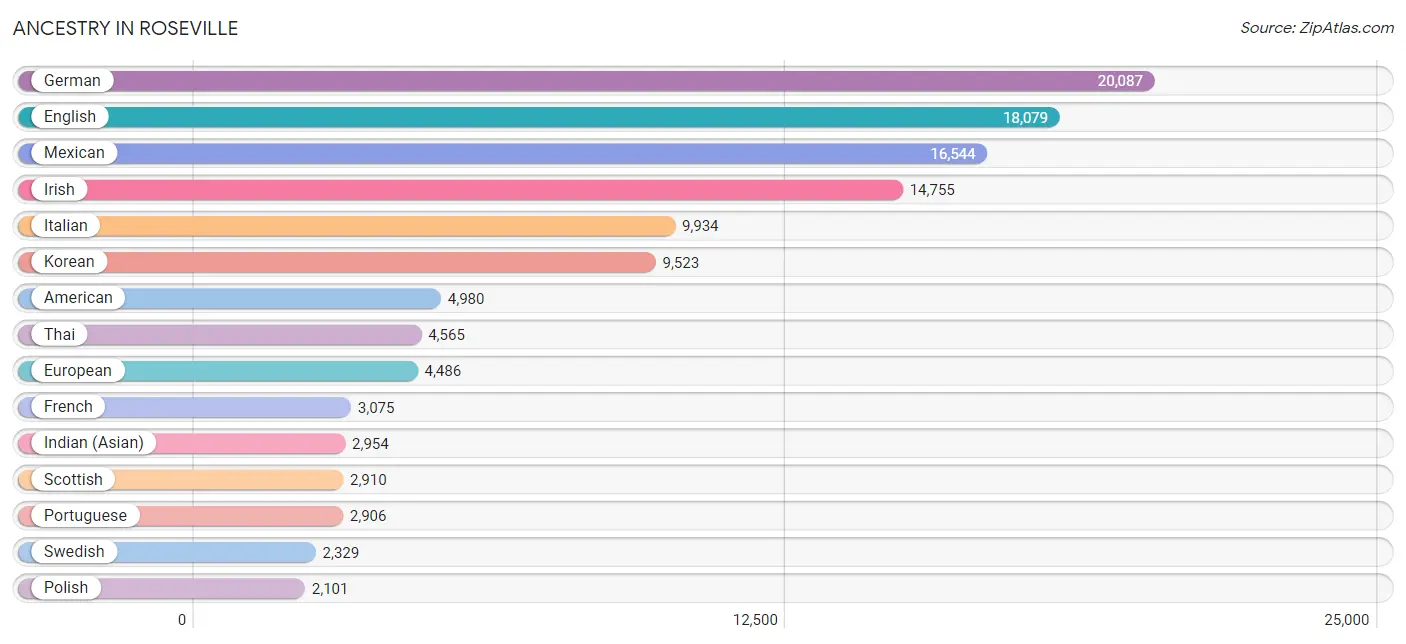
Ancestry in Roseville
The most populous ancestries reported in Roseville are German (20,087 | 13.5%), English (18,079 | 12.1%), Mexican (16,544 | 11.1%), Irish (14,755 | 9.9%), and Italian (9,934 | 6.7%), together accounting for 53.3% of all Roseville residents.
| Ancestry | # Population | % Population |
| Afghan | 760 | 0.5% |
| African | 347 | 0.2% |
| American | 4,980 | 3.3% |
| Apache | 137 | 0.1% |
| Arab | 839 | 0.6% |
| Arapaho | 18 | 0.0% |
| Argentinean | 39 | 0.0% |
| Armenian | 254 | 0.2% |
| Assyrian / Chaldean / Syriac | 10 | 0.0% |
| Australian | 43 | 0.0% |
| Austrian | 257 | 0.2% |
| Bangladeshi | 66 | 0.0% |
| Basque | 82 | 0.1% |
| Belgian | 179 | 0.1% |
| Belizean | 90 | 0.1% |
| Bhutanese | 1,759 | 1.2% |
| Blackfeet | 223 | 0.2% |
| Bolivian | 82 | 0.1% |
| Brazilian | 79 | 0.1% |
| British | 1,588 | 1.1% |
| Bulgarian | 93 | 0.1% |
| Burmese | 937 | 0.6% |
| Cambodian | 421 | 0.3% |
| Canadian | 828 | 0.6% |
| Cape Verdean | 39 | 0.0% |
| Central American | 1,421 | 0.9% |
| Central American Indian | 87 | 0.1% |
| Cherokee | 502 | 0.3% |
| Chickasaw | 12 | 0.0% |
| Chilean | 51 | 0.0% |
| Chinese | 50 | 0.0% |
| Choctaw | 112 | 0.1% |
| Colombian | 508 | 0.3% |
| Costa Rican | 95 | 0.1% |
| Creek | 47 | 0.0% |
| Croatian | 200 | 0.1% |
| Cuban | 415 | 0.3% |
| Czech | 394 | 0.3% |
| Czechoslovakian | 216 | 0.2% |
| Danish | 1,437 | 1.0% |
| Dutch | 1,669 | 1.1% |
| Eastern European | 298 | 0.2% |
| Ecuadorian | 88 | 0.1% |
| Egyptian | 137 | 0.1% |
| English | 18,079 | 12.1% |
| Estonian | 10 | 0.0% |
| Ethiopian | 112 | 0.1% |
| European | 4,486 | 3.0% |
| Filipino | 99 | 0.1% |
| Finnish | 291 | 0.2% |
| French | 3,075 | 2.1% |
| French Canadian | 670 | 0.4% |
| German | 20,087 | 13.5% |
| Greek | 829 | 0.6% |
| Guamanian / Chamorro | 252 | 0.2% |
| Guatemalan | 299 | 0.2% |
| Guyanese | 15 | 0.0% |
| Honduran | 119 | 0.1% |
| Hungarian | 443 | 0.3% |
| Icelander | 11 | 0.0% |
| Indian (Asian) | 2,954 | 2.0% |
| Indonesian | 44 | 0.0% |
| Inupiat | 29 | 0.0% |
| Iranian | 1,586 | 1.1% |
| Iraqi | 13 | 0.0% |
| Irish | 14,755 | 9.9% |
| Iroquois | 41 | 0.0% |
| Israeli | 95 | 0.1% |
| Italian | 9,934 | 6.7% |
| Jamaican | 73 | 0.1% |
| Japanese | 216 | 0.2% |
| Jordanian | 20 | 0.0% |
| Kenyan | 28 | 0.0% |
| Korean | 9,523 | 6.4% |
| Laotian | 89 | 0.1% |
| Latvian | 28 | 0.0% |
| Lebanese | 227 | 0.2% |
| Lithuanian | 93 | 0.1% |
| Luxembourger | 80 | 0.1% |
| Malaysian | 127 | 0.1% |
| Maltese | 26 | 0.0% |
| Mexican | 16,544 | 11.1% |
| Mexican American Indian | 213 | 0.1% |
| Moroccan | 23 | 0.0% |
| Native Hawaiian | 588 | 0.4% |
| Navajo | 98 | 0.1% |
| Nepalese | 410 | 0.3% |
| Nicaraguan | 314 | 0.2% |
| Nigerian | 72 | 0.1% |
| Northern European | 471 | 0.3% |
| Norwegian | 2,070 | 1.4% |
| Pakistani | 60 | 0.0% |
| Palestinian | 215 | 0.1% |
| Panamanian | 19 | 0.0% |
| Pennsylvania German | 38 | 0.0% |
| Peruvian | 273 | 0.2% |
| Polish | 2,101 | 1.4% |
| Portuguese | 2,906 | 1.9% |
| Puerto Rican | 1,430 | 1.0% |
| Romanian | 520 | 0.4% |
| Russian | 1,637 | 1.1% |
| Salvadoran | 575 | 0.4% |
| Samoan | 231 | 0.2% |
| Scandinavian | 1,131 | 0.8% |
| Scotch-Irish | 1,144 | 0.8% |
| Scottish | 2,910 | 1.9% |
| Serbian | 10 | 0.0% |
| Sioux | 52 | 0.0% |
| Slavic | 63 | 0.0% |
| Slovak | 119 | 0.1% |
| South African | 120 | 0.1% |
| South American | 1,278 | 0.9% |
| Spaniard | 864 | 0.6% |
| Spanish | 807 | 0.5% |
| Spanish American | 18 | 0.0% |
| Sri Lankan | 1,860 | 1.3% |
| Subsaharan African | 749 | 0.5% |
| Swedish | 2,329 | 1.6% |
| Swiss | 590 | 0.4% |
| Syrian | 96 | 0.1% |
| Thai | 4,565 | 3.1% |
| Tongan | 163 | 0.1% |
| Turkish | 50 | 0.0% |
| U.S. Virgin Islander | 36 | 0.0% |
| Ukrainian | 1,348 | 0.9% |
| Uruguayan | 13 | 0.0% |
| Venezuelan | 224 | 0.2% |
| Vietnamese | 203 | 0.1% |
| Welsh | 816 | 0.5% |
| West Indian | 30 | 0.0% |
| Yakama | 9 | 0.0% |
| Yugoslavian | 278 | 0.2% | View All 132 Rows |
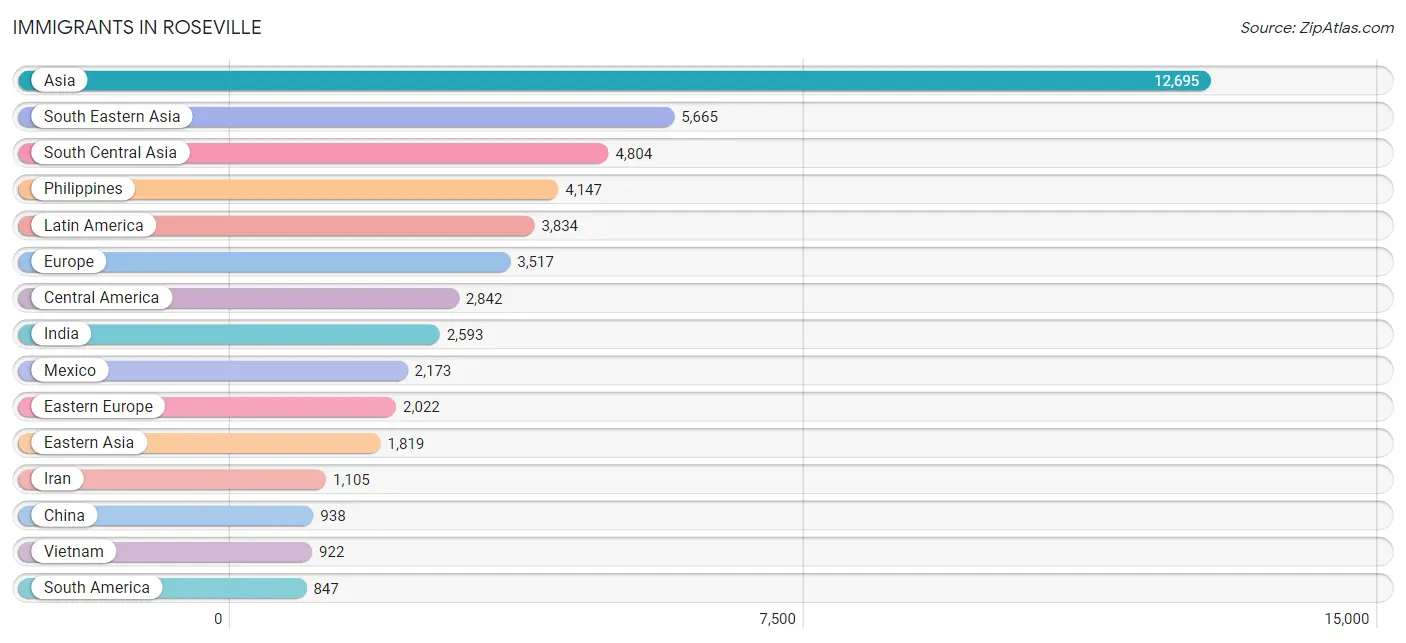
Immigrants in Roseville
The most numerous immigrant groups reported in Roseville came from Asia (12,695 | 8.5%), South Eastern Asia (5,665 | 3.8%), South Central Asia (4,804 | 3.2%), Philippines (4,147 | 2.8%), and Latin America (3,834 | 2.6%), together accounting for 20.9% of all Roseville residents.
| Immigration Origin | # Population | % Population |
| Afghanistan | 744 | 0.5% |
| Africa | 710 | 0.5% |
| Argentina | 83 | 0.1% |
| Armenia | 11 | 0.0% |
| Asia | 12,695 | 8.5% |
| Australia | 50 | 0.0% |
| Austria | 55 | 0.0% |
| Azores | 23 | 0.0% |
| Bangladesh | 99 | 0.1% |
| Belarus | 117 | 0.1% |
| Belize | 39 | 0.0% |
| Bolivia | 20 | 0.0% |
| Brazil | 112 | 0.1% |
| Cambodia | 107 | 0.1% |
| Canada | 823 | 0.5% |
| Caribbean | 145 | 0.1% |
| Central America | 2,842 | 1.9% |
| Chile | 42 | 0.0% |
| China | 938 | 0.6% |
| Colombia | 212 | 0.1% |
| Costa Rica | 35 | 0.0% |
| Croatia | 22 | 0.0% |
| Cuba | 90 | 0.1% |
| Czechoslovakia | 96 | 0.1% |
| Denmark | 3 | 0.0% |
| Dominica | 7 | 0.0% |
| Eastern Africa | 276 | 0.2% |
| Eastern Asia | 1,819 | 1.2% |
| Eastern Europe | 2,022 | 1.4% |
| Ecuador | 88 | 0.1% |
| Egypt | 129 | 0.1% |
| El Salvador | 175 | 0.1% |
| England | 367 | 0.3% |
| Ethiopia | 51 | 0.0% |
| Europe | 3,517 | 2.4% |
| Fiji | 336 | 0.2% |
| France | 87 | 0.1% |
| Germany | 186 | 0.1% |
| Ghana | 48 | 0.0% |
| Greece | 57 | 0.0% |
| Guatemala | 90 | 0.1% |
| Guyana | 32 | 0.0% |
| Honduras | 69 | 0.1% |
| Hong Kong | 61 | 0.0% |
| Hungary | 24 | 0.0% |
| India | 2,593 | 1.7% |
| Indonesia | 41 | 0.0% |
| Iran | 1,105 | 0.7% |
| Iraq | 23 | 0.0% |
| Ireland | 8 | 0.0% |
| Israel | 8 | 0.0% |
| Italy | 47 | 0.0% |
| Jamaica | 48 | 0.0% |
| Japan | 151 | 0.1% |
| Jordan | 95 | 0.1% |
| Kazakhstan | 10 | 0.0% |
| Kenya | 144 | 0.1% |
| Korea | 440 | 0.3% |
| Laos | 87 | 0.1% |
| Latin America | 3,834 | 2.6% |
| Latvia | 7 | 0.0% |
| Lebanon | 35 | 0.0% |
| Mexico | 2,173 | 1.5% |
| Middle Africa | 13 | 0.0% |
| Moldova | 91 | 0.1% |
| Morocco | 27 | 0.0% |
| Netherlands | 50 | 0.0% |
| Nicaragua | 207 | 0.1% |
| Northern Africa | 156 | 0.1% |
| Northern Europe | 754 | 0.5% |
| Norway | 60 | 0.0% |
| Oceania | 423 | 0.3% |
| Pakistan | 72 | 0.1% |
| Panama | 54 | 0.0% |
| Peru | 61 | 0.0% |
| Philippines | 4,147 | 2.8% |
| Poland | 12 | 0.0% |
| Portugal | 143 | 0.1% |
| Romania | 341 | 0.2% |
| Russia | 594 | 0.4% |
| Saudi Arabia | 24 | 0.0% |
| Scotland | 22 | 0.0% |
| South Africa | 144 | 0.1% |
| South America | 847 | 0.6% |
| South Central Asia | 4,804 | 3.2% |
| South Eastern Asia | 5,665 | 3.8% |
| Southern Europe | 327 | 0.2% |
| Spain | 80 | 0.1% |
| Sri Lanka | 106 | 0.1% |
| Sweden | 34 | 0.0% |
| Switzerland | 36 | 0.0% |
| Syria | 58 | 0.0% |
| Taiwan | 179 | 0.1% |
| Thailand | 258 | 0.2% |
| Turkey | 7 | 0.0% |
| Uganda | 40 | 0.0% |
| Ukraine | 703 | 0.5% |
| Uruguay | 28 | 0.0% |
| Uzbekistan | 33 | 0.0% |
| Venezuela | 169 | 0.1% |
| Vietnam | 922 | 0.6% |
| Western Africa | 48 | 0.0% |
| Western Asia | 295 | 0.2% |
| Western Europe | 414 | 0.3% |
| Zaire | 13 | 0.0% | View All 105 Rows |
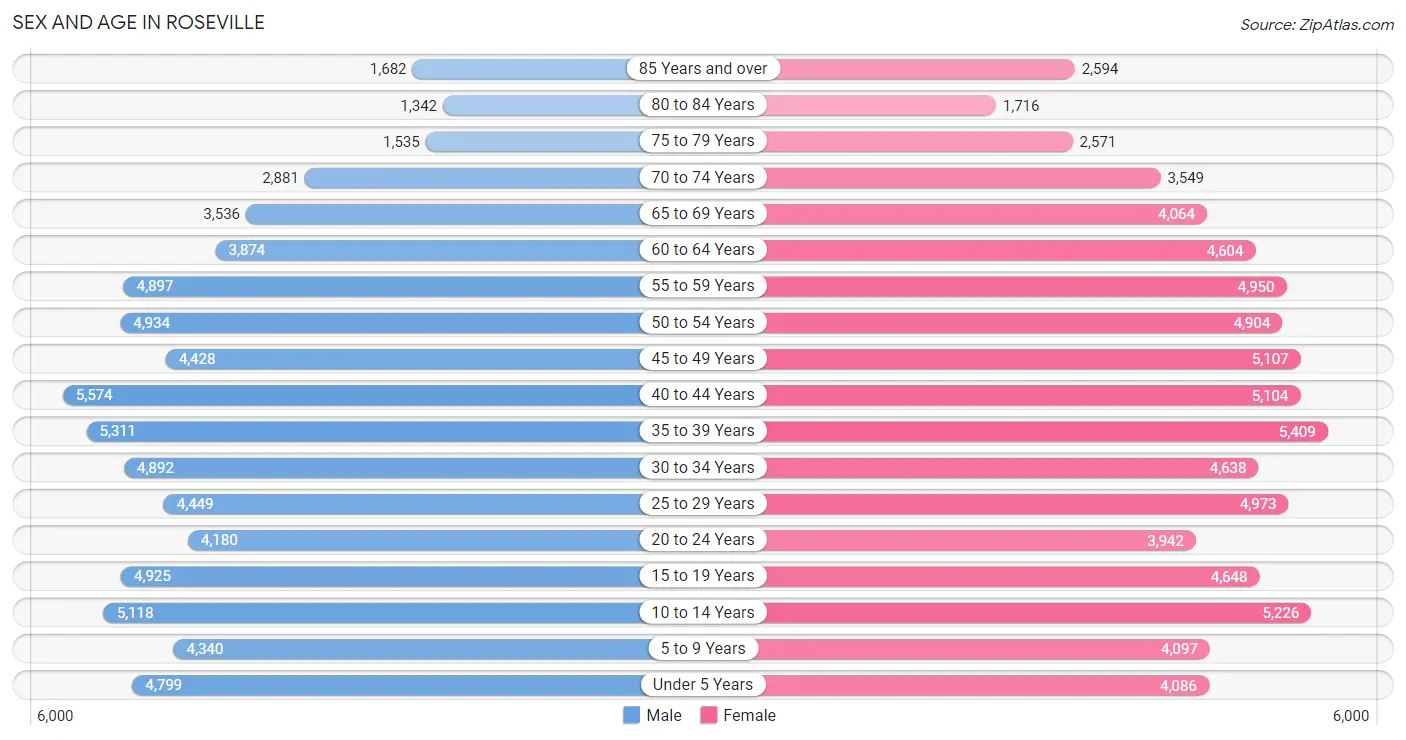
Sex and Age in Roseville
Sex and Age in Roseville
The most populous age groups in Roseville are 40 to 44 Years (5,574 | 7.7%) for men and 35 to 39 Years (5,409 | 7.1%) for women.
| Age Bracket | Male | Female |
| Under 5 Years | 4,799 (6.6%) | 4,086 (5.4%) |
| 5 to 9 Years | 4,340 (6.0%) | 4,097 (5.4%) |
| 10 to 14 Years | 5,118 (7.0%) | 5,226 (6.9%) |
| 15 to 19 Years | 4,925 (6.8%) | 4,648 (6.1%) |
| 20 to 24 Years | 4,180 (5.8%) | 3,942 (5.2%) |
| 25 to 29 Years | 4,449 (6.1%) | 4,973 (6.5%) |
| 30 to 34 Years | 4,892 (6.7%) | 4,638 (6.1%) |
| 35 to 39 Years | 5,311 (7.3%) | 5,409 (7.1%) |
| 40 to 44 Years | 5,574 (7.7%) | 5,104 (6.7%) |
| 45 to 49 Years | 4,428 (6.1%) | 5,107 (6.7%) |
| 50 to 54 Years | 4,934 (6.8%) | 4,904 (6.4%) |
| 55 to 59 Years | 4,897 (6.7%) | 4,950 (6.5%) |
| 60 to 64 Years | 3,874 (5.3%) | 4,604 (6.0%) |
| 65 to 69 Years | 3,536 (4.9%) | 4,064 (5.3%) |
| 70 to 74 Years | 2,881 (4.0%) | 3,549 (4.7%) |
| 75 to 79 Years | 1,535 (2.1%) | 2,571 (3.4%) |
| 80 to 84 Years | 1,342 (1.8%) | 1,716 (2.2%) |
| 85 Years and over | 1,682 (2.3%) | 2,594 (3.4%) |
| Total | 72,697 (100.0%) | 76,182 (100.0%) |
Families and Households in Roseville
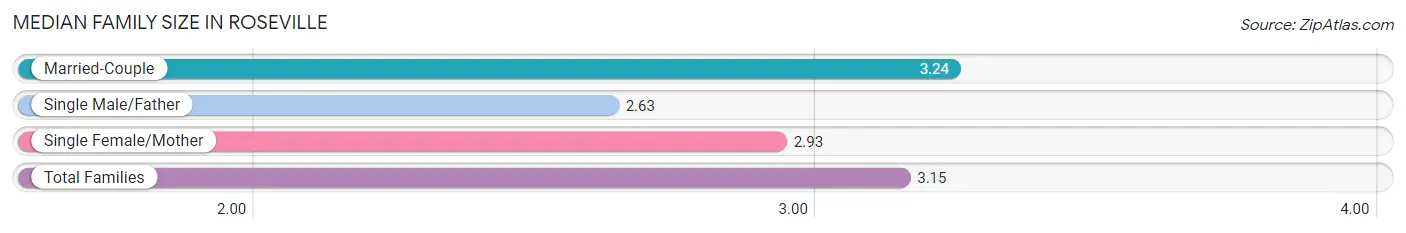
Median Family Size in Roseville
The median family size in Roseville is 3.15 persons per family, with married-couple families (30,378 | 77.6%) accounting for the largest median family size of 3.24 persons per family. On the other hand, single male/father families (3,090 | 7.9%) represent the smallest median family size with 2.63 persons per family.
| Family Type | # Families | Family Size |
| Married-Couple | 30,378 (77.6%) | 3.24 |
| Single Male/Father | 3,090 (7.9%) | 2.63 |
| Single Female/Mother | 5,657 (14.5%) | 2.93 |
| Total Families | 39,125 (100.0%) | 3.15 |
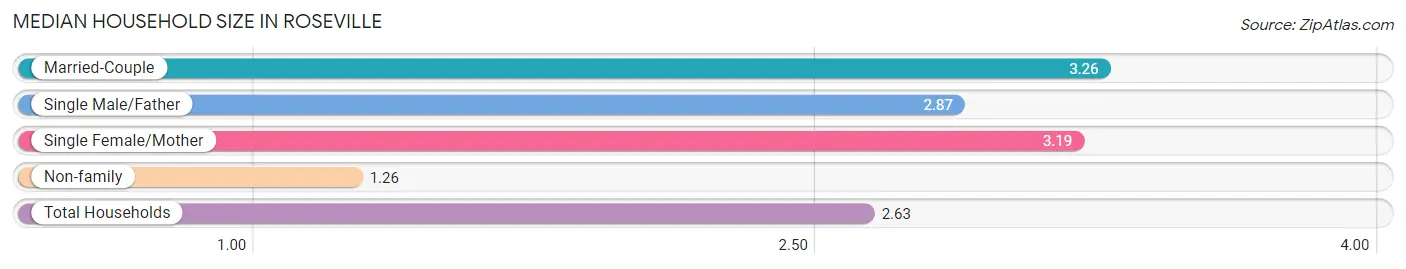
Median Household Size in Roseville
The median household size in Roseville is 2.63 persons per household, with married-couple households (30,378 | 54.1%) accounting for the largest median household size of 3.26 persons per household. non-family households (17,008 | 30.3%) represent the smallest median household size with 1.26 persons per household.
| Household Type | # Households | Household Size |
| Married-Couple | 30,378 (54.1%) | 3.26 |
| Single Male/Father | 3,090 (5.5%) | 2.87 |
| Single Female/Mother | 5,657 (10.1%) | 3.19 |
| Non-family | 17,008 (30.3%) | 1.26 |
| Total Households | 56,133 (100.0%) | 2.63 |
Household Size by Marriage Status in Roseville
Out of a total of 56,133 households in Roseville, 39,125 (69.7%) are family households, while 17,008 (30.3%) are nonfamily households. The most numerous type of family households are 2-person households, comprising 16,057, and the most common type of nonfamily households are 1-person households, comprising 13,698.
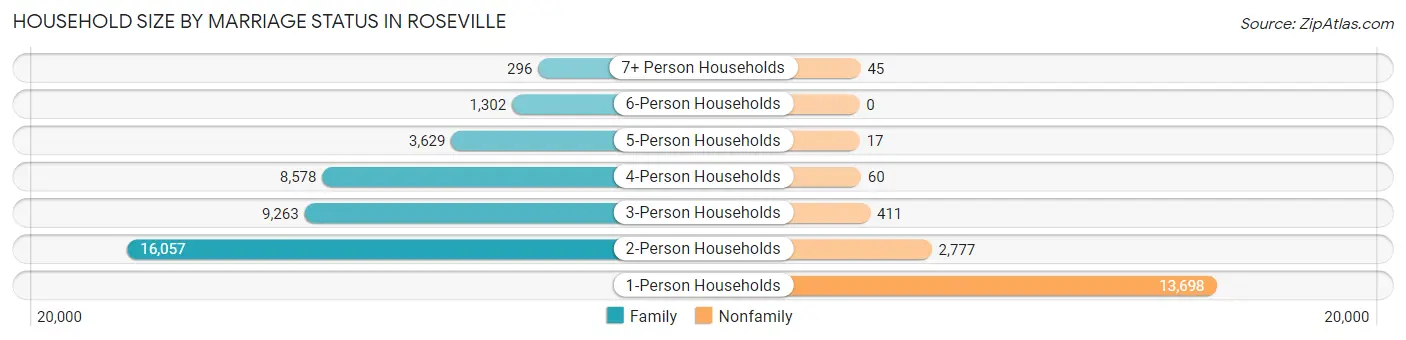
| Household Size | Family Households | Nonfamily Households |
| 1-Person Households | - | 13,698 (24.4%) |
| 2-Person Households | 16,057 (28.6%) | 2,777 (5.0%) |
| 3-Person Households | 9,263 (16.5%) | 411 (0.7%) |
| 4-Person Households | 8,578 (15.3%) | 60 (0.1%) |
| 5-Person Households | 3,629 (6.5%) | 17 (0.0%) |
| 6-Person Households | 1,302 (2.3%) | 0 (0.0%) |
| 7+ Person Households | 296 (0.5%) | 45 (0.1%) |
| Total | 39,125 (69.7%) | 17,008 (30.3%) |
Female Fertility in Roseville
Fertility by Age in Roseville
Average fertility rate in Roseville is 56.0 births per 1,000 women. Women in the age bracket of 20 to 34 years have the highest fertility rate with 96.0 births per 1,000 women. Women in the age bracket of 20 to 34 years acount for 66.6% of all women with births.
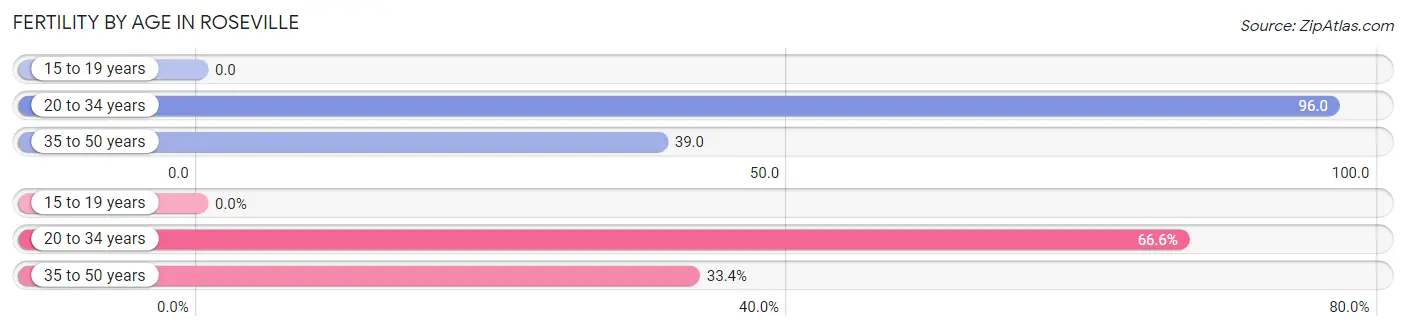
| Age Bracket | Women with Births | Births / 1,000 Women |
| 15 to 19 years | 0 (0.0%) | 0.0 |
| 20 to 34 years | 1,305 (66.6%) | 96.0 |
| 35 to 50 years | 654 (33.4%) | 39.0 |
| Total | 1,959 (100.0%) | 56.0 |
Fertility by Age by Marriage Status in Roseville
83.7% of women with births (1,959) in Roseville are married. The highest percentage of unmarried women with births falls into 35 to 50 years age bracket with 17.6% of them unmarried at the time of birth, while the lowest percentage of unmarried women with births belong to 20 to 34 years age bracket with 15.7% of them unmarried.
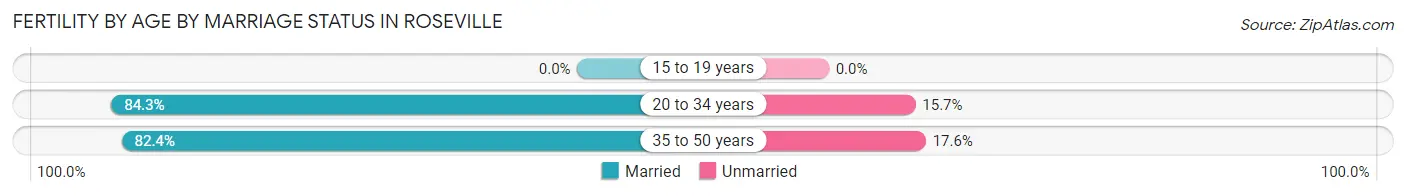
| Age Bracket | Married | Unmarried |
| 15 to 19 years | 0 (0.0%) | 0 (0.0%) |
| 20 to 34 years | 1,100 (84.3%) | 205 (15.7%) |
| 35 to 50 years | 539 (82.4%) | 115 (17.6%) |
| Total | 1,640 (83.7%) | 319 (16.3%) |
Fertility by Education in Roseville
Average fertility rate in Roseville is 56.0 births per 1,000 women. Women with the education attainment of college or associate's degree have the highest fertility rate of 70.0 births per 1,000 women, while women with the education attainment of less than high school have the lowest fertility at 13.0 births per 1,000 women. Women with the education attainment of college or associate's degree represent 40.1% of all women with births.
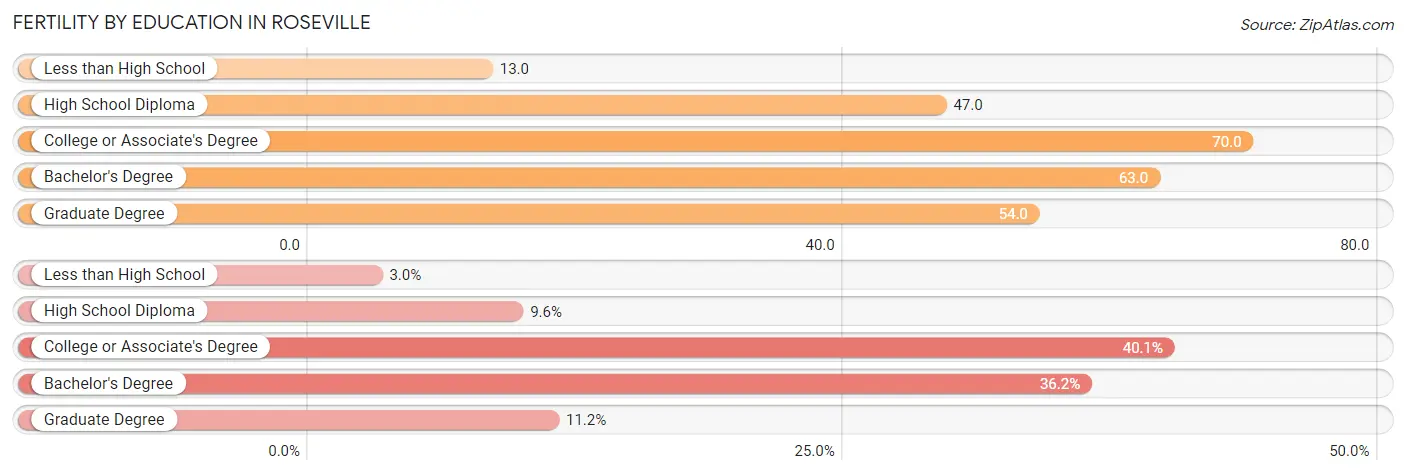
| Educational Attainment | Women with Births | Births / 1,000 Women |
| Less than High School | 58 (3.0%) | 13.0 |
| High School Diploma | 187 (9.6%) | 47.0 |
| College or Associate's Degree | 785 (40.1%) | 70.0 |
| Bachelor's Degree | 709 (36.2%) | 63.0 |
| Graduate Degree | 220 (11.2%) | 54.0 |
| Total | 1,959 (100.0%) | 56.0 |
Fertility by Education by Marriage Status in Roseville
16.3% of women with births in Roseville are unmarried. Women with the educational attainment of bachelor's degree are most likely to be married with 92.4% of them married at childbirth, while women with the educational attainment of less than high school are least likely to be married with 70.7% of them unmarried at childbirth.
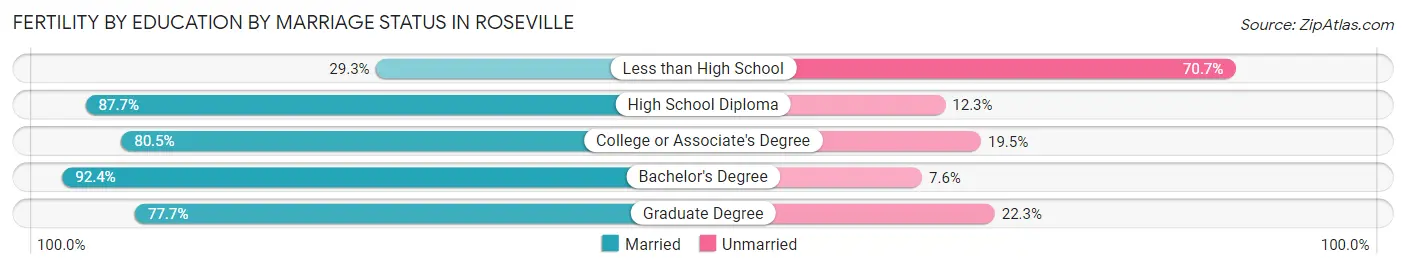
| Educational Attainment | Married | Unmarried |
| Less than High School | 17 (29.3%) | 41 (70.7%) |
| High School Diploma | 164 (87.7%) | 23 (12.3%) |
| College or Associate's Degree | 632 (80.5%) | 153 (19.5%) |
| Bachelor's Degree | 655 (92.4%) | 54 (7.6%) |
| Graduate Degree | 171 (77.7%) | 49 (22.3%) |
| Total | 1,640 (83.7%) | 319 (16.3%) |
Employment Characteristics in Roseville
Employment by Class of Employer in Roseville
Among the 72,029 employed individuals in Roseville, private company employees (45,173 | 62.7%), not-for-profit organizations (6,499 | 9.0%), and local government employees (6,358 | 8.8%) make up the most common classes of employment.
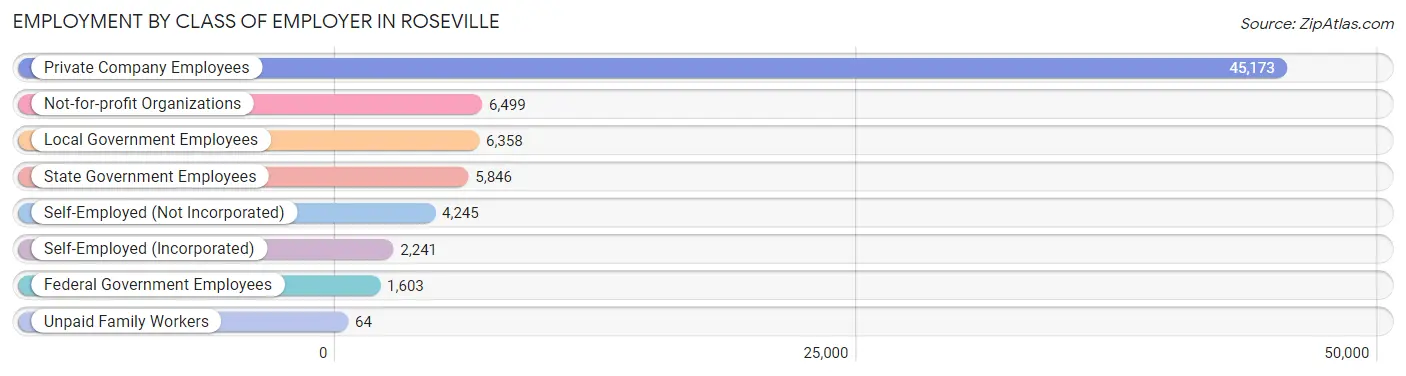
| Employer Class | # Employees | % Employees |
| Private Company Employees | 45,173 | 62.7% |
| Self-Employed (Incorporated) | 2,241 | 3.1% |
| Self-Employed (Not Incorporated) | 4,245 | 5.9% |
| Not-for-profit Organizations | 6,499 | 9.0% |
| Local Government Employees | 6,358 | 8.8% |
| State Government Employees | 5,846 | 8.1% |
| Federal Government Employees | 1,603 | 2.2% |
| Unpaid Family Workers | 64 | 0.1% |
| Total | 72,029 | 100.0% |
Employment Status by Age in Roseville
According to the labor force statistics for Roseville, out of the total population over 16 years of age (119,187), 64.8% or 77,233 individuals are in the labor force, with 4.5% or 3,475 of them unemployed. The age group with the highest labor force participation rate is 35 to 44 years, with 87.0% or 18,616 individuals in the labor force. Within the labor force, the 16 to 19 years age range has the highest percentage of unemployed individuals, with 18.5% or 570 of them being unemployed.
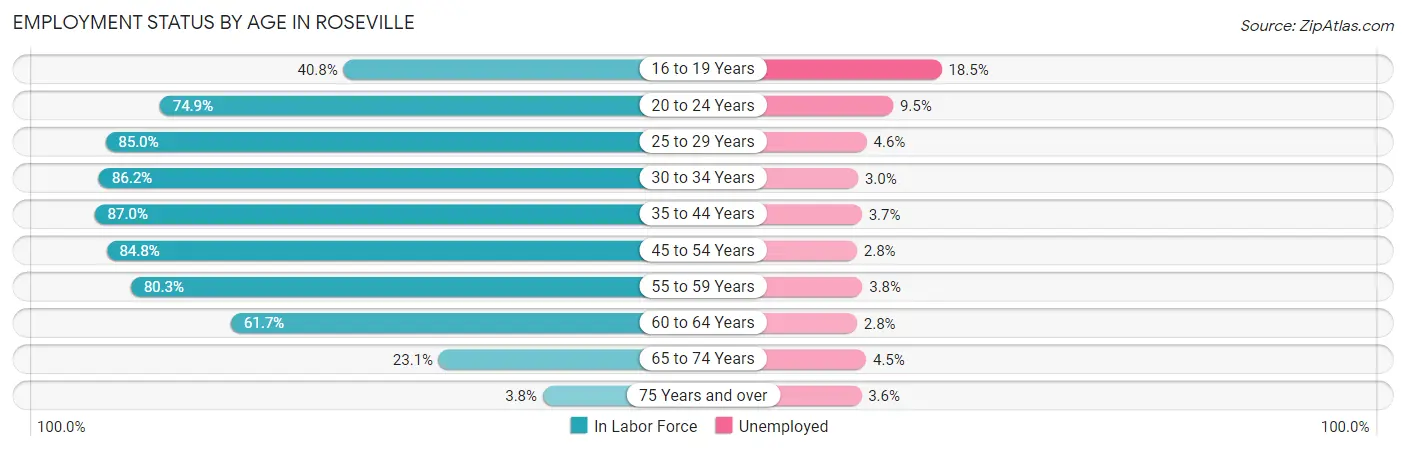
| Age Bracket | In Labor Force | Unemployed |
| 16 to 19 Years | 3,079 (40.8%) | 570 (18.5%) |
| 20 to 24 Years | 6,083 (74.9%) | 578 (9.5%) |
| 25 to 29 Years | 8,009 (85.0%) | 368 (4.6%) |
| 30 to 34 Years | 8,215 (86.2%) | 246 (3.0%) |
| 35 to 44 Years | 18,616 (87.0%) | 689 (3.7%) |
| 45 to 54 Years | 16,428 (84.8%) | 460 (2.8%) |
| 55 to 59 Years | 7,907 (80.3%) | 300 (3.8%) |
| 60 to 64 Years | 5,231 (61.7%) | 146 (2.8%) |
| 65 to 74 Years | 3,241 (23.1%) | 146 (4.5%) |
| 75 Years and over | 435 (3.8%) | 16 (3.6%) |
| Total | 77,233 (64.8%) | 3,475 (4.5%) |
Employment Status by Educational Attainment in Roseville
According to labor force statistics for Roseville, 82.5% of individuals (64,390) out of the total population between 25 and 64 years of age (78,048) are in the labor force, with 3.4% or 2,189 of them being unemployed. The group with the highest labor force participation rate are those with the educational attainment of bachelor's degree or higher, with 86.8% or 32,066 individuals in the labor force. Within the labor force, individuals with less than high school education have the highest percentage of unemployment, with 5.6% or 102 of them being unemployed.
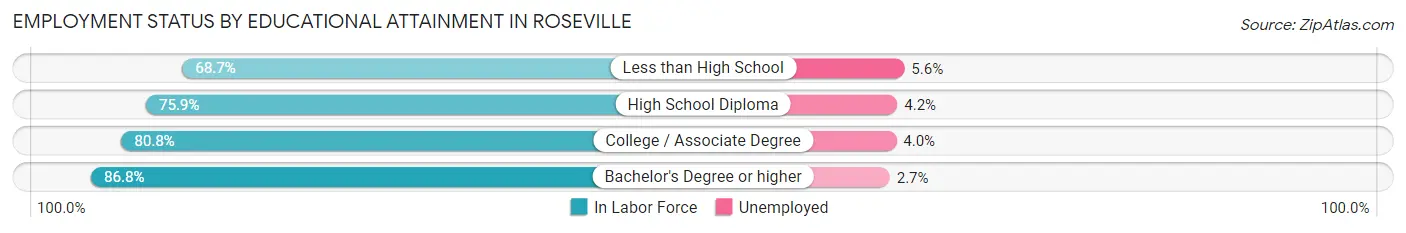
| Educational Attainment | In Labor Force | Unemployed |
| Less than High School | 1,813 (68.7%) | 148 (5.6%) |
| High School Diploma | 8,196 (75.9%) | 454 (4.2%) |
| College / Associate Degree | 22,356 (80.8%) | 1,107 (4.0%) |
| Bachelor's Degree or higher | 32,066 (86.8%) | 997 (2.7%) |
| Total | 64,390 (82.5%) | 2,654 (3.4%) |
Employment Occupations by Sex in Roseville
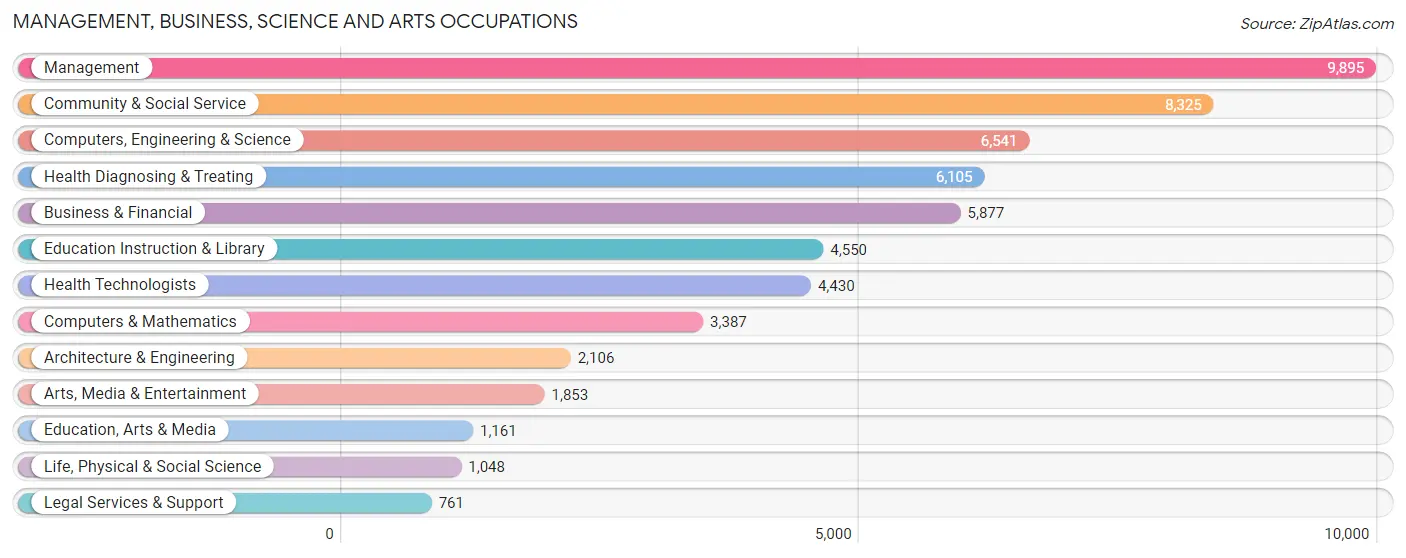
Management, Business, Science and Arts Occupations
The most common Management, Business, Science and Arts occupations in Roseville are Management (9,895 | 13.5%), Community & Social Service (8,325 | 11.3%), Computers, Engineering & Science (6,541 | 8.9%), Health Diagnosing & Treating (6,105 | 8.3%), and Business & Financial (5,877 | 8.0%).
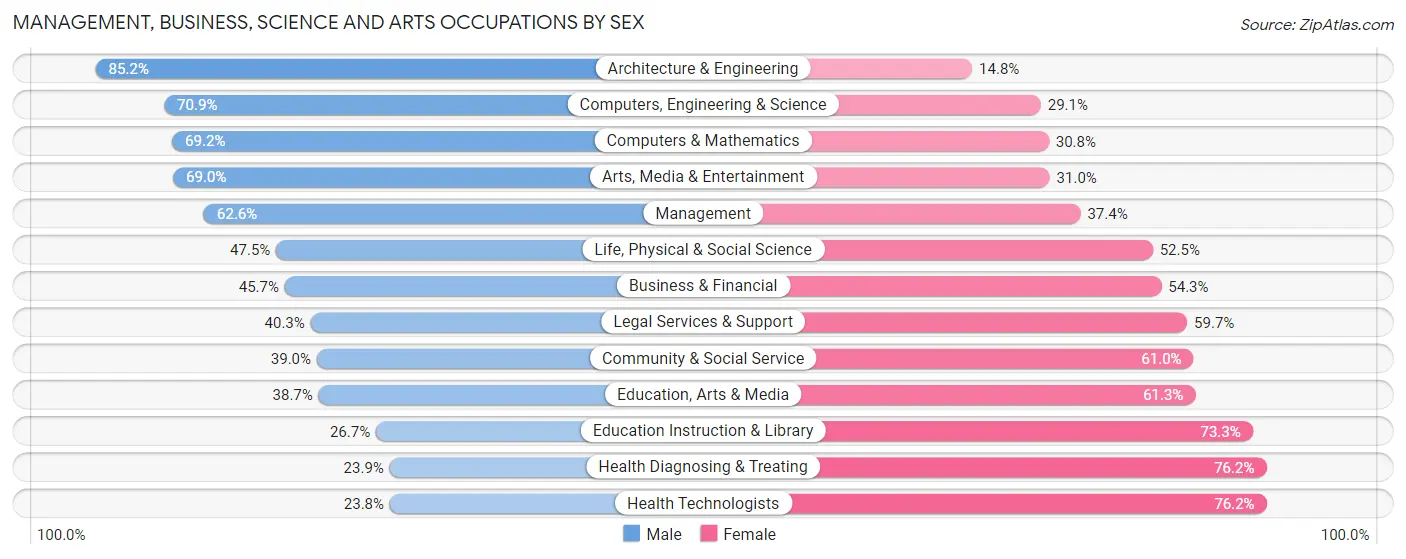
Management, Business, Science and Arts Occupations by Sex
Within the Management, Business, Science and Arts occupations in Roseville, the most male-oriented occupations are Architecture & Engineering (85.2%), Computers, Engineering & Science (70.9%), and Computers & Mathematics (69.2%), while the most female-oriented occupations are Health Technologists (76.2%), Health Diagnosing & Treating (76.1%), and Education Instruction & Library (73.3%).
| Occupation | Male | Female |
| Management | 6,193 (62.6%) | 3,702 (37.4%) |
| Business & Financial | 2,687 (45.7%) | 3,190 (54.3%) |
| Computers, Engineering & Science | 4,636 (70.9%) | 1,905 (29.1%) |
| Computers & Mathematics | 2,344 (69.2%) | 1,043 (30.8%) |
| Architecture & Engineering | 1,794 (85.2%) | 312 (14.8%) |
| Life, Physical & Social Science | 498 (47.5%) | 550 (52.5%) |
| Community & Social Service | 3,250 (39.0%) | 5,075 (61.0%) |
| Education, Arts & Media | 449 (38.7%) | 712 (61.3%) |
| Legal Services & Support | 307 (40.3%) | 454 (59.7%) |
| Education Instruction & Library | 1,215 (26.7%) | 3,335 (73.3%) |
| Arts, Media & Entertainment | 1,279 (69.0%) | 574 (31.0%) |
| Health Diagnosing & Treating | 1,456 (23.8%) | 4,649 (76.1%) |
| Health Technologists | 1,055 (23.8%) | 3,375 (76.2%) |
| Total (Category) | 18,222 (49.6%) | 18,521 (50.4%) |
| Total (Overall) | 38,206 (52.0%) | 35,297 (48.0%) |
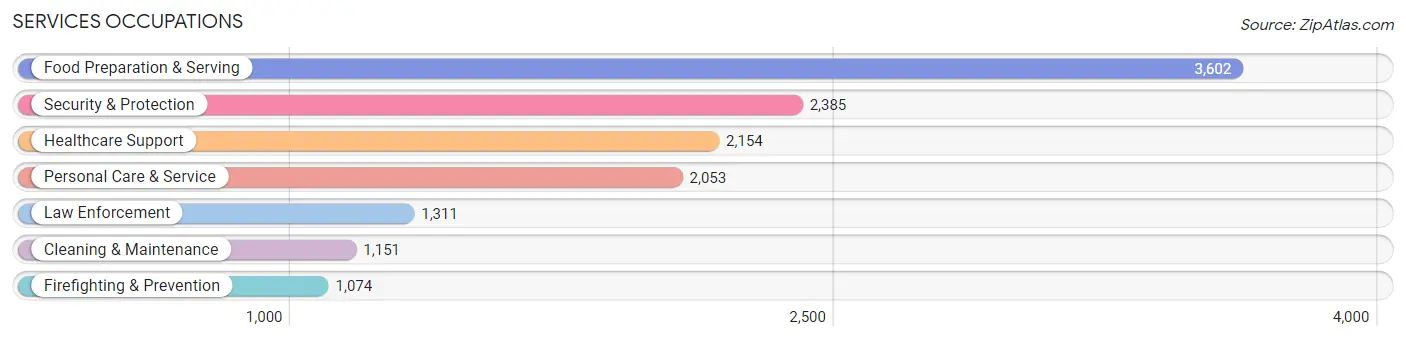
Services Occupations
The most common Services occupations in Roseville are Food Preparation & Serving (3,602 | 4.9%), Security & Protection (2,385 | 3.2%), Healthcare Support (2,154 | 2.9%), Personal Care & Service (2,053 | 2.8%), and Law Enforcement (1,311 | 1.8%).
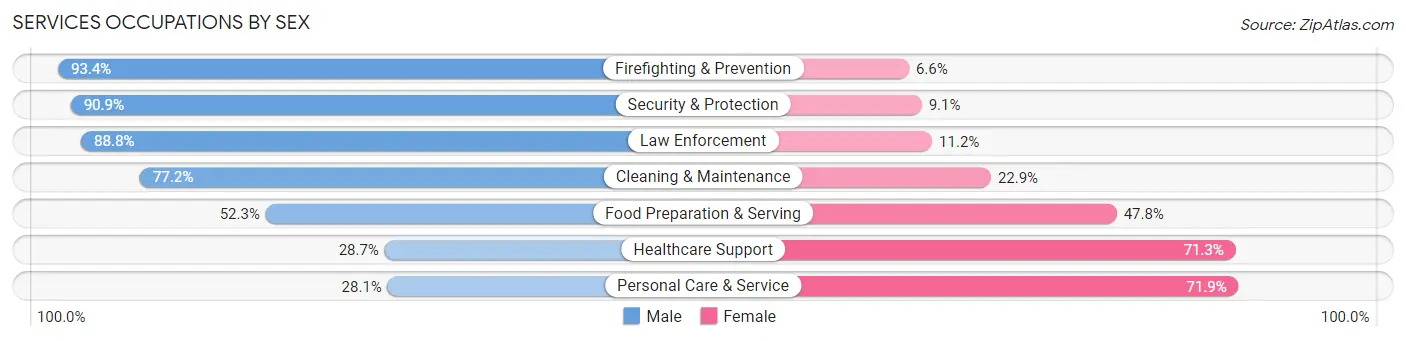
Services Occupations by Sex
Within the Services occupations in Roseville, the most male-oriented occupations are Firefighting & Prevention (93.4%), Security & Protection (90.9%), and Law Enforcement (88.8%), while the most female-oriented occupations are Personal Care & Service (71.9%), Healthcare Support (71.3%), and Food Preparation & Serving (47.7%).
| Occupation | Male | Female |
| Healthcare Support | 618 (28.7%) | 1,536 (71.3%) |
| Security & Protection | 2,167 (90.9%) | 218 (9.1%) |
| Firefighting & Prevention | 1,003 (93.4%) | 71 (6.6%) |
| Law Enforcement | 1,164 (88.8%) | 147 (11.2%) |
| Food Preparation & Serving | 1,882 (52.2%) | 1,720 (47.7%) |
| Cleaning & Maintenance | 888 (77.1%) | 263 (22.9%) |
| Personal Care & Service | 577 (28.1%) | 1,476 (71.9%) |
| Total (Category) | 6,132 (54.0%) | 5,213 (46.0%) |
| Total (Overall) | 38,206 (52.0%) | 35,297 (48.0%) |
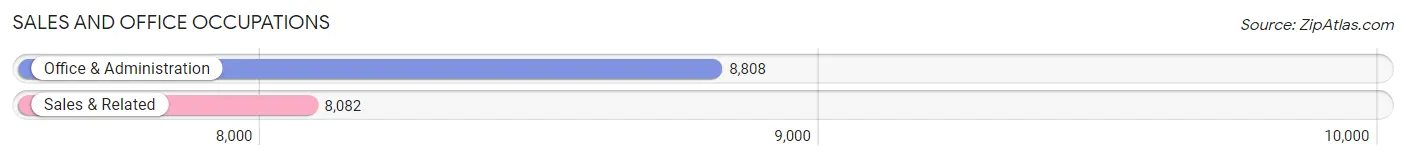
Sales and Office Occupations
The most common Sales and Office occupations in Roseville are Office & Administration (8,808 | 12.0%), and Sales & Related (8,082 | 11.0%).
Sales and Office Occupations by Sex
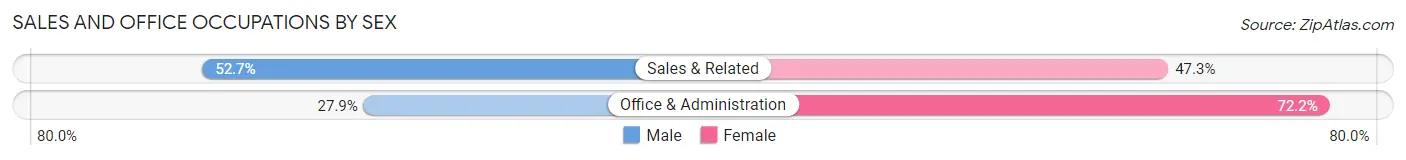
| Occupation | Male | Female |
| Sales & Related | 4,256 (52.7%) | 3,826 (47.3%) |
| Office & Administration | 2,453 (27.9%) | 6,355 (72.2%) |
| Total (Category) | 6,709 (39.7%) | 10,181 (60.3%) |
| Total (Overall) | 38,206 (52.0%) | 35,297 (48.0%) |
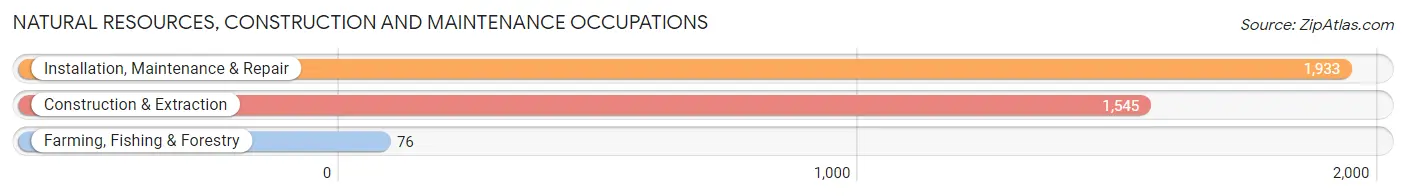
Natural Resources, Construction and Maintenance Occupations
The most common Natural Resources, Construction and Maintenance occupations in Roseville are Installation, Maintenance & Repair (1,933 | 2.6%), Construction & Extraction (1,545 | 2.1%), and Farming, Fishing & Forestry (76 | 0.1%).
Natural Resources, Construction and Maintenance Occupations by Sex
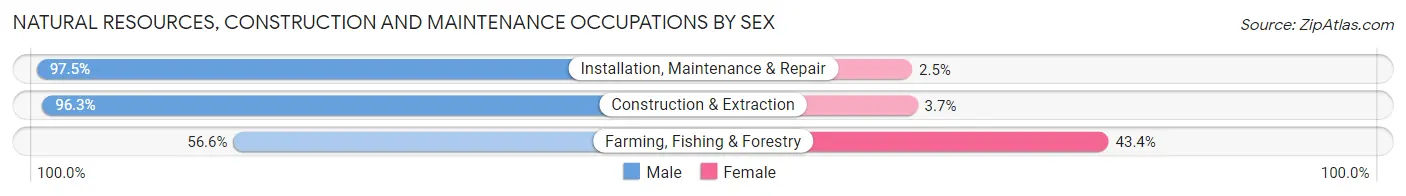
| Occupation | Male | Female |
| Farming, Fishing & Forestry | 43 (56.6%) | 33 (43.4%) |
| Construction & Extraction | 1,488 (96.3%) | 57 (3.7%) |
| Installation, Maintenance & Repair | 1,884 (97.5%) | 49 (2.5%) |
| Total (Category) | 3,415 (96.1%) | 139 (3.9%) |
| Total (Overall) | 38,206 (52.0%) | 35,297 (48.0%) |
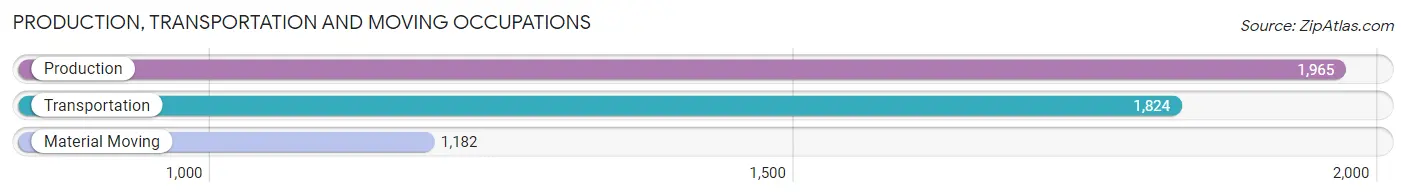
Production, Transportation and Moving Occupations
The most common Production, Transportation and Moving occupations in Roseville are Production (1,965 | 2.7%), Transportation (1,824 | 2.5%), and Material Moving (1,182 | 1.6%).
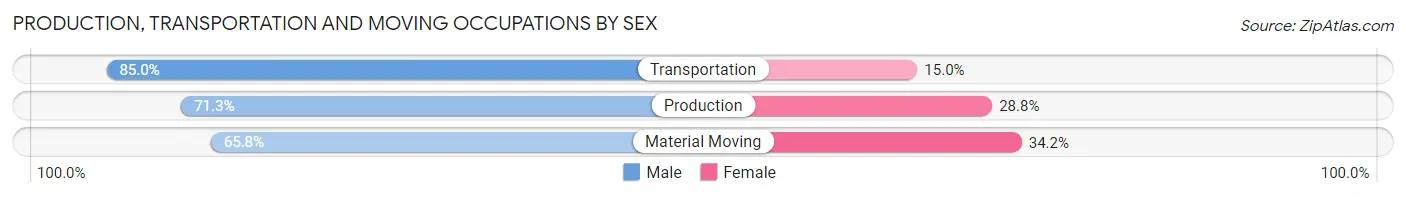
Production, Transportation and Moving Occupations by Sex
| Occupation | Male | Female |
| Production | 1,400 (71.3%) | 565 (28.7%) |
| Transportation | 1,550 (85.0%) | 274 (15.0%) |
| Material Moving | 778 (65.8%) | 404 (34.2%) |
| Total (Category) | 3,728 (75.0%) | 1,243 (25.0%) |
| Total (Overall) | 38,206 (52.0%) | 35,297 (48.0%) |
Employment Industries by Sex in Roseville
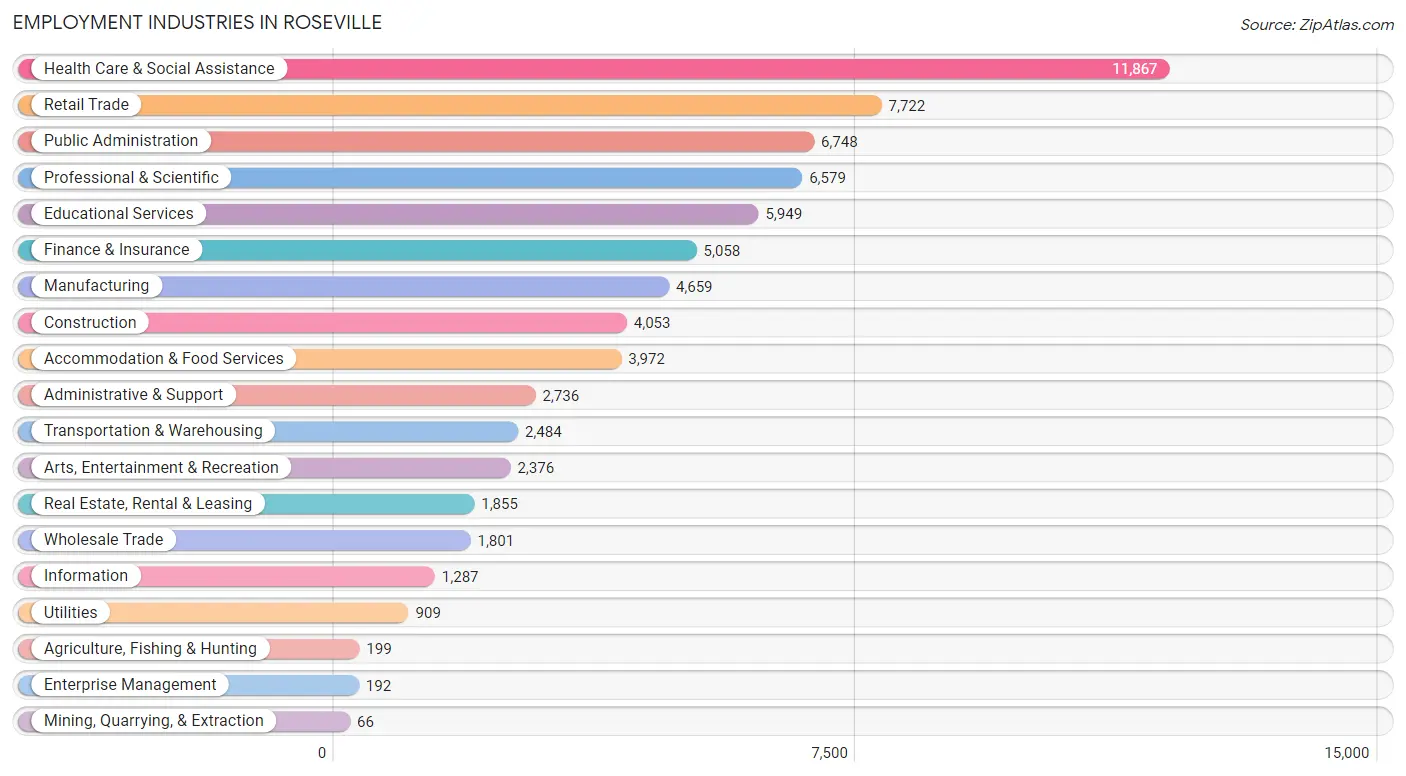
Employment Industries in Roseville
The major employment industries in Roseville include Health Care & Social Assistance (11,867 | 16.1%), Retail Trade (7,722 | 10.5%), Public Administration (6,748 | 9.2%), Professional & Scientific (6,579 | 8.9%), and Educational Services (5,949 | 8.1%).
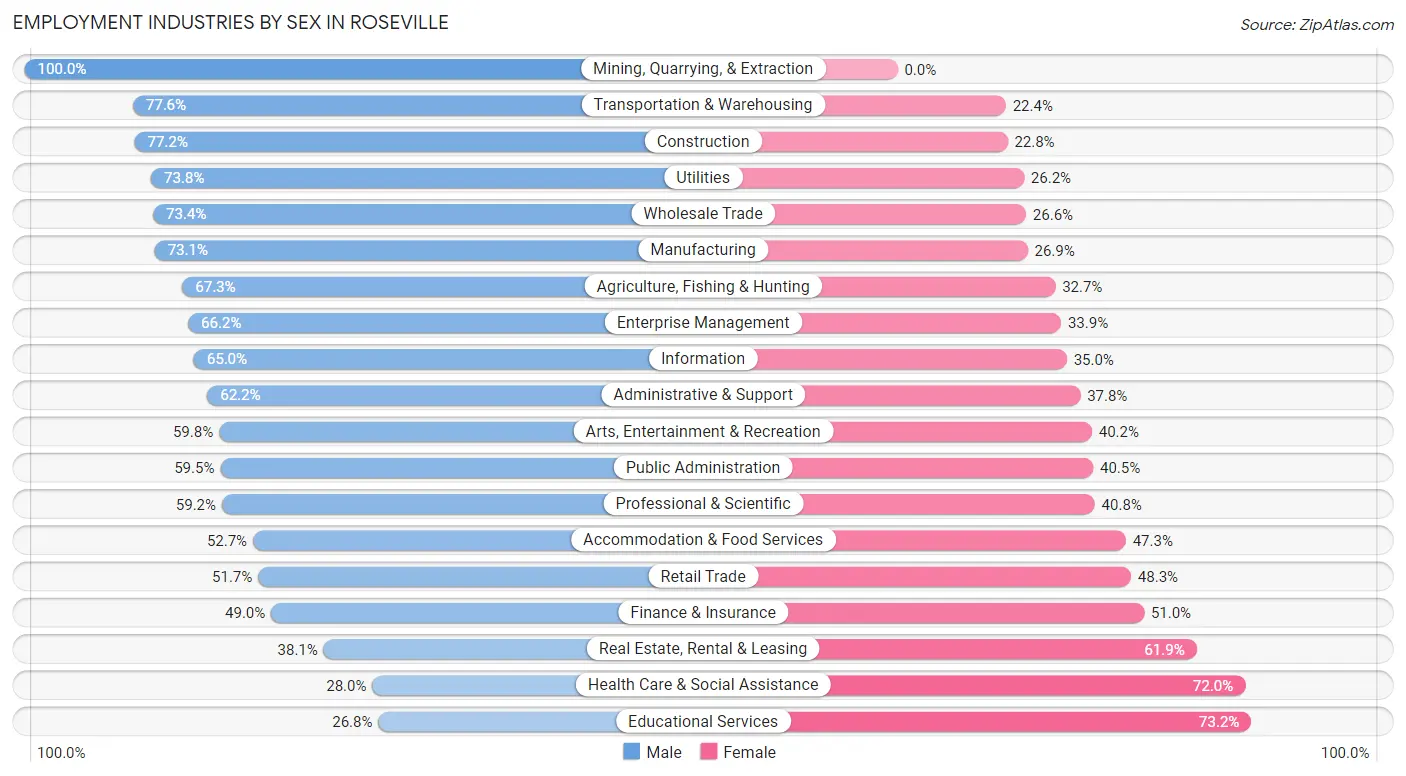
Employment Industries by Sex in Roseville
The Roseville industries that see more men than women are Mining, Quarrying, & Extraction (100.0%), Transportation & Warehousing (77.6%), and Construction (77.2%), whereas the industries that tend to have a higher number of women are Educational Services (73.2%), Health Care & Social Assistance (72.0%), and Real Estate, Rental & Leasing (61.9%).
| Industry | Male | Female |
| Agriculture, Fishing & Hunting | 134 (67.3%) | 65 (32.7%) |
| Mining, Quarrying, & Extraction | 66 (100.0%) | 0 (0.0%) |
| Construction | 3,130 (77.2%) | 923 (22.8%) |
| Manufacturing | 3,404 (73.1%) | 1,255 (26.9%) |
| Wholesale Trade | 1,322 (73.4%) | 479 (26.6%) |
| Retail Trade | 3,990 (51.7%) | 3,732 (48.3%) |
| Transportation & Warehousing | 1,927 (77.6%) | 557 (22.4%) |
| Utilities | 671 (73.8%) | 238 (26.2%) |
| Information | 836 (65.0%) | 451 (35.0%) |
| Finance & Insurance | 2,477 (49.0%) | 2,581 (51.0%) |
| Real Estate, Rental & Leasing | 707 (38.1%) | 1,148 (61.9%) |
| Professional & Scientific | 3,893 (59.2%) | 2,686 (40.8%) |
| Enterprise Management | 127 (66.1%) | 65 (33.9%) |
| Administrative & Support | 1,701 (62.2%) | 1,035 (37.8%) |
| Educational Services | 1,594 (26.8%) | 4,355 (73.2%) |
| Health Care & Social Assistance | 3,328 (28.0%) | 8,539 (72.0%) |
| Arts, Entertainment & Recreation | 1,420 (59.8%) | 956 (40.2%) |
| Accommodation & Food Services | 2,095 (52.7%) | 1,877 (47.3%) |
| Public Administration | 4,016 (59.5%) | 2,732 (40.5%) |
| Total | 38,206 (52.0%) | 35,297 (48.0%) |
Education in Roseville
School Enrollment in Roseville
The most common levels of schooling among the 36,129 students in Roseville are high school (8,280 | 22.9%), middle school (7,839 | 21.7%), and college / undergraduate (7,550 | 20.9%).
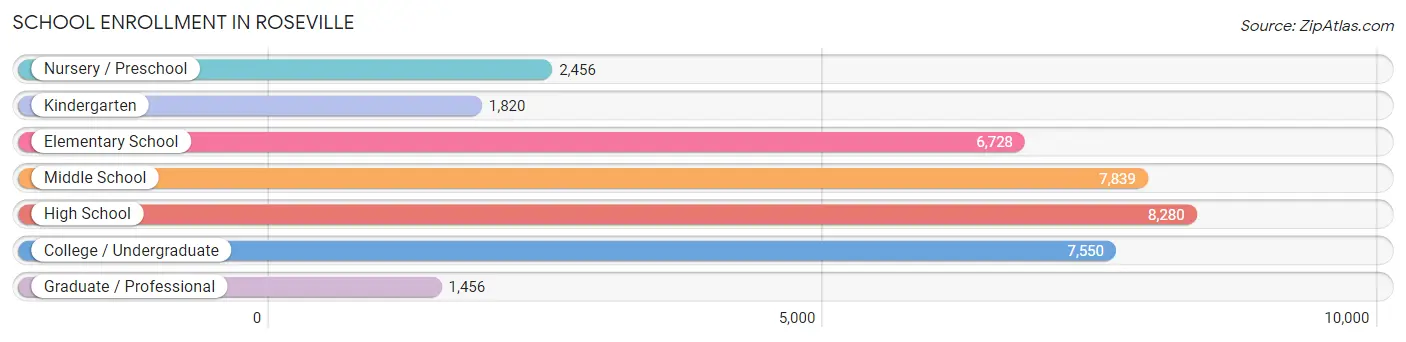
| School Level | # Students | % Students |
| Nursery / Preschool | 2,456 | 6.8% |
| Kindergarten | 1,820 | 5.0% |
| Elementary School | 6,728 | 18.6% |
| Middle School | 7,839 | 21.7% |
| High School | 8,280 | 22.9% |
| College / Undergraduate | 7,550 | 20.9% |
| Graduate / Professional | 1,456 | 4.0% |
| Total | 36,129 | 100.0% |
School Enrollment by Age by Funding Source in Roseville
Out of a total of 36,129 students who are enrolled in schools in Roseville, 4,372 (12.1%) attend a private institution, while the remaining 31,757 (87.9%) are enrolled in public schools. The age group of 3 to 4 year olds has the highest likelihood of being enrolled in private schools, with 909 (48.5% in the age bracket) enrolled. Conversely, the age group of 10 to 14 year olds has the lowest likelihood of being enrolled in a private school, with 9,652 (95.4% in the age bracket) attending a public institution.
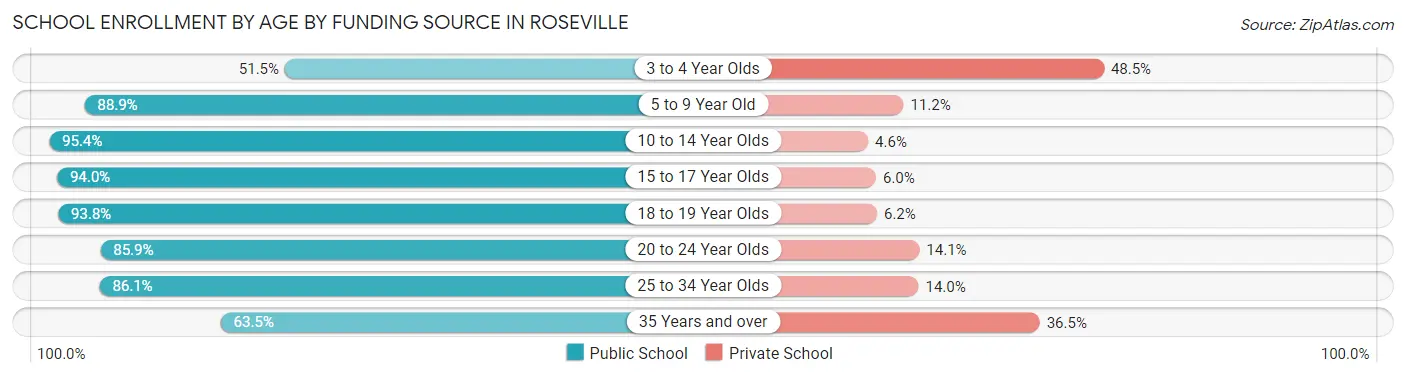
| Age Bracket | Public School | Private School |
| 3 to 4 Year Olds | 966 (51.5%) | 909 (48.5%) |
| 5 to 9 Year Old | 7,231 (88.8%) | 907 (11.2%) |
| 10 to 14 Year Olds | 9,652 (95.4%) | 461 (4.6%) |
| 15 to 17 Year Olds | 5,591 (94.0%) | 359 (6.0%) |
| 18 to 19 Year Olds | 2,129 (93.8%) | 141 (6.2%) |
| 20 to 24 Year Olds | 2,819 (85.9%) | 463 (14.1%) |
| 25 to 34 Year Olds | 1,962 (86.1%) | 318 (14.0%) |
| 35 Years and over | 1,410 (63.5%) | 811 (36.5%) |
| Total | 31,757 (87.9%) | 4,372 (12.1%) |
Educational Attainment by Field of Study in Roseville
Business (9,708 | 20.0%), science & technology (5,346 | 11.0%), social sciences (4,345 | 8.9%), engineering (4,043 | 8.3%), and arts & humanities (3,826 | 7.9%) are the most common fields of study among 48,609 individuals in Roseville who have obtained a bachelor's degree or higher.
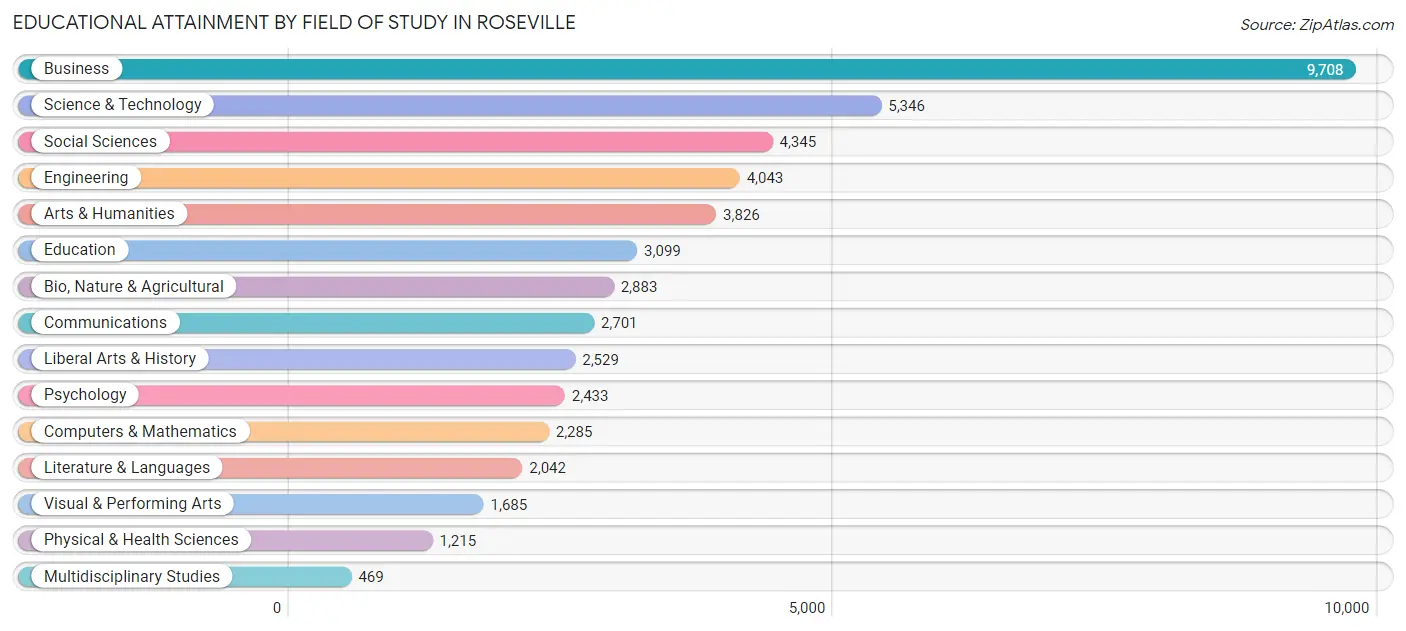
| Field of Study | # Graduates | % Graduates |
| Computers & Mathematics | 2,285 | 4.7% |
| Bio, Nature & Agricultural | 2,883 | 5.9% |
| Physical & Health Sciences | 1,215 | 2.5% |
| Psychology | 2,433 | 5.0% |
| Social Sciences | 4,345 | 8.9% |
| Engineering | 4,043 | 8.3% |
| Multidisciplinary Studies | 469 | 1.0% |
| Science & Technology | 5,346 | 11.0% |
| Business | 9,708 | 20.0% |
| Education | 3,099 | 6.4% |
| Literature & Languages | 2,042 | 4.2% |
| Liberal Arts & History | 2,529 | 5.2% |
| Visual & Performing Arts | 1,685 | 3.5% |
| Communications | 2,701 | 5.6% |
| Arts & Humanities | 3,826 | 7.9% |
| Total | 48,609 | 100.0% |
Transportation & Commute in Roseville
Vehicle Availability by Sex in Roseville
The most prevalent vehicle ownership categories in Roseville are males with 2 vehicles (16,965, accounting for 45.0%) and females with 2 vehicles (15,167, making up 49.6%).
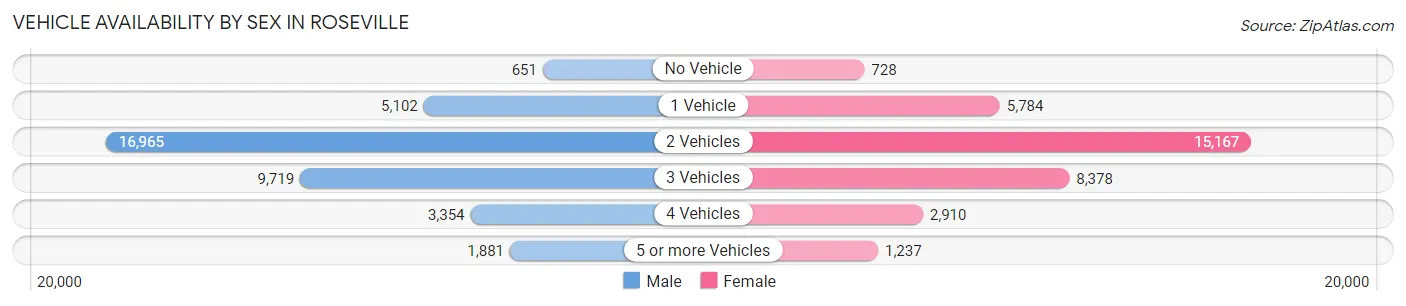
| Vehicles Available | Male | Female |
| No Vehicle | 651 (1.7%) | 728 (2.1%) |
| 1 Vehicle | 5,102 (13.5%) | 5,784 (16.9%) |
| 2 Vehicles | 16,965 (45.0%) | 15,167 (44.3%) |
| 3 Vehicles | 9,719 (25.8%) | 8,378 (24.5%) |
| 4 Vehicles | 3,354 (8.9%) | 2,910 (8.5%) |
| 5 or more Vehicles | 1,881 (5.0%) | 1,237 (3.6%) |
| Total | 37,672 (100.0%) | 34,204 (100.0%) |
Commute Time in Roseville
The most frequently occuring commute durations in Roseville are 15 to 19 minutes (9,512 commuters, 16.3%), 30 to 34 minutes (8,270 commuters, 14.2%), and 10 to 14 minutes (8,031 commuters, 13.8%).
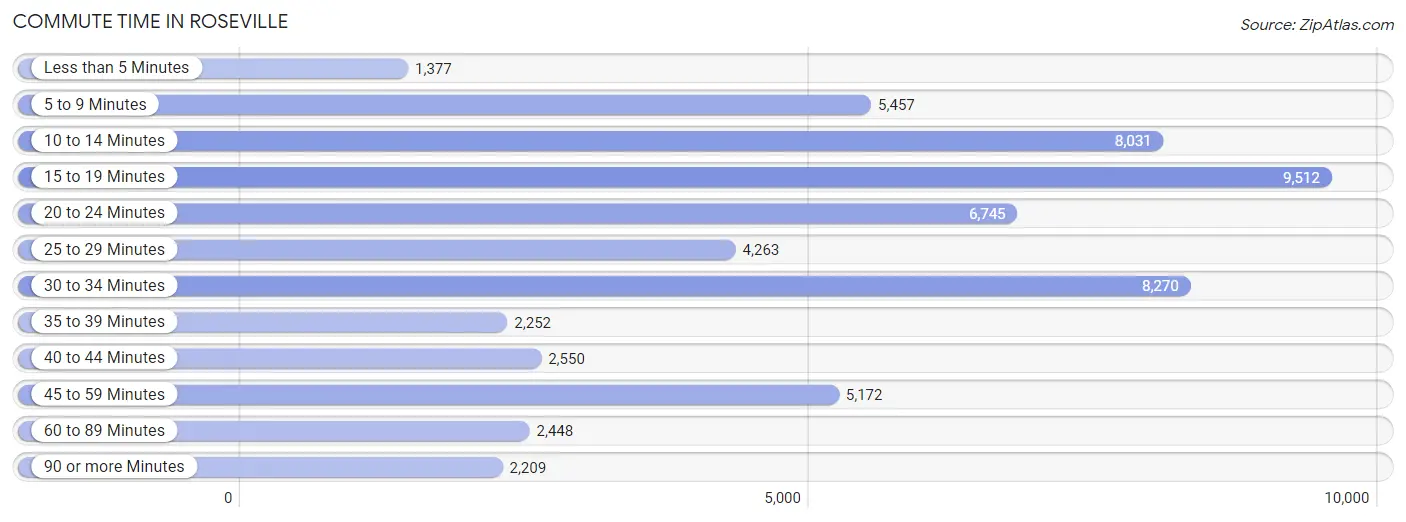
| Commute Time | # Commuters | % Commuters |
| Less than 5 Minutes | 1,377 | 2.4% |
| 5 to 9 Minutes | 5,457 | 9.4% |
| 10 to 14 Minutes | 8,031 | 13.8% |
| 15 to 19 Minutes | 9,512 | 16.3% |
| 20 to 24 Minutes | 6,745 | 11.6% |
| 25 to 29 Minutes | 4,263 | 7.3% |
| 30 to 34 Minutes | 8,270 | 14.2% |
| 35 to 39 Minutes | 2,252 | 3.9% |
| 40 to 44 Minutes | 2,550 | 4.4% |
| 45 to 59 Minutes | 5,172 | 8.9% |
| 60 to 89 Minutes | 2,448 | 4.2% |
| 90 or more Minutes | 2,209 | 3.8% |
Commute Time by Sex in Roseville
The most common commute times in Roseville are 15 to 19 minutes (5,064 commuters, 16.6%) for males and 15 to 19 minutes (4,448 commuters, 16.0%) for females.
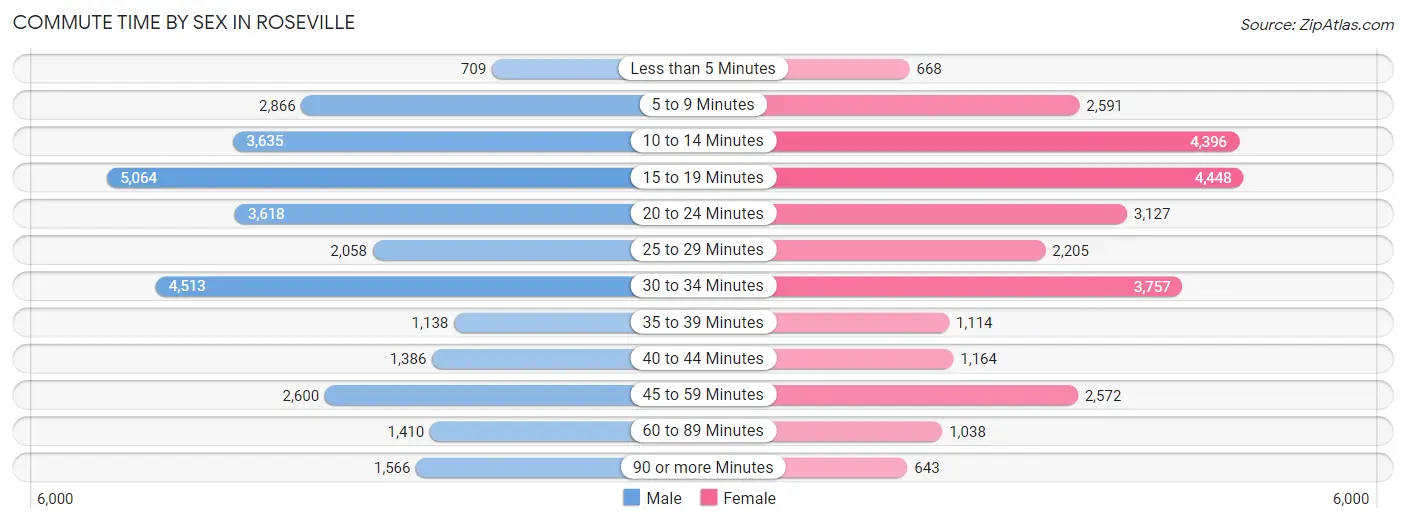
| Commute Time | Male | Female |
| Less than 5 Minutes | 709 (2.3%) | 668 (2.4%) |
| 5 to 9 Minutes | 2,866 (9.4%) | 2,591 (9.3%) |
| 10 to 14 Minutes | 3,635 (11.9%) | 4,396 (15.9%) |
| 15 to 19 Minutes | 5,064 (16.6%) | 4,448 (16.0%) |
| 20 to 24 Minutes | 3,618 (11.8%) | 3,127 (11.3%) |
| 25 to 29 Minutes | 2,058 (6.7%) | 2,205 (8.0%) |
| 30 to 34 Minutes | 4,513 (14.8%) | 3,757 (13.6%) |
| 35 to 39 Minutes | 1,138 (3.7%) | 1,114 (4.0%) |
| 40 to 44 Minutes | 1,386 (4.5%) | 1,164 (4.2%) |
| 45 to 59 Minutes | 2,600 (8.5%) | 2,572 (9.3%) |
| 60 to 89 Minutes | 1,410 (4.6%) | 1,038 (3.7%) |
| 90 or more Minutes | 1,566 (5.1%) | 643 (2.3%) |
Time of Departure to Work by Sex in Roseville
The most frequent times of departure to work in Roseville are 7:00 AM to 7:29 AM (4,417, 14.4%) for males and 7:00 AM to 7:29 AM (4,394, 15.9%) for females.
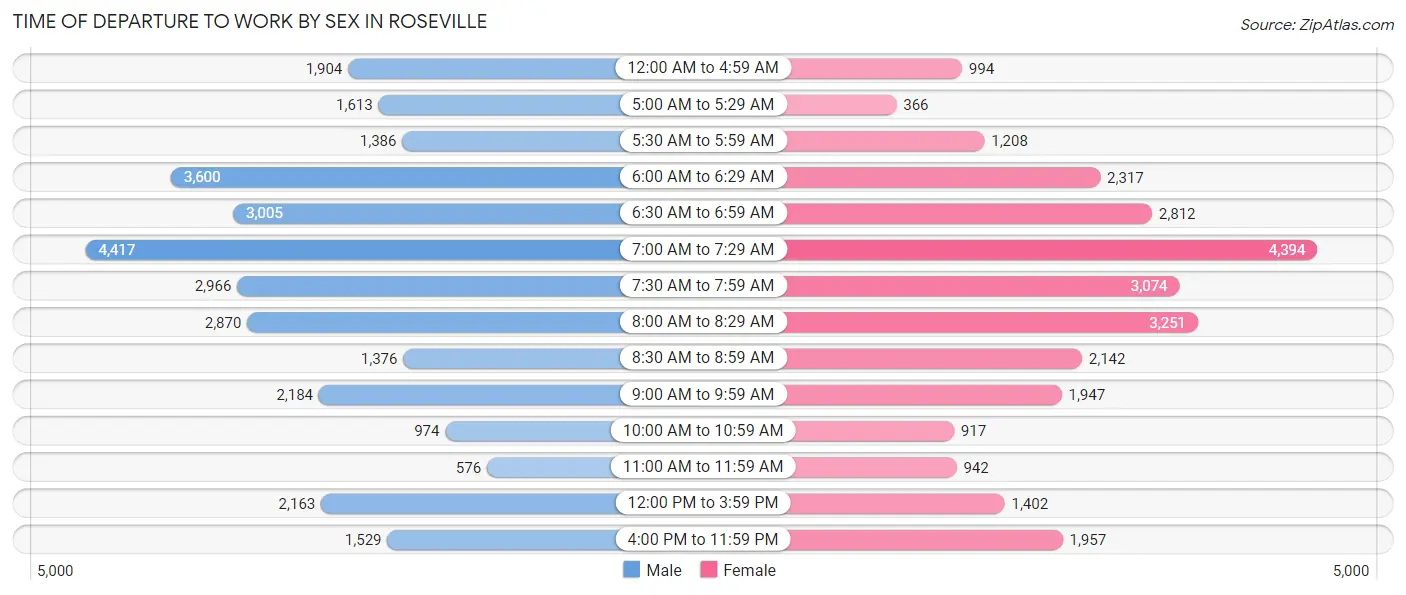
| Time of Departure | Male | Female |
| 12:00 AM to 4:59 AM | 1,904 (6.2%) | 994 (3.6%) |
| 5:00 AM to 5:29 AM | 1,613 (5.3%) | 366 (1.3%) |
| 5:30 AM to 5:59 AM | 1,386 (4.5%) | 1,208 (4.4%) |
| 6:00 AM to 6:29 AM | 3,600 (11.8%) | 2,317 (8.4%) |
| 6:30 AM to 6:59 AM | 3,005 (9.8%) | 2,812 (10.1%) |
| 7:00 AM to 7:29 AM | 4,417 (14.4%) | 4,394 (15.9%) |
| 7:30 AM to 7:59 AM | 2,966 (9.7%) | 3,074 (11.1%) |
| 8:00 AM to 8:29 AM | 2,870 (9.4%) | 3,251 (11.7%) |
| 8:30 AM to 8:59 AM | 1,376 (4.5%) | 2,142 (7.7%) |
| 9:00 AM to 9:59 AM | 2,184 (7.1%) | 1,947 (7.0%) |
| 10:00 AM to 10:59 AM | 974 (3.2%) | 917 (3.3%) |
| 11:00 AM to 11:59 AM | 576 (1.9%) | 942 (3.4%) |
| 12:00 PM to 3:59 PM | 2,163 (7.1%) | 1,402 (5.1%) |
| 4:00 PM to 11:59 PM | 1,529 (5.0%) | 1,957 (7.1%) |
| Total | 30,563 (100.0%) | 27,723 (100.0%) |
Housing Occupancy in Roseville
Occupancy by Ownership in Roseville
Of the total 56,133 dwellings in Roseville, owner-occupied units account for 38,247 (68.1%), while renter-occupied units make up 17,886 (31.9%).
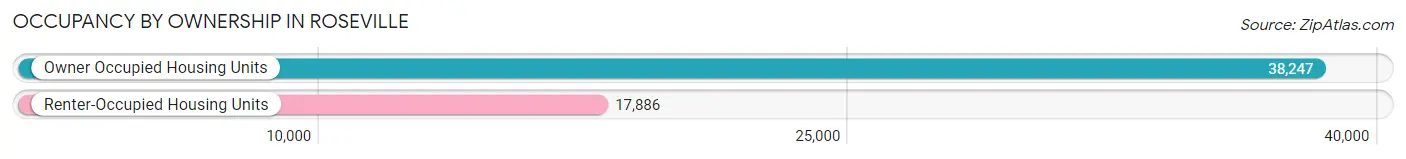
| Occupancy | # Housing Units | % Housing Units |
| Owner Occupied Housing Units | 38,247 | 68.1% |
| Renter-Occupied Housing Units | 17,886 | 31.9% |
| Total Occupied Housing Units | 56,133 | 100.0% |
Occupancy by Household Size in Roseville
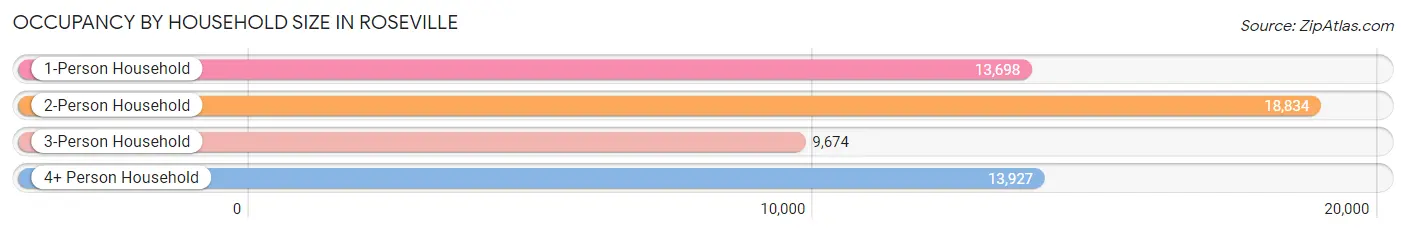
| Household Size | # Housing Units | % Housing Units |
| 1-Person Household | 13,698 | 24.4% |
| 2-Person Household | 18,834 | 33.6% |
| 3-Person Household | 9,674 | 17.2% |
| 4+ Person Household | 13,927 | 24.8% |
| Total Housing Units | 56,133 | 100.0% |
Occupancy by Ownership by Household Size in Roseville
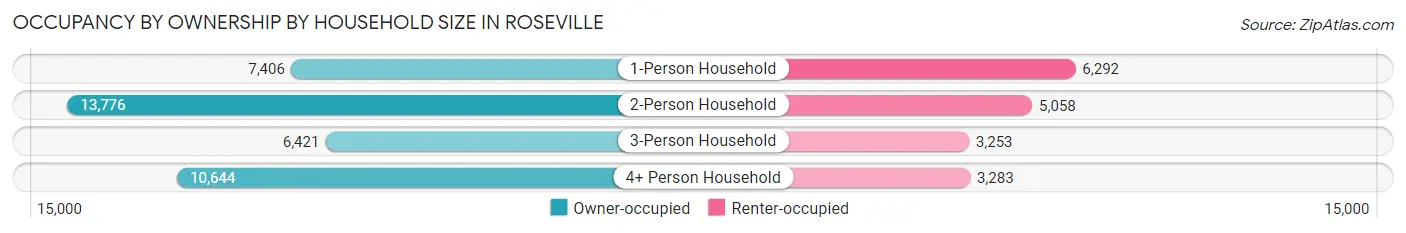
| Household Size | Owner-occupied | Renter-occupied |
| 1-Person Household | 7,406 (54.1%) | 6,292 (45.9%) |
| 2-Person Household | 13,776 (73.1%) | 5,058 (26.9%) |
| 3-Person Household | 6,421 (66.4%) | 3,253 (33.6%) |
| 4+ Person Household | 10,644 (76.4%) | 3,283 (23.6%) |
| Total Housing Units | 38,247 (68.1%) | 17,886 (31.9%) |
Occupancy by Educational Attainment in Roseville
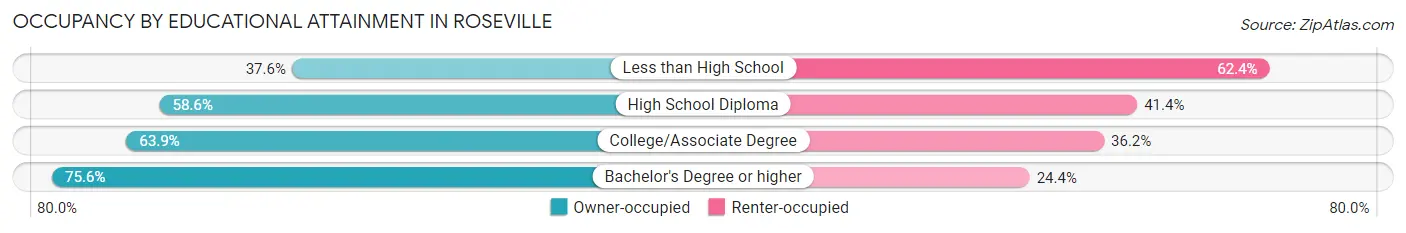
| Household Size | Owner-occupied | Renter-occupied |
| Less than High School | 657 (37.6%) | 1,089 (62.4%) |
| High School Diploma | 4,057 (58.6%) | 2,867 (41.4%) |
| College/Associate Degree | 12,822 (63.8%) | 7,259 (36.1%) |
| Bachelor's Degree or higher | 20,711 (75.6%) | 6,671 (24.4%) |
Occupancy by Age of Householder in Roseville
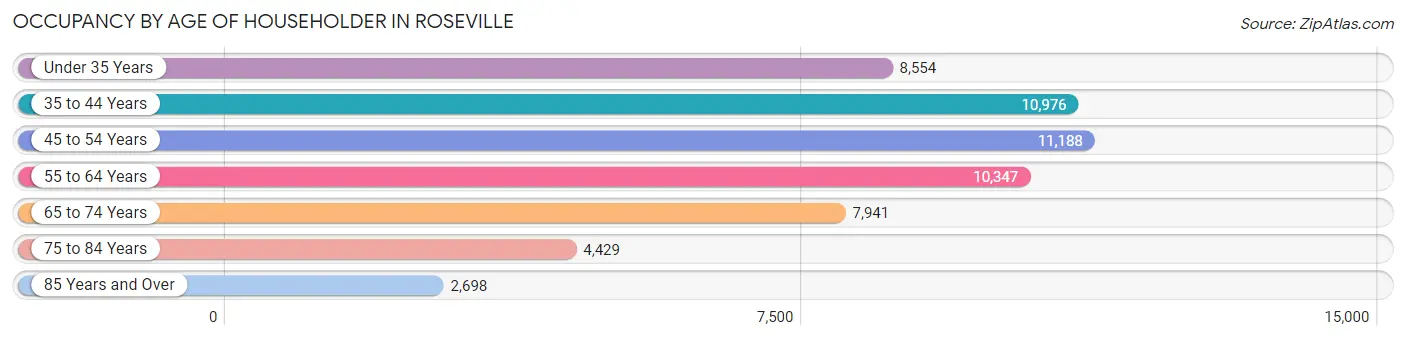
| Age Bracket | # Households | % Households |
| Under 35 Years | 8,554 | 15.2% |
| 35 to 44 Years | 10,976 | 19.6% |
| 45 to 54 Years | 11,188 | 19.9% |
| 55 to 64 Years | 10,347 | 18.4% |
| 65 to 74 Years | 7,941 | 14.1% |
| 75 to 84 Years | 4,429 | 7.9% |
| 85 Years and Over | 2,698 | 4.8% |
| Total | 56,133 | 100.0% |
Housing Finances in Roseville
Median Income by Occupancy in Roseville
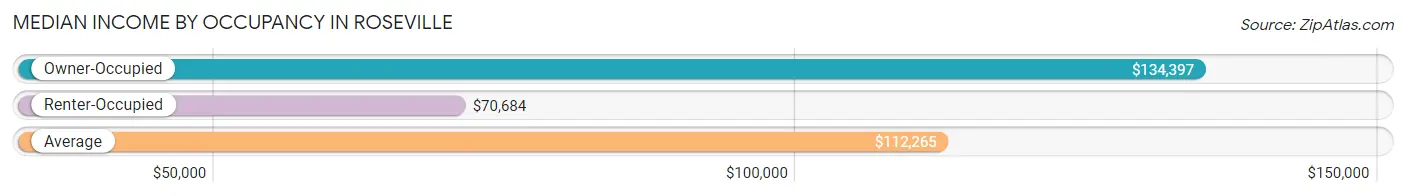
| Occupancy Type | # Households | Median Income |
| Owner-Occupied | 38,247 (68.1%) | $134,397 |
| Renter-Occupied | 17,886 (31.9%) | $70,684 |
| Average | 56,133 (100.0%) | $112,265 |
Occupancy by Householder Income Bracket in Roseville
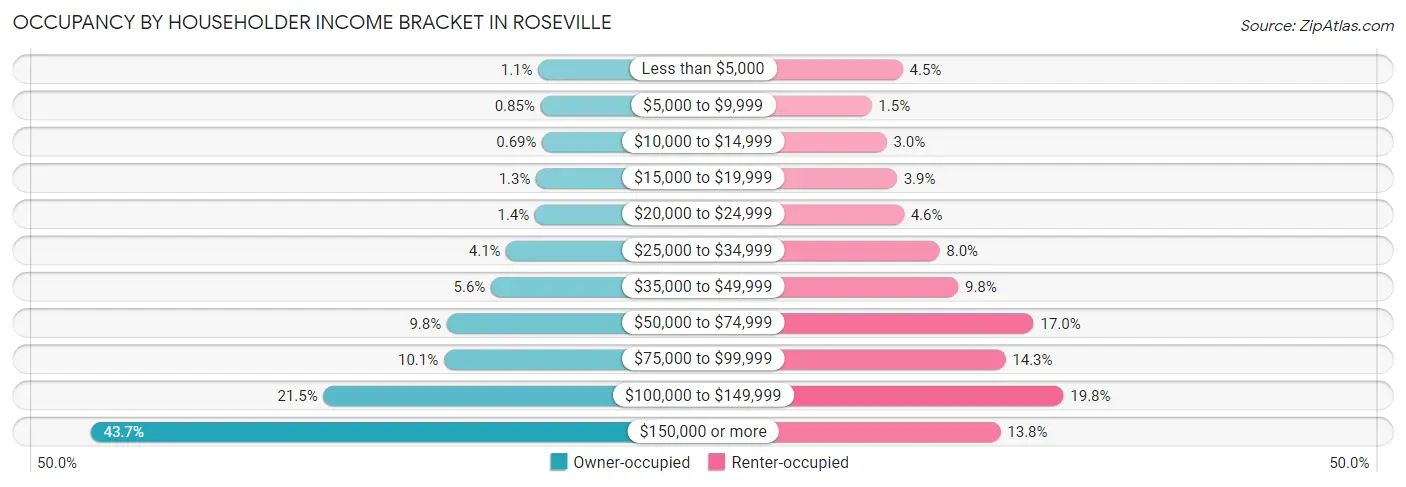
| Income Bracket | Owner-occupied | Renter-occupied |
| Less than $5,000 | 408 (1.1%) | 802 (4.5%) |
| $5,000 to $9,999 | 327 (0.9%) | 270 (1.5%) |
| $10,000 to $14,999 | 265 (0.7%) | 528 (2.9%) |
| $15,000 to $19,999 | 484 (1.3%) | 702 (3.9%) |
| $20,000 to $24,999 | 529 (1.4%) | 821 (4.6%) |
| $25,000 to $34,999 | 1,572 (4.1%) | 1,428 (8.0%) |
| $35,000 to $49,999 | 2,125 (5.6%) | 1,746 (9.8%) |
| $50,000 to $74,999 | 3,736 (9.8%) | 3,031 (17.0%) |
| $75,000 to $99,999 | 3,843 (10.1%) | 2,553 (14.3%) |
| $100,000 to $149,999 | 8,236 (21.5%) | 3,539 (19.8%) |
| $150,000 or more | 16,722 (43.7%) | 2,466 (13.8%) |
| Total | 38,247 (100.0%) | 17,886 (100.0%) |
Monthly Housing Cost Tiers in Roseville
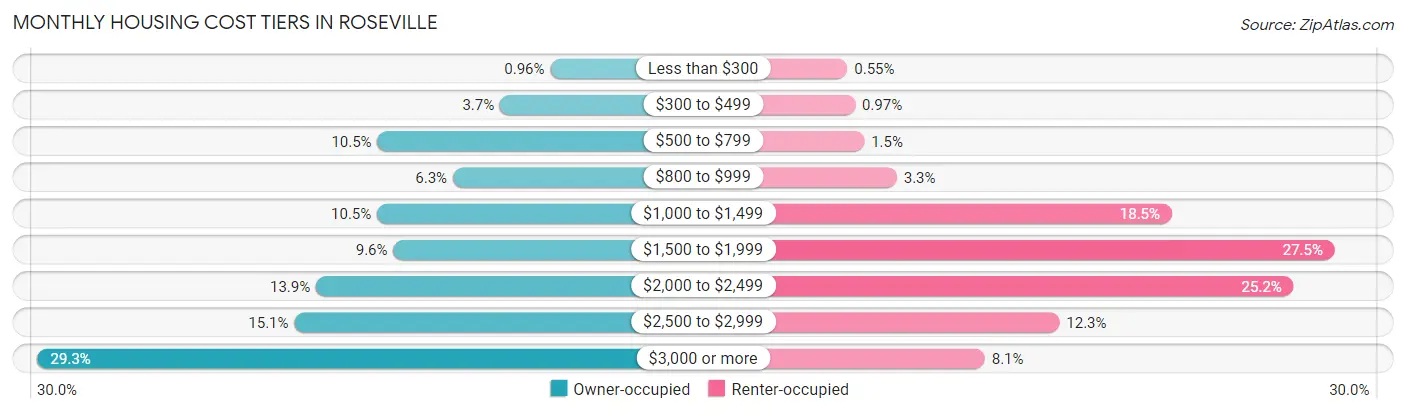
| Monthly Cost | Owner-occupied | Renter-occupied |
| Less than $300 | 367 (1.0%) | 99 (0.5%) |
| $300 to $499 | 1,429 (3.7%) | 173 (1.0%) |
| $500 to $799 | 4,020 (10.5%) | 265 (1.5%) |
| $800 to $999 | 2,423 (6.3%) | 586 (3.3%) |
| $1,000 to $1,499 | 4,028 (10.5%) | 3,303 (18.5%) |
| $1,500 to $1,999 | 3,684 (9.6%) | 4,913 (27.5%) |
| $2,000 to $2,499 | 5,317 (13.9%) | 4,508 (25.2%) |
| $2,500 to $2,999 | 5,776 (15.1%) | 2,193 (12.3%) |
| $3,000 or more | 11,203 (29.3%) | 1,456 (8.1%) |
| Total | 38,247 (100.0%) | 17,886 (100.0%) |
Physical Housing Characteristics in Roseville
Housing Structures in Roseville
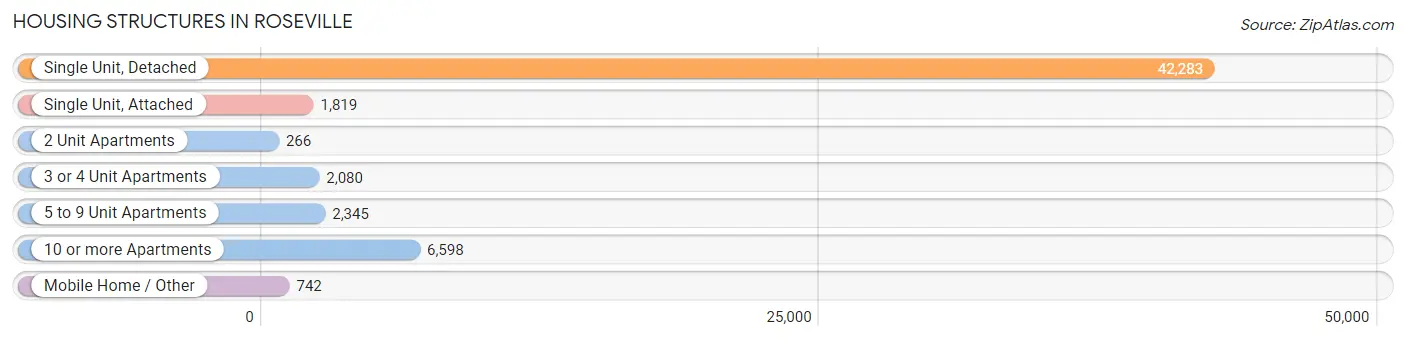
| Structure Type | # Housing Units | % Housing Units |
| Single Unit, Detached | 42,283 | 75.3% |
| Single Unit, Attached | 1,819 | 3.2% |
| 2 Unit Apartments | 266 | 0.5% |
| 3 or 4 Unit Apartments | 2,080 | 3.7% |
| 5 to 9 Unit Apartments | 2,345 | 4.2% |
| 10 or more Apartments | 6,598 | 11.7% |
| Mobile Home / Other | 742 | 1.3% |
| Total | 56,133 | 100.0% |
Housing Structures by Occupancy in Roseville
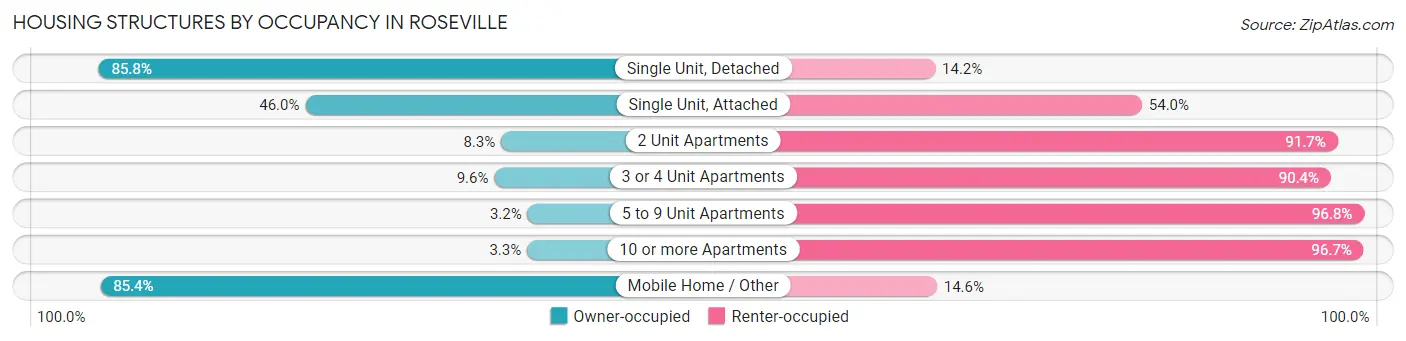
| Structure Type | Owner-occupied | Renter-occupied |
| Single Unit, Detached | 36,267 (85.8%) | 6,016 (14.2%) |
| Single Unit, Attached | 836 (46.0%) | 983 (54.0%) |
| 2 Unit Apartments | 22 (8.3%) | 244 (91.7%) |
| 3 or 4 Unit Apartments | 199 (9.6%) | 1,881 (90.4%) |
| 5 to 9 Unit Apartments | 74 (3.2%) | 2,271 (96.8%) |
| 10 or more Apartments | 215 (3.3%) | 6,383 (96.7%) |
| Mobile Home / Other | 634 (85.4%) | 108 (14.6%) |
| Total | 38,247 (68.1%) | 17,886 (31.9%) |
Housing Structures by Number of Rooms in Roseville
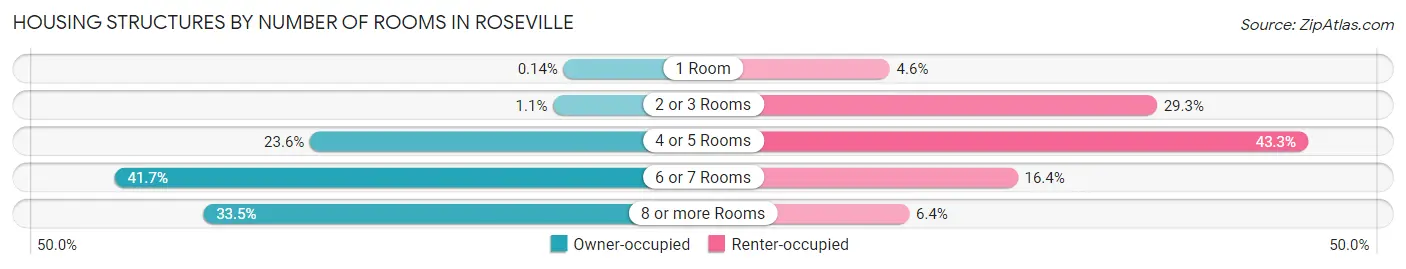
| Number of Rooms | Owner-occupied | Renter-occupied |
| 1 Room | 54 (0.1%) | 823 (4.6%) |
| 2 or 3 Rooms | 424 (1.1%) | 5,241 (29.3%) |
| 4 or 5 Rooms | 9,022 (23.6%) | 7,739 (43.3%) |
| 6 or 7 Rooms | 15,941 (41.7%) | 2,938 (16.4%) |
| 8 or more Rooms | 12,806 (33.5%) | 1,145 (6.4%) |
| Total | 38,247 (100.0%) | 17,886 (100.0%) |
Housing Structure by Heating Type in Roseville
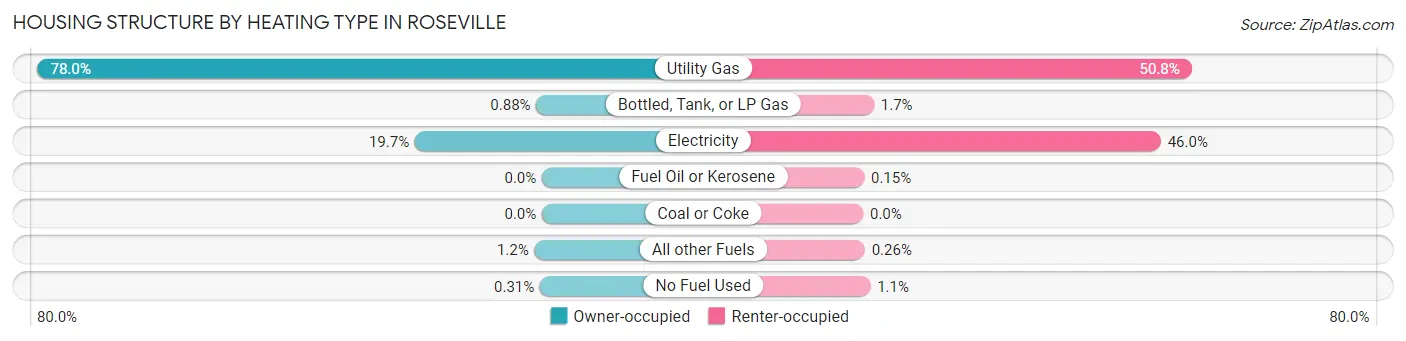
| Heating Type | Owner-occupied | Renter-occupied |
| Utility Gas | 29,827 (78.0%) | 9,084 (50.8%) |
| Bottled, Tank, or LP Gas | 338 (0.9%) | 298 (1.7%) |
| Electricity | 7,514 (19.7%) | 8,232 (46.0%) |
| Fuel Oil or Kerosene | 0 (0.0%) | 27 (0.2%) |
| Coal or Coke | 0 (0.0%) | 0 (0.0%) |
| All other Fuels | 449 (1.2%) | 46 (0.3%) |
| No Fuel Used | 119 (0.3%) | 199 (1.1%) |
| Total | 38,247 (100.0%) | 17,886 (100.0%) |
Household Vehicle Usage in Roseville
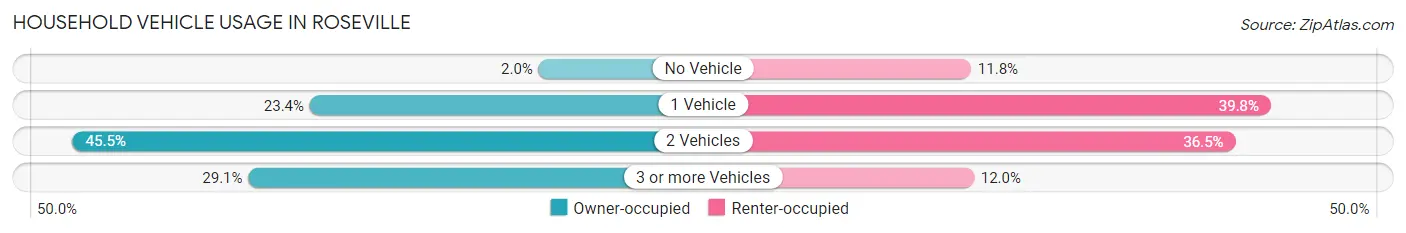
| Vehicles per Household | Owner-occupied | Renter-occupied |
| No Vehicle | 770 (2.0%) | 2,104 (11.8%) |
| 1 Vehicle | 8,940 (23.4%) | 7,111 (39.8%) |
| 2 Vehicles | 17,405 (45.5%) | 6,519 (36.4%) |
| 3 or more Vehicles | 11,132 (29.1%) | 2,152 (12.0%) |
| Total | 38,247 (100.0%) | 17,886 (100.0%) |
Real Estate & Mortgages in Roseville
Real Estate and Mortgage Overview in Roseville
| Characteristic | Without Mortgage | With Mortgage |
| Housing Units | 10,101 | 28,146 |
| Median Property Value | $579,300 | $602,500 |
| Median Household Income | $89,586 | $13,990 |
| Monthly Housing Costs | $767 | $11,203 |
| Real Estate Taxes | $4,298 | $248 |
Property Value by Mortgage Status in Roseville
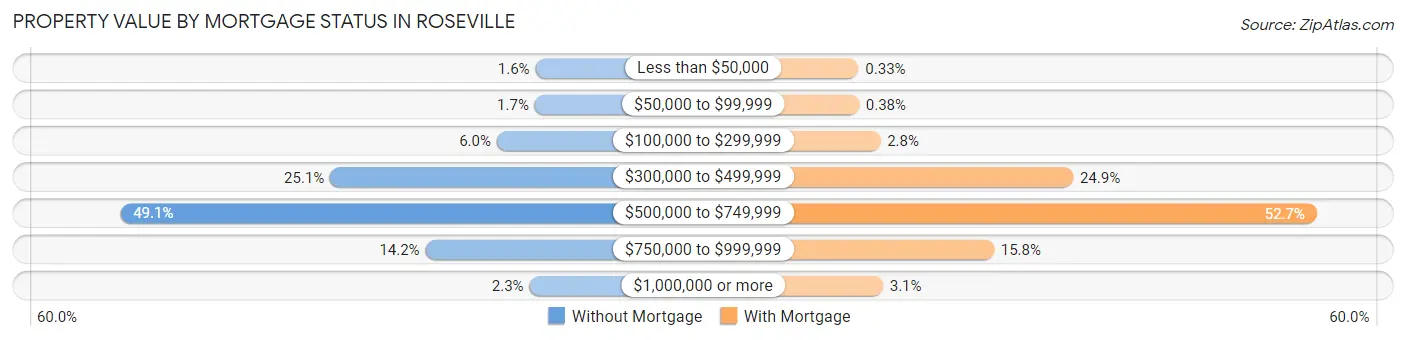
| Property Value | Without Mortgage | With Mortgage |
| Less than $50,000 | 164 (1.6%) | 92 (0.3%) |
| $50,000 to $99,999 | 172 (1.7%) | 106 (0.4%) |
| $100,000 to $299,999 | 609 (6.0%) | 794 (2.8%) |
| $300,000 to $499,999 | 2,533 (25.1%) | 6,995 (24.8%) |
| $500,000 to $749,999 | 4,957 (49.1%) | 14,837 (52.7%) |
| $750,000 to $999,999 | 1,433 (14.2%) | 4,448 (15.8%) |
| $1,000,000 or more | 233 (2.3%) | 874 (3.1%) |
| Total | 10,101 (100.0%) | 28,146 (100.0%) |
Household Income by Mortgage Status in Roseville
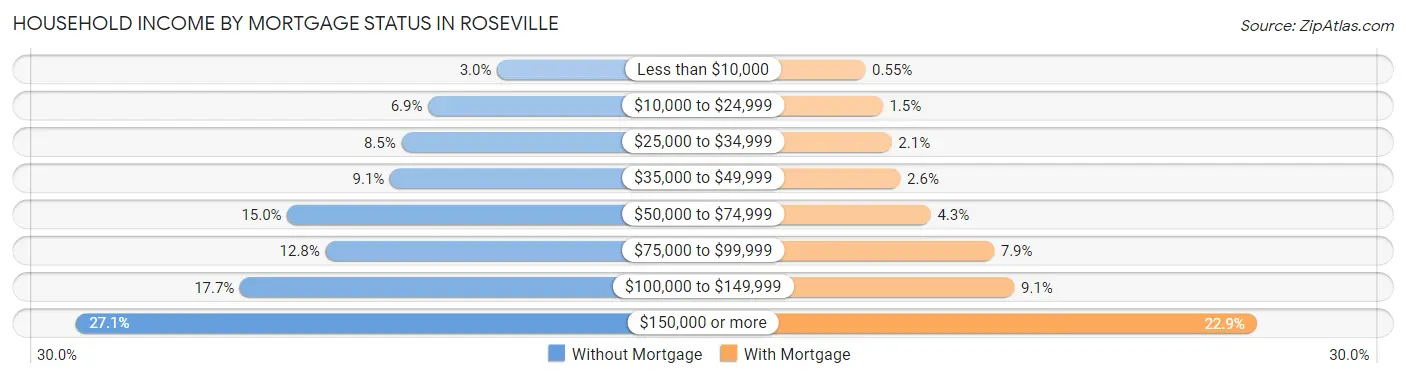
| Household Income | Without Mortgage | With Mortgage |
| Less than $10,000 | 302 (3.0%) | 156 (0.5%) |
| $10,000 to $24,999 | 700 (6.9%) | 433 (1.5%) |
| $25,000 to $34,999 | 855 (8.5%) | 578 (2.1%) |
| $35,000 to $49,999 | 920 (9.1%) | 717 (2.5%) |
| $50,000 to $74,999 | 1,513 (15.0%) | 1,205 (4.3%) |
| $75,000 to $99,999 | 1,293 (12.8%) | 2,223 (7.9%) |
| $100,000 to $149,999 | 1,786 (17.7%) | 2,550 (9.1%) |
| $150,000 or more | 2,732 (27.1%) | 6,450 (22.9%) |
| Total | 10,101 (100.0%) | 28,146 (100.0%) |
Property Value to Household Income Ratio in Roseville
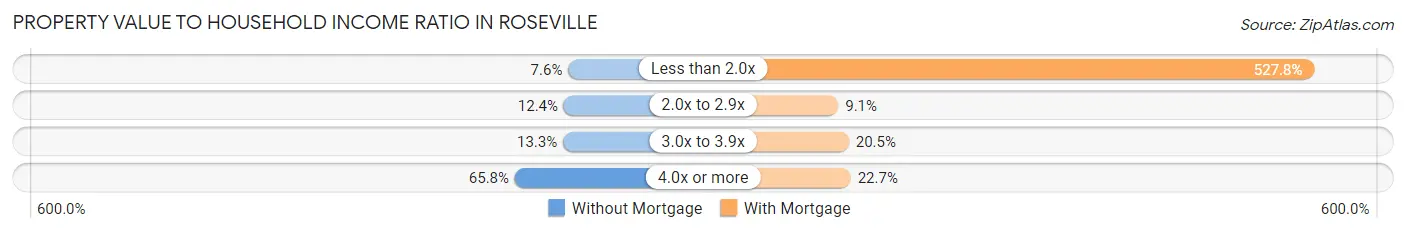
| Value-to-Income Ratio | Without Mortgage | With Mortgage |
| Less than 2.0x | 769 (7.6%) | 148,559 (527.8%) |
| 2.0x to 2.9x | 1,252 (12.4%) | 2,562 (9.1%) |
| 3.0x to 3.9x | 1,344 (13.3%) | 5,778 (20.5%) |
| 4.0x or more | 6,641 (65.7%) | 6,390 (22.7%) |
| Total | 10,101 (100.0%) | 28,146 (100.0%) |
Real Estate Taxes by Mortgage Status in Roseville
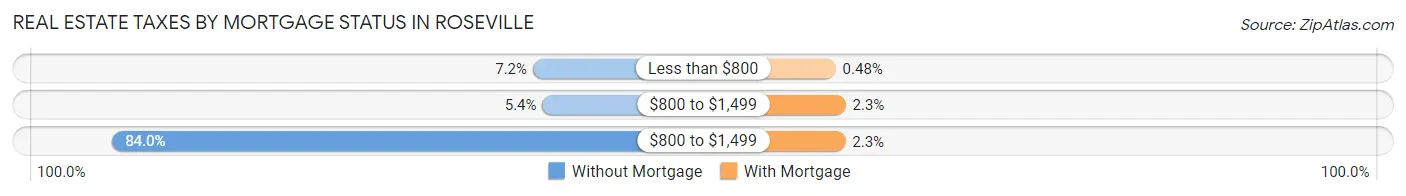
| Property Taxes | Without Mortgage | With Mortgage |
| Less than $800 | 723 (7.2%) | 134 (0.5%) |
| $800 to $1,499 | 548 (5.4%) | 648 (2.3%) |
| $800 to $1,499 | 8,484 (84.0%) | 632 (2.2%) |
| Total | 10,101 (100.0%) | 28,146 (100.0%) |
Health & Disability in Roseville
Health Insurance Coverage by Age in Roseville
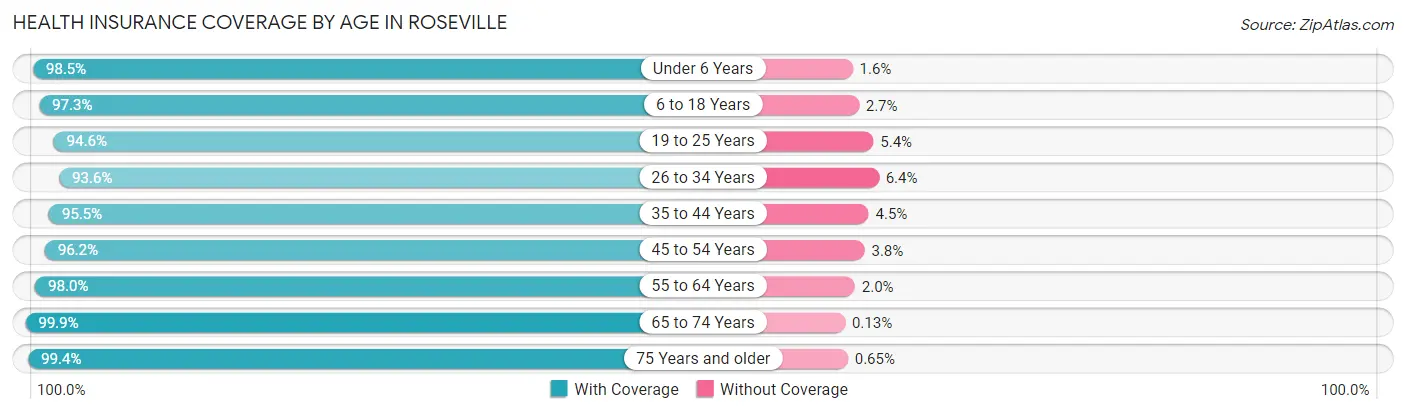
| Age Bracket | With Coverage | Without Coverage |
| Under 6 Years | 10,500 (98.5%) | 165 (1.5%) |
| 6 to 18 Years | 24,479 (97.3%) | 679 (2.7%) |
| 19 to 25 Years | 10,551 (94.6%) | 605 (5.4%) |
| 26 to 34 Years | 16,085 (93.6%) | 1,103 (6.4%) |
| 35 to 44 Years | 20,314 (95.5%) | 964 (4.5%) |
| 45 to 54 Years | 18,581 (96.2%) | 728 (3.8%) |
| 55 to 64 Years | 17,891 (98.0%) | 359 (2.0%) |
| 65 to 74 Years | 13,860 (99.9%) | 18 (0.1%) |
| 75 Years and older | 11,115 (99.4%) | 73 (0.6%) |
| Total | 143,376 (96.8%) | 4,694 (3.2%) |
Health Insurance Coverage by Citizenship Status in Roseville
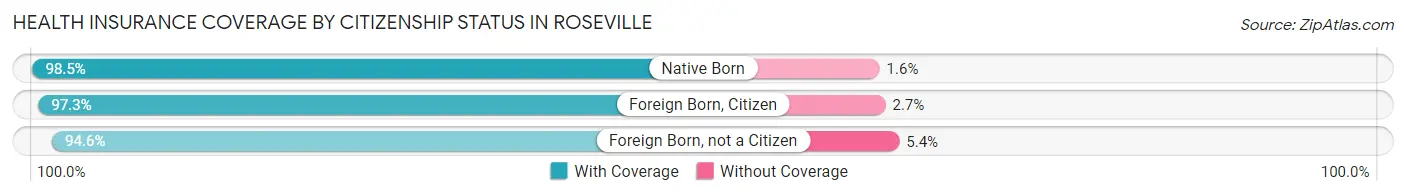
| Citizenship Status | With Coverage | Without Coverage |
| Native Born | 10,500 (98.5%) | 165 (1.5%) |
| Foreign Born, Citizen | 24,479 (97.3%) | 679 (2.7%) |
| Foreign Born, not a Citizen | 10,551 (94.6%) | 605 (5.4%) |
Health Insurance Coverage by Household Income in Roseville
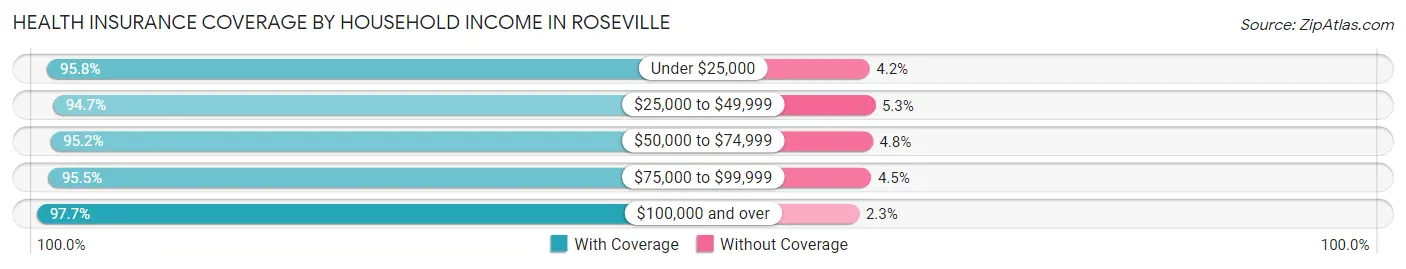
| Household Income | With Coverage | Without Coverage |
| Under $25,000 | 7,927 (95.8%) | 350 (4.2%) |
| $25,000 to $49,999 | 12,394 (94.7%) | 691 (5.3%) |
| $50,000 to $74,999 | 14,063 (95.2%) | 711 (4.8%) |
| $75,000 to $99,999 | 15,336 (95.5%) | 727 (4.5%) |
| $100,000 and over | 92,921 (97.7%) | 2,168 (2.3%) |
Public vs Private Health Insurance Coverage by Age in Roseville
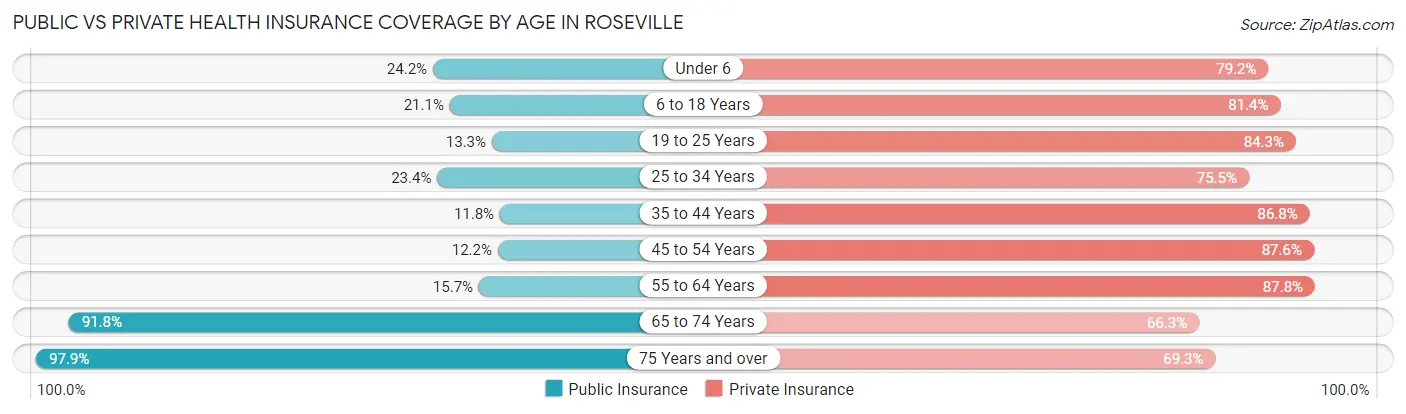
| Age Bracket | Public Insurance | Private Insurance |
| Under 6 | 2,582 (24.2%) | 8,444 (79.2%) |
| 6 to 18 Years | 5,305 (21.1%) | 20,479 (81.4%) |
| 19 to 25 Years | 1,480 (13.3%) | 9,400 (84.3%) |
| 25 to 34 Years | 4,024 (23.4%) | 12,984 (75.5%) |
| 35 to 44 Years | 2,504 (11.8%) | 18,473 (86.8%) |
| 45 to 54 Years | 2,348 (12.2%) | 16,912 (87.6%) |
| 55 to 64 Years | 2,859 (15.7%) | 16,026 (87.8%) |
| 65 to 74 Years | 12,738 (91.8%) | 9,201 (66.3%) |
| 75 Years and over | 10,950 (97.9%) | 7,757 (69.3%) |
| Total | 44,790 (30.2%) | 119,676 (80.8%) |
Disability Status by Sex by Age in Roseville
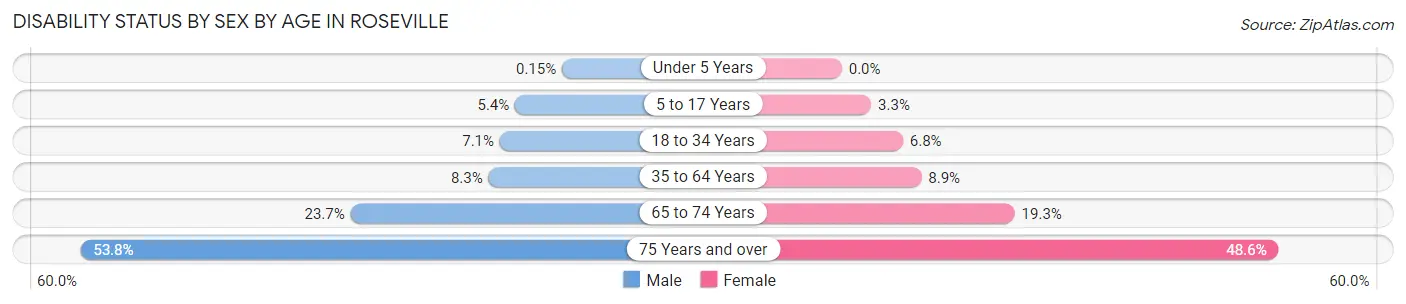
| Age Bracket | Male | Female |
| Under 5 Years | 7 (0.2%) | 0 (0.0%) |
| 5 to 17 Years | 677 (5.4%) | 404 (3.3%) |
| 18 to 34 Years | 1,071 (7.1%) | 1,031 (6.8%) |
| 35 to 64 Years | 2,400 (8.3%) | 2,660 (8.9%) |
| 65 to 74 Years | 1,502 (23.7%) | 1,452 (19.3%) |
| 75 Years and over | 2,400 (53.8%) | 3,271 (48.6%) |
Disability Class by Sex by Age in Roseville
Disability Class: Hearing Difficulty
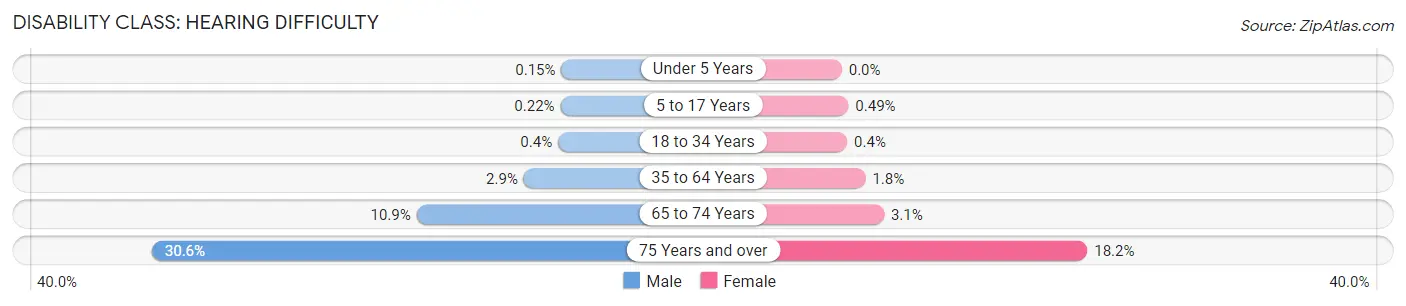
| Age Bracket | Male | Female |
| Under 5 Years | 7 (0.2%) | 0 (0.0%) |
| 5 to 17 Years | 28 (0.2%) | 60 (0.5%) |
| 18 to 34 Years | 61 (0.4%) | 61 (0.4%) |
| 35 to 64 Years | 846 (2.9%) | 528 (1.8%) |
| 65 to 74 Years | 691 (10.9%) | 236 (3.1%) |
| 75 Years and over | 1,363 (30.5%) | 1,226 (18.2%) |
Disability Class: Vision Difficulty
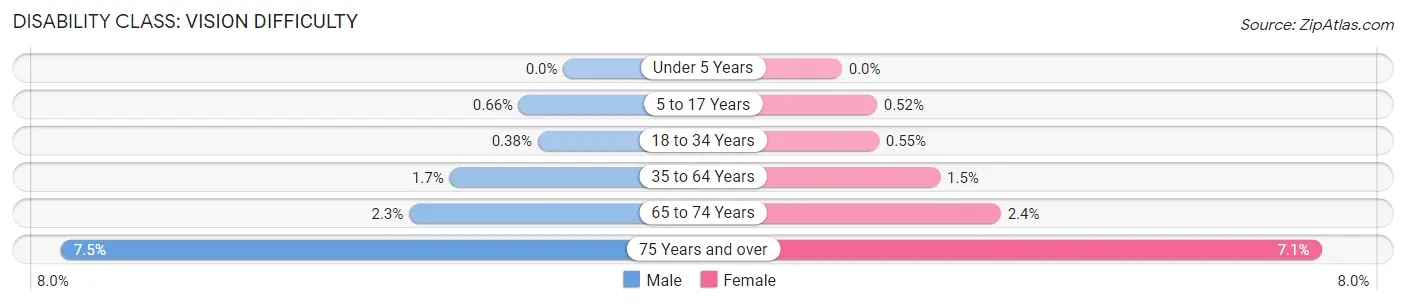
| Age Bracket | Male | Female |
| Under 5 Years | 0 (0.0%) | 0 (0.0%) |
| 5 to 17 Years | 83 (0.7%) | 64 (0.5%) |
| 18 to 34 Years | 58 (0.4%) | 84 (0.5%) |
| 35 to 64 Years | 487 (1.7%) | 437 (1.5%) |
| 65 to 74 Years | 145 (2.3%) | 178 (2.4%) |
| 75 Years and over | 333 (7.5%) | 479 (7.1%) |
Disability Class: Cognitive Difficulty
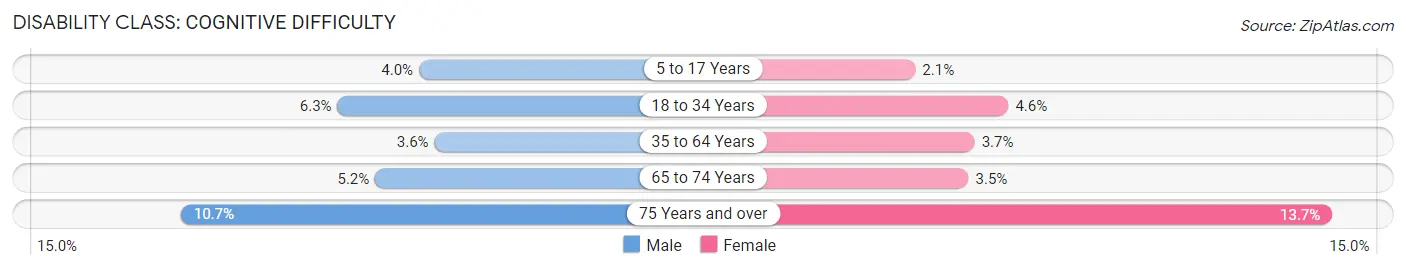
| Age Bracket | Male | Female |
| 5 to 17 Years | 507 (4.0%) | 254 (2.1%) |
| 18 to 34 Years | 953 (6.3%) | 703 (4.6%) |
| 35 to 64 Years | 1,033 (3.6%) | 1,112 (3.7%) |
| 65 to 74 Years | 332 (5.2%) | 266 (3.5%) |
| 75 Years and over | 475 (10.6%) | 918 (13.7%) |
Disability Class: Ambulatory Difficulty
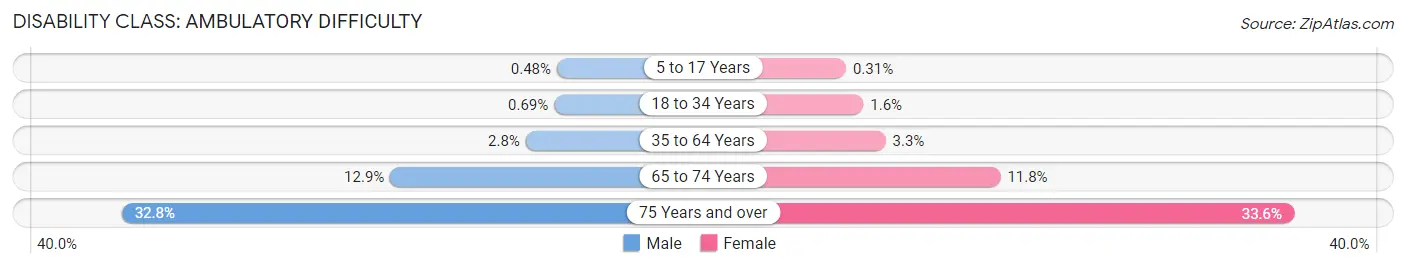
| Age Bracket | Male | Female |
| 5 to 17 Years | 60 (0.5%) | 38 (0.3%) |
| 18 to 34 Years | 104 (0.7%) | 243 (1.6%) |
| 35 to 64 Years | 807 (2.8%) | 977 (3.3%) |
| 65 to 74 Years | 815 (12.9%) | 888 (11.8%) |
| 75 Years and over | 1,463 (32.8%) | 2,257 (33.6%) |
Disability Class: Self-Care Difficulty
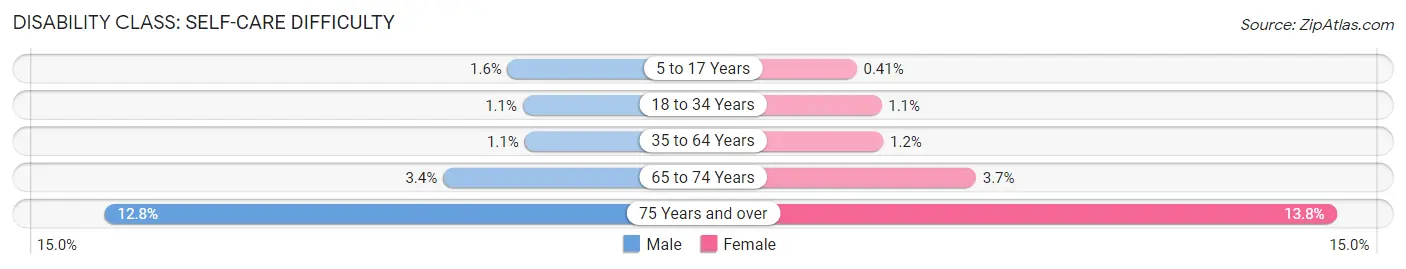
| Age Bracket | Male | Female |
| 5 to 17 Years | 196 (1.5%) | 51 (0.4%) |
| 18 to 34 Years | 171 (1.1%) | 167 (1.1%) |
| 35 to 64 Years | 312 (1.1%) | 346 (1.1%) |
| 65 to 74 Years | 212 (3.4%) | 281 (3.7%) |
| 75 Years and over | 570 (12.8%) | 926 (13.8%) |
Technology Access in Roseville
Computing Device Access in Roseville
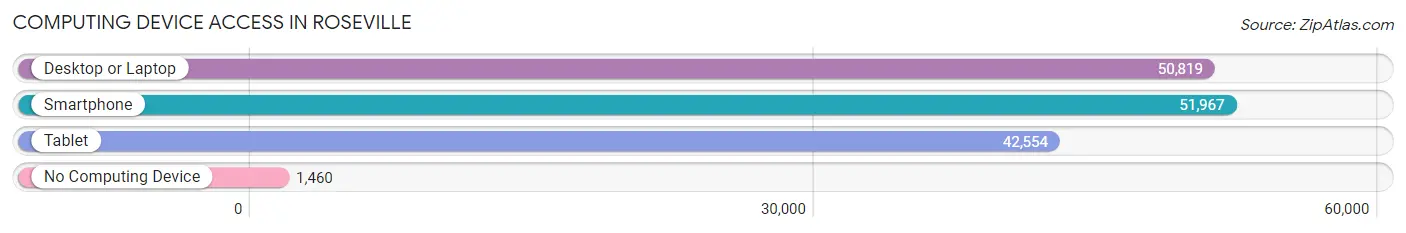
| Device Type | # Households | % Households |
| Desktop or Laptop | 50,819 | 90.5% |
| Smartphone | 51,967 | 92.6% |
| Tablet | 42,554 | 75.8% |
| No Computing Device | 1,460 | 2.6% |
| Total | 56,133 | 100.0% |
Internet Access in Roseville
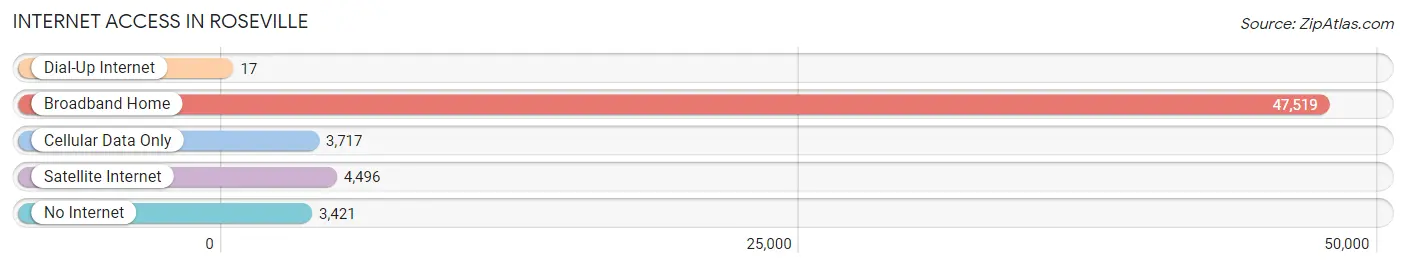
| Internet Type | # Households | % Households |
| Dial-Up Internet | 17 | 0.0% |
| Broadband Home | 47,519 | 84.7% |
| Cellular Data Only | 3,717 | 6.6% |
| Satellite Internet | 4,496 | 8.0% |
| No Internet | 3,421 | 6.1% |
| Total | 56,133 | 100.0% |
Roseville Summary
Roseville, California is a city located in Placer County, California, United States. It is part of the Sacramento metropolitan area and is located approximately 25 miles northeast of Sacramento. As of the 2010 census, the city had a population of 118,788, making it the largest city in Placer County.
History
The area that is now Roseville was originally inhabited by the Maidu and Miwok Native American tribes. The first European settlers arrived in the area in the mid-1800s, and the city was officially incorporated in 1909. The city was named after the Roseville post office, which was established in 1864.
The city experienced rapid growth in the 1950s and 1960s, and by the 1970s, it had become a major retail center. The city has continued to grow since then, and it is now home to a variety of businesses, including technology, healthcare, and retail.
Geography
Roseville is located in the Central Valley of California, approximately 25 miles northeast of Sacramento. It is bordered by the cities of Citrus Heights to the west, Rocklin to the north, and Lincoln to the east. The city covers an area of approximately 33.2 square miles, and it has an elevation of approximately 200 feet.
The city is located in a Mediterranean climate zone, and it experiences hot, dry summers and mild, wet winters. The average annual temperature is approximately 64°F, and the average annual precipitation is approximately 18 inches.
Economy
Roseville is a major economic center in the Sacramento metropolitan area. The city is home to a variety of businesses, including technology, healthcare, and retail. The city is also home to several major employers, including Hewlett Packard, Kaiser Permanente, and Sutter Health.
The city’s economy is also supported by tourism. Roseville is home to several attractions, including the Roseville Aquatics Complex, the Roseville Golfland Sunsplash, and the Westfield Galleria at Roseville.
Demographics
As of the 2010 census, the city had a population of 118,788. The racial makeup of the city was 75.3% White, 8.2% African American, 0.7% Native American, 8.2% Asian, 0.3% Pacific Islander, and 4.3% from other races. The median household income was $67,845, and the median family income was $77,845.
Conclusion
Roseville, California is a city located in Placer County, California, United States. It is part of the Sacramento metropolitan area and is located approximately 25 miles northeast of Sacramento. As of the 2010 census, the city had a population of 118,788, making it the largest city in Placer County. The city is home to a variety of businesses, including technology, healthcare, and retail, and it is also supported by tourism. The city has a diverse population, with a median household income of $67,845 and a median family income of $77,845. Roseville is a major economic center in the Sacramento metropolitan area and is an attractive place to live and work.
Common Questions
What is Per Capita Income in Roseville?
Per Capita income in Roseville is $51,684.
What is the Median Family Income in Roseville?
Median Family Income in Roseville is $132,941.
What is the Median Household income in Roseville?
Median Household Income in Roseville is $112,265.
What is Income or Wage Gap in Roseville?
Income or Wage Gap in Roseville is 29.8%.
Women in Roseville earn 70.2 cents for every dollar earned by a man.
What is Family Income Deficit in Roseville?
Family Income Deficit in Roseville is $10,139.
Families that are below poverty line in Roseville earn $10,139 less on average than the poverty threshold level.
What is Inequality or Gini Index in Roseville?
Inequality or Gini Index in Roseville is 0.41.
What is the Total Population of Roseville?
Total Population of Roseville is 148,879.
What is the Total Male Population of Roseville?
Total Male Population of Roseville is 72,697.
What is the Total Female Population of Roseville?
Total Female Population of Roseville is 76,182.
What is the Ratio of Males per 100 Females in Roseville?
There are 95.43 Males per 100 Females in Roseville.
What is the Ratio of Females per 100 Males in Roseville?
There are 104.79 Females per 100 Males in Roseville.
What is the Median Population Age in Roseville?
Median Population Age in Roseville is 39.8 Years.
What is the Average Family Size in Roseville
Average Family Size in Roseville is 3.1 People.
What is the Average Household Size in Roseville
Average Household Size in Roseville is 2.6 People.
How Large is the Labor Force in Roseville?
There are 77,233 People in the Labor Forcein in Roseville.
What is the Percentage of People in the Labor Force in Roseville?
64.8% of People are in the Labor Force in Roseville.
What is the Unemployment Rate in Roseville?
Unemployment Rate in Roseville is 4.5%.