Cities with the Largest Tongan Community in the United States
RELATED REPORTS & OPTIONS
Tongan
United States
Compare Cities
Map of Cities with the Largest Tongan Community in the United States
0
4,000
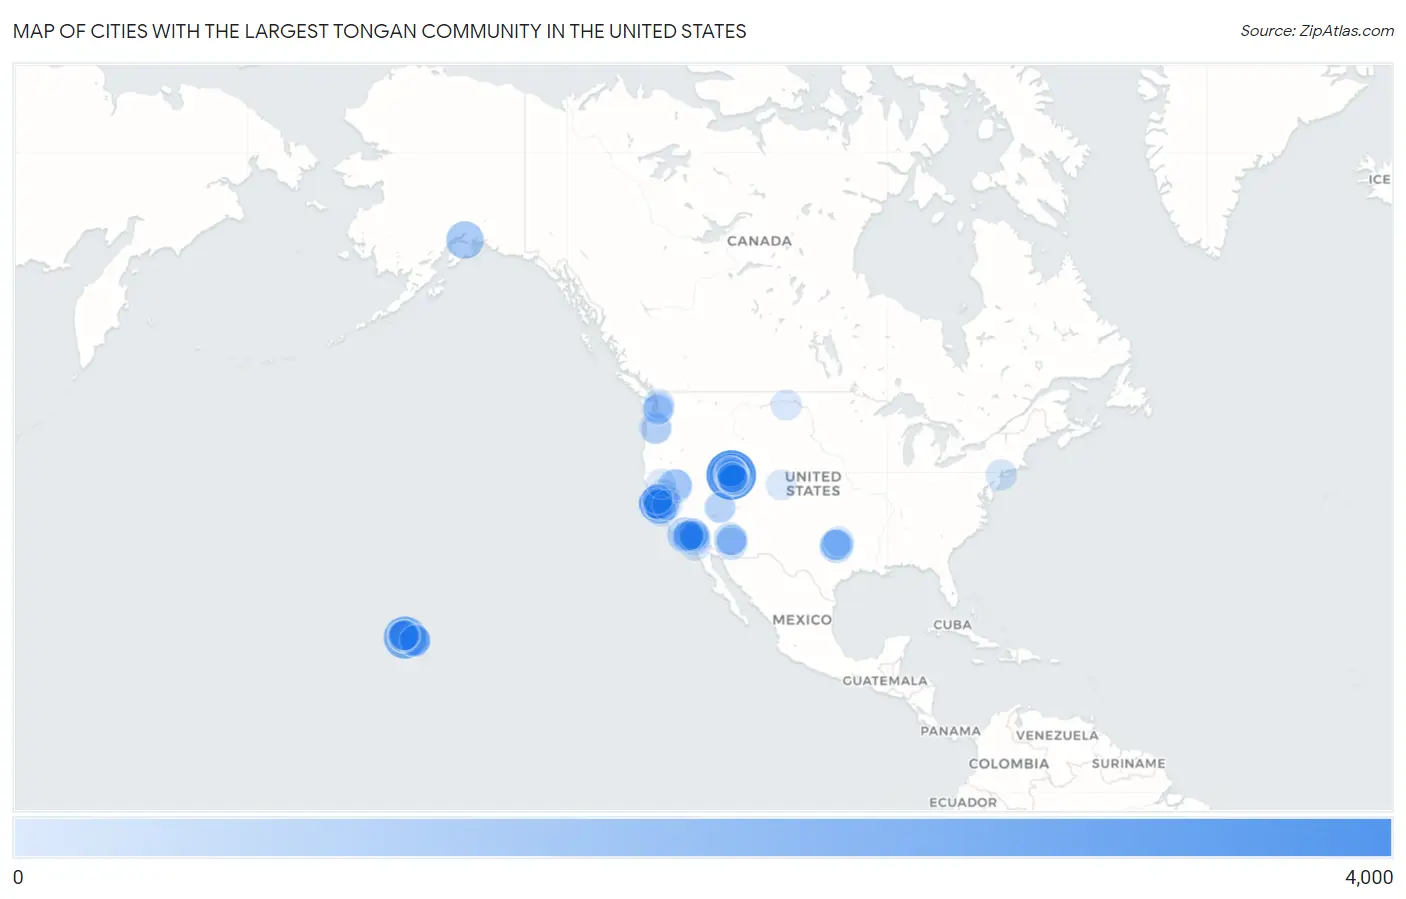
Cities with the Largest Tongan Community in the United States
| City | Tongan | vs State | vs National | |
| 1. | West Valley City | 3,157 | 18,122(17.42%)#1 | 69,511(4.54%)#1 |
| 2. | Salt Lake City | 2,100 | 18,122(11.59%)#2 | 69,511(3.02%)#2 |
| 3. | Urban Honolulu | 2,042 | 9,535(21.42%)#1 | 69,511(2.94%)#3 |
| 4. | West Jordan | 1,349 | 18,122(7.44%)#3 | 69,511(1.94%)#4 |
| 5. | East Palo Alto | 1,265 | 23,798(5.32%)#1 | 69,511(1.82%)#5 |
| 6. | Anchorage | 1,253 | 1,919(65.29%)#1 | 69,511(1.80%)#6 |
| 7. | San Mateo | 1,197 | 23,798(5.03%)#2 | 69,511(1.72%)#7 |
| 8. | Oakland | 1,107 | 23,798(4.65%)#3 | 69,511(1.59%)#8 |
| 9. | Los Angeles | 940 | 23,798(3.95%)#4 | 69,511(1.35%)#9 |
| 10. | Laie | 940 | 9,535(9.86%)#2 | 69,511(1.35%)#10 |
| 11. | San Bruno | 924 | 23,798(3.88%)#5 | 69,511(1.33%)#11 |
| 12. | Provo | 863 | 18,122(4.76%)#4 | 69,511(1.24%)#12 |
| 13. | Kearns | 862 | 18,122(4.76%)#5 | 69,511(1.24%)#13 |
| 14. | Taylorsville | 850 | 18,122(4.69%)#6 | 69,511(1.22%)#14 |
| 15. | Reno | 809 | 1,630(49.63%)#1 | 69,511(1.16%)#15 |
| 16. | San Jose | 767 | 23,798(3.22%)#6 | 69,511(1.10%)#16 |
| 17. | Arlington | 653 | 2,671(24.45%)#1 | 69,511(0.94%)#17 |
| 18. | American Fork | 611 | 18,122(3.37%)#7 | 69,511(0.88%)#18 |
| 19. | Ontario | 607 | 23,798(2.55%)#7 | 69,511(0.87%)#19 |
| 20. | Lahaina | 593 | 9,535(6.22%)#3 | 69,511(0.85%)#20 |
| 21. | Orem | 570 | 18,122(3.15%)#8 | 69,511(0.82%)#21 |
| 22. | Menlo Park | 528 | 23,798(2.22%)#8 | 69,511(0.76%)#22 |
| 23. | Napili Honokowai | 511 | 9,535(5.36%)#4 | 69,511(0.74%)#23 |
| 24. | Phoenix | 502 | 1,842(27.25%)#1 | 69,511(0.72%)#24 |
| 25. | San Lorenzo | 502 | 23,798(2.11%)#9 | 69,511(0.72%)#25 |
| 26. | San Leandro | 489 | 23,798(2.05%)#10 | 69,511(0.70%)#26 |
| 27. | Sandy | 480 | 18,122(2.65%)#9 | 69,511(0.69%)#27 |
| 28. | Hayward | 476 | 23,798(2.00%)#11 | 69,511(0.68%)#28 |
| 29. | South Salt Lake | 464 | 18,122(2.56%)#10 | 69,511(0.67%)#29 |
| 30. | Maricopa | 459 | 1,842(24.92%)#2 | 69,511(0.66%)#30 |
| 31. | Juneau City And Borough | 455 | 1,919(23.71%)#2 | 69,511(0.65%)#31 |
| 32. | Wahiawa | 436 | 9,535(4.57%)#5 | 69,511(0.63%)#32 |
| 33. | Portland | 430 | 808(53.22%)#1 | 69,511(0.62%)#33 |
| 34. | San Francisco | 429 | 23,798(1.80%)#12 | 69,511(0.62%)#34 |
| 35. | Midvale | 428 | 18,122(2.36%)#11 | 69,511(0.62%)#35 |
| 36. | Sacramento | 424 | 23,798(1.78%)#13 | 69,511(0.61%)#36 |
| 37. | Fremont | 386 | 23,798(1.62%)#14 | 69,511(0.56%)#37 |
| 38. | Long Beach | 374 | 23,798(1.57%)#15 | 69,511(0.54%)#38 |
| 39. | Euless | 361 | 2,671(13.52%)#2 | 69,511(0.52%)#39 |
| 40. | Fountain Valley | 353 | 23,798(1.48%)#16 | 69,511(0.51%)#40 |
| 41. | Eagle Mountain | 338 | 18,122(1.87%)#12 | 69,511(0.49%)#41 |
| 42. | Stockton | 333 | 23,798(1.40%)#17 | 69,511(0.48%)#42 |
| 43. | San Diego | 328 | 23,798(1.38%)#18 | 69,511(0.47%)#43 |
| 44. | New York | 318 | 444(71.62%)#1 | 69,511(0.46%)#44 |
| 45. | Menifee | 317 | 23,798(1.33%)#19 | 69,511(0.46%)#45 |
| 46. | Murray | 309 | 18,122(1.71%)#13 | 69,511(0.44%)#46 |
| 47. | Lennox | 304 | 23,798(1.28%)#20 | 69,511(0.44%)#47 |
| 48. | Centerville | 304 | 18,122(1.68%)#14 | 69,511(0.44%)#48 |
| 49. | Belmont | 291 | 23,798(1.22%)#21 | 69,511(0.42%)#49 |
| 50. | St George | 289 | 18,122(1.59%)#15 | 69,511(0.42%)#50 |
| 51. | Magna | 286 | 18,122(1.58%)#16 | 69,511(0.41%)#51 |
| 52. | Royal Kunia | 284 | 9,535(2.98%)#6 | 69,511(0.41%)#52 |
| 53. | Santa Clara | 280 | 23,798(1.18%)#22 | 69,511(0.40%)#53 |
| 54. | Temecula | 274 | 23,798(1.15%)#23 | 69,511(0.39%)#54 |
| 55. | Lakewood | 259 | 23,798(1.09%)#24 | 69,511(0.37%)#55 |
| 56. | Cottonwood Heights | 259 | 18,122(1.43%)#17 | 69,511(0.37%)#56 |
| 57. | Farmington | 257 | 18,122(1.42%)#18 | 69,511(0.37%)#57 |
| 58. | Kihei | 257 | 9,535(2.70%)#7 | 69,511(0.37%)#58 |
| 59. | Sidney | 255 | 435(58.62%)#1 | 69,511(0.37%)#59 |
| 60. | Jurupa Valley | 247 | 23,798(1.04%)#25 | 69,511(0.36%)#60 |
| 61. | Corona | 242 | 23,798(1.02%)#26 | 69,511(0.35%)#61 |
| 62. | Sparks | 241 | 1,630(14.79%)#2 | 69,511(0.35%)#62 |
| 63. | Kahuku | 238 | 9,535(2.50%)#8 | 69,511(0.34%)#63 |
| 64. | Nanakuli | 237 | 9,535(2.49%)#9 | 69,511(0.34%)#64 |
| 65. | Centennial | 235 | 414(56.76%)#1 | 69,511(0.34%)#65 |
| 66. | Herriman | 235 | 18,122(1.30%)#19 | 69,511(0.34%)#66 |
| 67. | Marina | 228 | 23,798(0.96%)#27 | 69,511(0.33%)#67 |
| 68. | San Bernardino | 227 | 23,798(0.95%)#28 | 69,511(0.33%)#68 |
| 69. | Bountiful | 227 | 18,122(1.25%)#20 | 69,511(0.33%)#69 |
| 70. | Mesa | 225 | 1,842(12.21%)#3 | 69,511(0.32%)#70 |
| 71. | Renton | 224 | 2,373(9.44%)#1 | 69,511(0.32%)#71 |
| 72. | Mililani Town | 222 | 9,535(2.33%)#10 | 69,511(0.32%)#72 |
| 73. | North Richmond | 222 | 23,798(0.93%)#29 | 69,511(0.32%)#73 |
| 74. | Redwood City | 220 | 23,798(0.92%)#30 | 69,511(0.32%)#74 |
| 75. | Kaiminani | 216 | 9,535(2.27%)#11 | 69,511(0.31%)#75 |
| 76. | Kent | 215 | 2,373(9.06%)#2 | 69,511(0.31%)#76 |
| 77. | Clearfield | 212 | 18,122(1.17%)#21 | 69,511(0.30%)#77 |
| 78. | Gresham | 208 | 808(25.74%)#2 | 69,511(0.30%)#78 |
| 79. | Clinton | 205 | 18,122(1.13%)#22 | 69,511(0.29%)#79 |
| 80. | Pleasant Grove | 204 | 18,122(1.13%)#23 | 69,511(0.29%)#80 |
| 81. | Hauula | 204 | 9,535(2.14%)#12 | 69,511(0.29%)#81 |
| 82. | Haleiwa | 198 | 9,535(2.08%)#13 | 69,511(0.28%)#82 |
| 83. | Buena Park | 194 | 23,798(0.82%)#31 | 69,511(0.28%)#83 |
| 84. | Tempe | 183 | 1,842(9.93%)#4 | 69,511(0.26%)#84 |
| 85. | Millbrae | 183 | 23,798(0.77%)#32 | 69,511(0.26%)#85 |
| 86. | Silver Firs | 179 | 2,373(7.54%)#3 | 69,511(0.26%)#86 |
| 87. | Wailuku | 179 | 9,535(1.88%)#14 | 69,511(0.26%)#87 |
| 88. | Federal Way | 178 | 2,373(7.50%)#4 | 69,511(0.26%)#88 |
| 89. | Turlock | 178 | 23,798(0.75%)#33 | 69,511(0.26%)#89 |
| 90. | Chico | 175 | 23,798(0.74%)#34 | 69,511(0.25%)#90 |
| 91. | Fort Worth | 173 | 2,671(6.48%)#3 | 69,511(0.25%)#91 |
| 92. | Lehi | 173 | 18,122(0.95%)#24 | 69,511(0.25%)#92 |
| 93. | Bedford | 173 | 2,671(6.48%)#4 | 69,511(0.25%)#93 |
| 94. | Nuevo | 173 | 23,798(0.73%)#35 | 69,511(0.25%)#94 |
| 95. | Washington | 172 | 18,122(0.95%)#25 | 69,511(0.25%)#95 |
| 96. | Vallejo | 171 | 23,798(0.72%)#36 | 69,511(0.25%)#96 |
| 97. | West Covina | 171 | 23,798(0.72%)#37 | 69,511(0.25%)#97 |
| 98. | Draper | 169 | 18,122(0.93%)#26 | 69,511(0.24%)#98 |
| 99. | Springville | 168 | 18,122(0.93%)#27 | 69,511(0.24%)#99 |
| 100. | Celina | 168 | 2,671(6.29%)#5 | 69,511(0.24%)#100 |
Common Questions
What are the Top 10 Cities with the Largest Tongan Community in the United States?
Top 10 Cities with the Largest Tongan Community in the United States are:
#1
3,157
#2
2,100
#3
2,042
#4
1,349
#5
1,265
#6
1,253
#7
1,197
#8
1,107
#9
940
#10
940
What city has the Largest Tongan Community in the United States?
West Valley City has the Largest Tongan Community in the United States with 3,157.
What is the Total Tongan Population in the United States?
Total Tongan Population in the United States is 69,511.