Clearlake, CA Map & Demographics
Clearlake Map
Clearlake Overview
$20,089
PER CAPITA INCOME
$50,756
AVG FAMILY INCOME
$41,047
AVG HOUSEHOLD INCOME
0.5%
WAGE / INCOME GAP [ % ]
99.5¢/ $1
WAGE / INCOME GAP [ $ ]
$11,144
FAMILY INCOME DEFICIT
0.43
INEQUALITY / GINI INDEX
16,612
TOTAL POPULATION
8,202
MALE POPULATION
8,410
FEMALE POPULATION
97.53
MALES / 100 FEMALES
102.54
FEMALES / 100 MALES
38.6
MEDIAN AGE
3.5
AVG FAMILY SIZE
2.8
AVG HOUSEHOLD SIZE
6,142
LABOR FORCE [ PEOPLE ]
48.2%
PERCENT IN LABOR FORCE
16.7%
UNEMPLOYMENT RATE
Clearlake Zip Codes
Clearlake Area Codes
Income in Clearlake
Income Overview in Clearlake
Per Capita Income in Clearlake is $20,089, while median incomes of families and households are $50,756 and $41,047 respectively.
| Characteristic | Number | Measure |
| Per Capita Income | 16,612 | $20,089 |
| Median Family Income | 3,467 | $50,756 |
| Mean Family Income | 3,467 | $63,981 |
| Median Household Income | 5,847 | $41,047 |
| Mean Household Income | 5,847 | $54,088 |
| Income Deficit | 3,467 | $11,144 |
| Wage / Income Gap (%) | 16,612 | 0.49% |
| Wage / Income Gap ($) | 16,612 | 99.51¢ per $1 |
| Gini / Inequality Index | 16,612 | 0.43 |
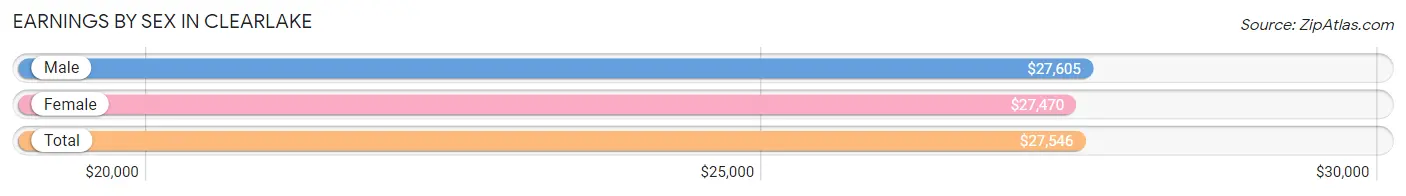
Earnings by Sex in Clearlake
Average Earnings in Clearlake are $27,546, $27,605 for men and $27,470 for women, a difference of 0.5%.
| Sex | Number | Average Earnings |
| Male | 3,125 (49.1%) | $27,605 |
| Female | 3,235 (50.9%) | $27,470 |
| Total | 6,360 (100.0%) | $27,546 |
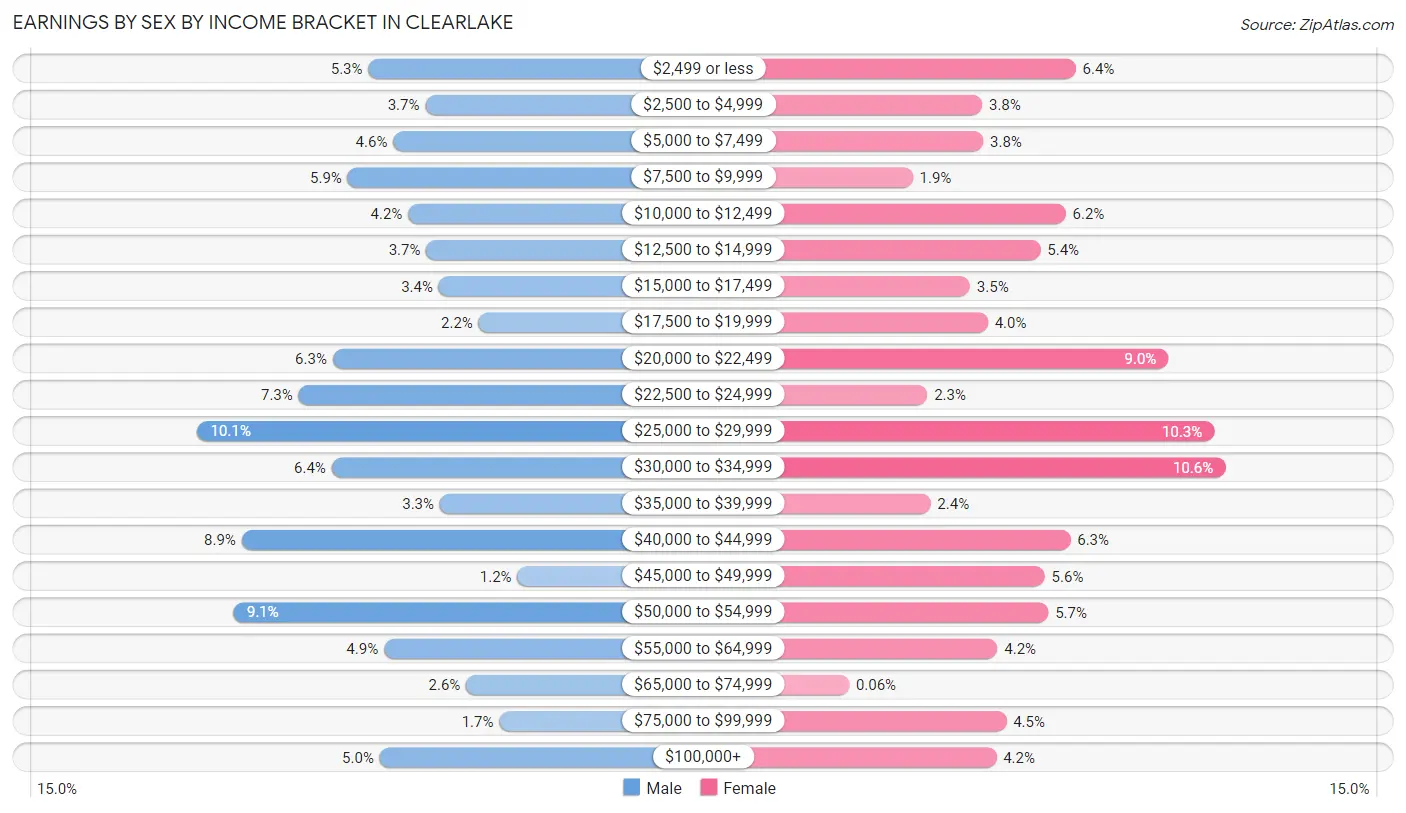
Earnings by Sex by Income Bracket in Clearlake
The most common earnings brackets in Clearlake are $25,000 to $29,999 for men (317 | 10.1%) and $30,000 to $34,999 for women (344 | 10.6%).
| Income | Male | Female |
| $2,499 or less | 167 (5.3%) | 208 (6.4%) |
| $2,500 to $4,999 | 117 (3.7%) | 123 (3.8%) |
| $5,000 to $7,499 | 145 (4.6%) | 124 (3.8%) |
| $7,500 to $9,999 | 185 (5.9%) | 60 (1.8%) |
| $10,000 to $12,499 | 132 (4.2%) | 199 (6.1%) |
| $12,500 to $14,999 | 116 (3.7%) | 176 (5.4%) |
| $15,000 to $17,499 | 105 (3.4%) | 112 (3.5%) |
| $17,500 to $19,999 | 70 (2.2%) | 128 (4.0%) |
| $20,000 to $22,499 | 198 (6.3%) | 292 (9.0%) |
| $22,500 to $24,999 | 228 (7.3%) | 73 (2.3%) |
| $25,000 to $29,999 | 317 (10.1%) | 334 (10.3%) |
| $30,000 to $34,999 | 199 (6.4%) | 344 (10.6%) |
| $35,000 to $39,999 | 104 (3.3%) | 76 (2.4%) |
| $40,000 to $44,999 | 278 (8.9%) | 203 (6.3%) |
| $45,000 to $49,999 | 36 (1.1%) | 180 (5.6%) |
| $50,000 to $54,999 | 285 (9.1%) | 183 (5.7%) |
| $55,000 to $64,999 | 153 (4.9%) | 137 (4.2%) |
| $65,000 to $74,999 | 81 (2.6%) | 2 (0.1%) |
| $75,000 to $99,999 | 52 (1.7%) | 145 (4.5%) |
| $100,000+ | 157 (5.0%) | 136 (4.2%) |
| Total | 3,125 (100.0%) | 3,235 (100.0%) |
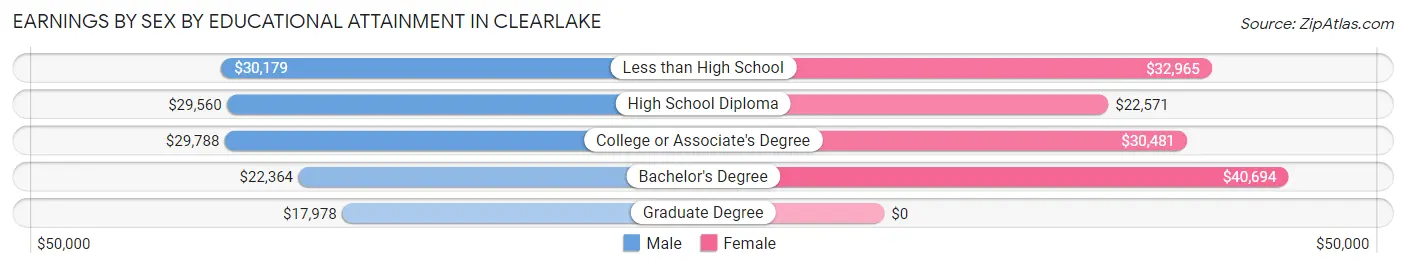
Earnings by Sex by Educational Attainment in Clearlake
Average earnings in Clearlake are $29,042 for men and $28,445 for women, a difference of 2.1%. Men with an educational attainment of less than high school enjoy the highest average annual earnings of $30,179, while those with graduate degree education earn the least with $17,978. Women with an educational attainment of bachelor's degree earn the most with the average annual earnings of $40,694, while those with high school diploma education have the smallest earnings of $22,571.
| Educational Attainment | Male Income | Female Income |
| Less than High School | $30,179 | $32,965 |
| High School Diploma | $29,560 | $22,571 |
| College or Associate's Degree | $29,788 | $30,481 |
| Bachelor's Degree | $22,364 | $40,694 |
| Graduate Degree | $17,978 | $0 |
| Total | $29,042 | $28,445 |
Family Income in Clearlake
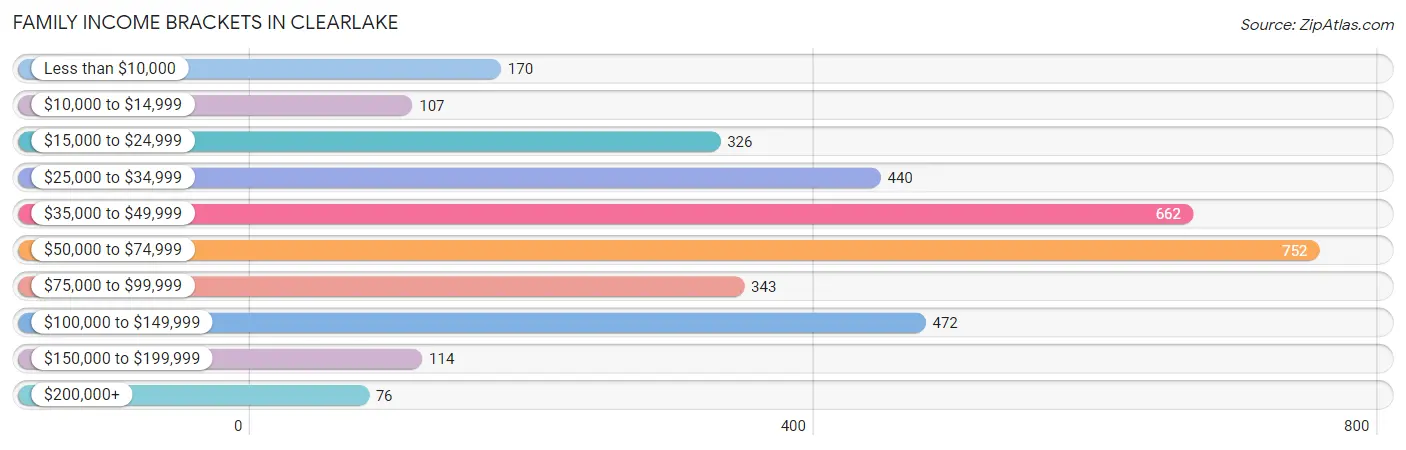
Family Income Brackets in Clearlake
According to the Clearlake family income data, there are 752 families falling into the $50,000 to $74,999 income range, which is the most common income bracket and makes up 21.7% of all families. Conversely, the $200,000+ income bracket is the least frequent group with only 76 families (2.2%) belonging to this category.
| Income Bracket | # Families | % Families |
| Less than $10,000 | 170 | 4.9% |
| $10,000 to $14,999 | 107 | 3.1% |
| $15,000 to $24,999 | 326 | 9.4% |
| $25,000 to $34,999 | 440 | 12.7% |
| $35,000 to $49,999 | 662 | 19.1% |
| $50,000 to $74,999 | 752 | 21.7% |
| $75,000 to $99,999 | 343 | 9.9% |
| $100,000 to $149,999 | 472 | 13.6% |
| $150,000 to $199,999 | 114 | 3.3% |
| $200,000+ | 76 | 2.2% |
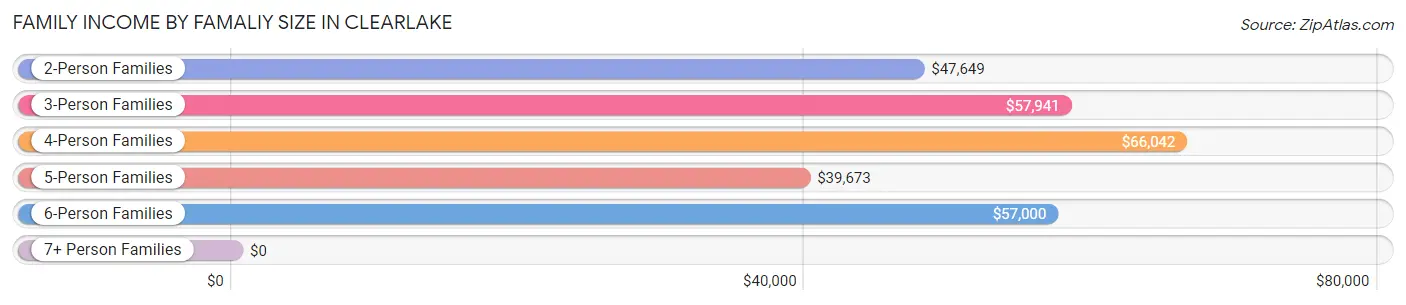
Family Income by Famaliy Size in Clearlake
4-person families (769 | 22.2%) account for the highest median family income in Clearlake with $66,042 per family, while 2-person families (1,467 | 42.3%) have the highest median income of $23,824 per family member.
| Income Bracket | # Families | Median Income |
| 2-Person Families | 1,467 (42.3%) | $47,649 |
| 3-Person Families | 706 (20.4%) | $57,941 |
| 4-Person Families | 769 (22.2%) | $66,042 |
| 5-Person Families | 307 (8.8%) | $39,673 |
| 6-Person Families | 136 (3.9%) | $57,000 |
| 7+ Person Families | 82 (2.4%) | $0 |
| Total | 3,467 (100.0%) | $50,756 |
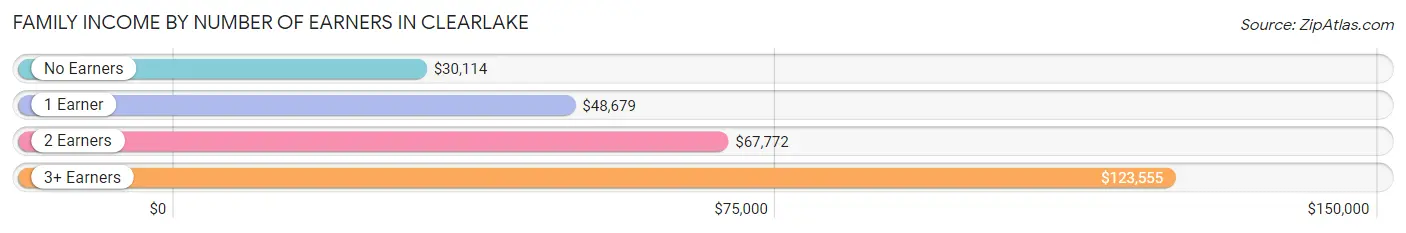
Family Income by Number of Earners in Clearlake
The median family income in Clearlake is $50,756, with families comprising 3+ earners (179) having the highest median family income of $123,555, while families with no earners (732) have the lowest median family income of $30,114, accounting for 5.2% and 21.1% of families, respectively.
| Number of Earners | # Families | Median Income |
| No Earners | 732 (21.1%) | $30,114 |
| 1 Earner | 1,512 (43.6%) | $48,679 |
| 2 Earners | 1,044 (30.1%) | $67,772 |
| 3+ Earners | 179 (5.2%) | $123,555 |
| Total | 3,467 (100.0%) | $50,756 |
Household Income in Clearlake
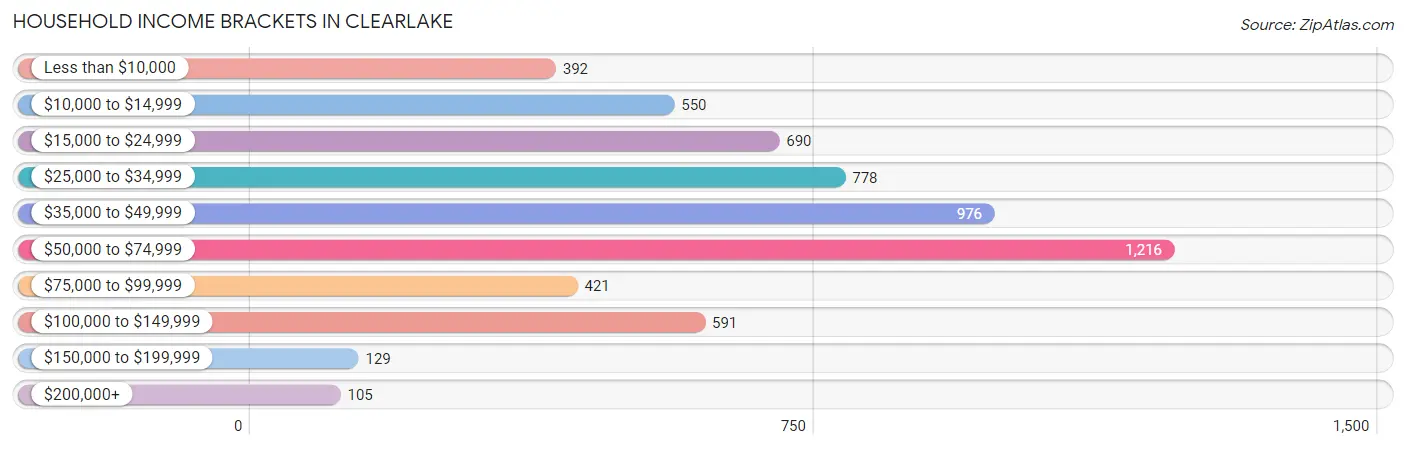
Household Income Brackets in Clearlake
With 1,216 households falling in the category, the $50,000 to $74,999 income range is the most frequent in Clearlake, accounting for 20.8% of all households. In contrast, only 105 households (1.8%) fall into the $200,000+ income bracket, making it the least populous group.
| Income Bracket | # Households | % Households |
| Less than $10,000 | 392 | 6.7% |
| $10,000 to $14,999 | 550 | 9.4% |
| $15,000 to $24,999 | 690 | 11.8% |
| $25,000 to $34,999 | 778 | 13.3% |
| $35,000 to $49,999 | 976 | 16.7% |
| $50,000 to $74,999 | 1,216 | 20.8% |
| $75,000 to $99,999 | 421 | 7.2% |
| $100,000 to $149,999 | 591 | 10.1% |
| $150,000 to $199,999 | 129 | 2.2% |
| $200,000+ | 105 | 1.8% |
Household Income by Householder Age in Clearlake
The median household income in Clearlake is $41,047, with the highest median household income of $42,029 found in the 25 to 44 years age bracket for the primary householder. A total of 1,804 households (30.8%) fall into this category. Meanwhile, the 15 to 24 years age bracket for the primary householder has the lowest median household income of $0, with 93 households (1.6%) in this group.
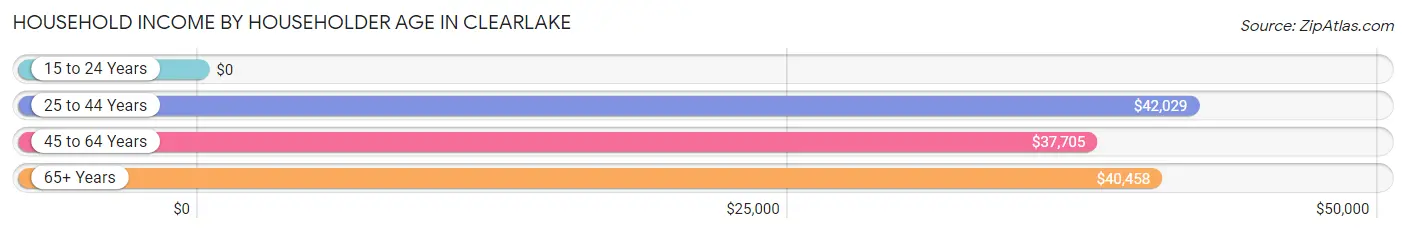
| Income Bracket | # Households | Median Income |
| 15 to 24 Years | 93 (1.6%) | $0 |
| 25 to 44 Years | 1,804 (30.8%) | $42,029 |
| 45 to 64 Years | 1,849 (31.6%) | $37,705 |
| 65+ Years | 2,101 (35.9%) | $40,458 |
| Total | 5,847 (100.0%) | $41,047 |
Poverty in Clearlake
Income Below Poverty by Sex and Age in Clearlake
With 22.0% poverty level for males and 27.2% for females among the residents of Clearlake, 6 to 11 year old males and 12 to 14 year old females are the most vulnerable to poverty, with 358 males (46.6%) and 257 females (60.5%) in their respective age groups living below the poverty level.
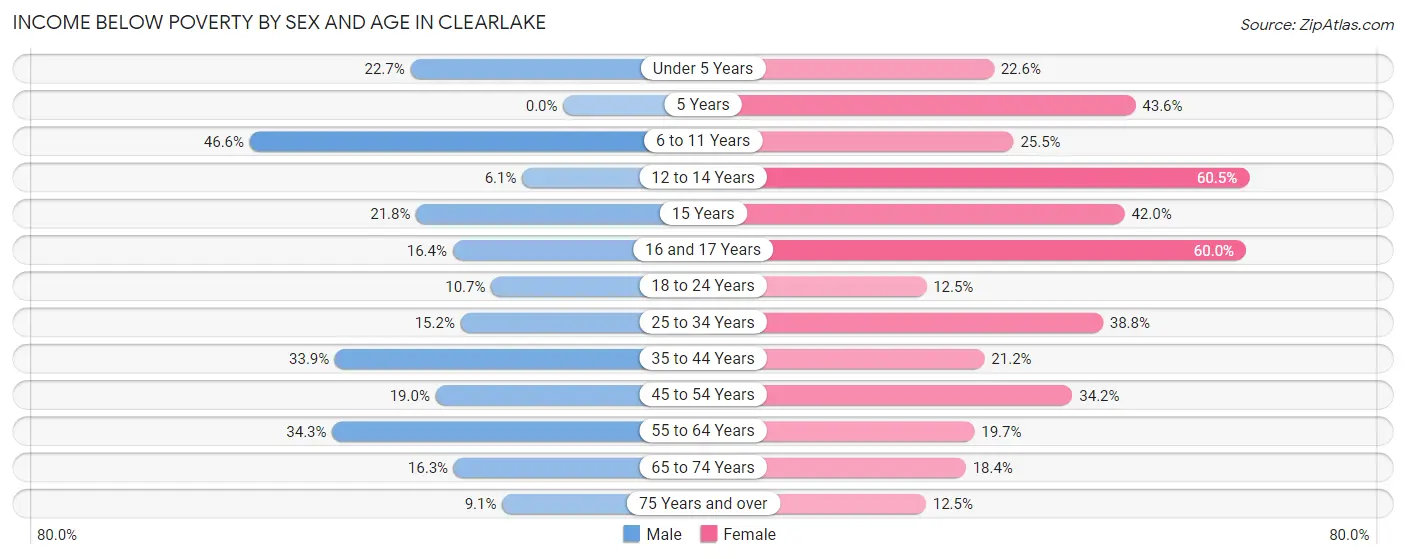
| Age Bracket | Male | Female |
| Under 5 Years | 49 (22.7%) | 148 (22.6%) |
| 5 Years | 0 (0.0%) | 17 (43.6%) |
| 6 to 11 Years | 358 (46.6%) | 168 (25.5%) |
| 12 to 14 Years | 25 (6.1%) | 257 (60.5%) |
| 15 Years | 19 (21.8%) | 102 (42.0%) |
| 16 and 17 Years | 74 (16.4%) | 42 (60.0%) |
| 18 to 24 Years | 52 (10.7%) | 52 (12.5%) |
| 25 to 34 Years | 175 (15.2%) | 448 (38.8%) |
| 35 to 44 Years | 324 (33.9%) | 230 (21.2%) |
| 45 to 54 Years | 212 (19.0%) | 326 (34.2%) |
| 55 to 64 Years | 297 (34.3%) | 216 (19.7%) |
| 65 to 74 Years | 148 (16.3%) | 177 (18.4%) |
| 75 Years and over | 47 (9.1%) | 58 (12.5%) |
| Total | 1,780 (22.0%) | 2,241 (27.2%) |
Income Above Poverty by Sex and Age in Clearlake
According to the poverty statistics in Clearlake, males aged 5 years and females aged 75 years and over are the age groups that are most secure financially, with 100.0% of males and 87.5% of females in these age groups living above the poverty line.
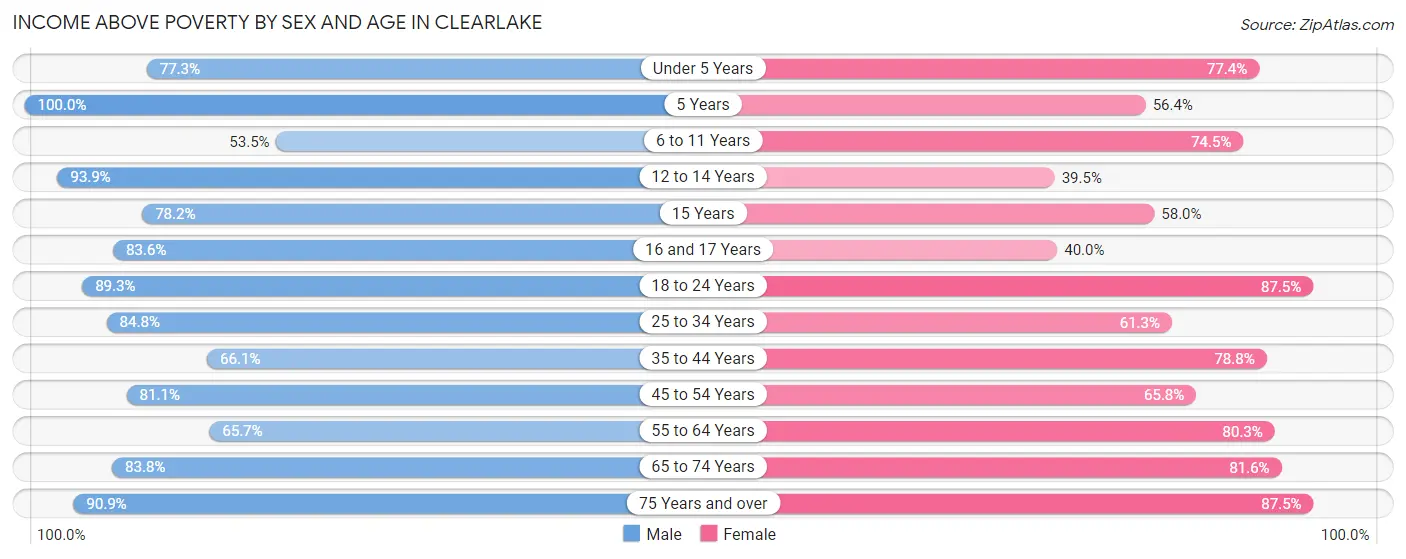
| Age Bracket | Male | Female |
| Under 5 Years | 167 (77.3%) | 508 (77.4%) |
| 5 Years | 144 (100.0%) | 22 (56.4%) |
| 6 to 11 Years | 411 (53.4%) | 491 (74.5%) |
| 12 to 14 Years | 385 (93.9%) | 168 (39.5%) |
| 15 Years | 68 (78.2%) | 141 (58.0%) |
| 16 and 17 Years | 377 (83.6%) | 28 (40.0%) |
| 18 to 24 Years | 434 (89.3%) | 363 (87.5%) |
| 25 to 34 Years | 973 (84.8%) | 708 (61.3%) |
| 35 to 44 Years | 632 (66.1%) | 856 (78.8%) |
| 45 to 54 Years | 907 (81.0%) | 626 (65.8%) |
| 55 to 64 Years | 569 (65.7%) | 882 (80.3%) |
| 65 to 74 Years | 763 (83.8%) | 785 (81.6%) |
| 75 Years and over | 471 (90.9%) | 407 (87.5%) |
| Total | 6,301 (78.0%) | 5,985 (72.8%) |
Income Below Poverty Among Married-Couple Families in Clearlake
The poverty statistics for married-couple families in Clearlake show that 9.3% or 166 of the total 1,790 families live below the poverty line. Families with 3 or 4 children have the highest poverty rate of 41.5%, comprising of 81 families. On the other hand, families with 1 or 2 children have the lowest poverty rate of 4.6%, which includes 23 families.
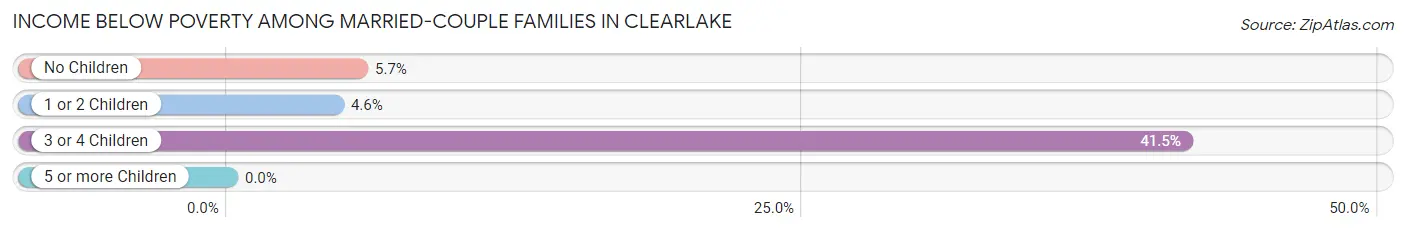
| Children | Above Poverty | Below Poverty |
| No Children | 1,034 (94.3%) | 62 (5.7%) |
| 1 or 2 Children | 476 (95.4%) | 23 (4.6%) |
| 3 or 4 Children | 114 (58.5%) | 81 (41.5%) |
| 5 or more Children | 0 (0.0%) | 0 (0.0%) |
| Total | 1,624 (90.7%) | 166 (9.3%) |
Income Below Poverty Among Single-Parent Households in Clearlake
According to the poverty data in Clearlake, 15.6% or 87 single-father households and 29.7% or 332 single-mother households are living below the poverty line. Among single-father households, those with 1 or 2 children have the highest poverty rate, with 66 households (30.8%) experiencing poverty. Likewise, among single-mother households, those with 5 or more children have the highest poverty rate, with 33 households (61.1%) falling below the poverty line.
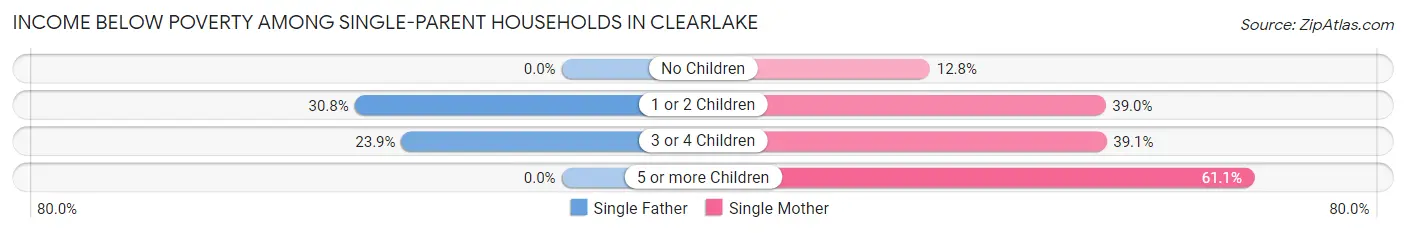
| Children | Single Father | Single Mother |
| No Children | 0 (0.0%) | 57 (12.8%) |
| 1 or 2 Children | 66 (30.8%) | 170 (39.0%) |
| 3 or 4 Children | 21 (23.9%) | 72 (39.1%) |
| 5 or more Children | 0 (0.0%) | 33 (61.1%) |
| Total | 87 (15.6%) | 332 (29.7%) |
Income Below Poverty Among Married-Couple vs Single-Parent Households in Clearlake
The poverty data for Clearlake shows that 166 of the married-couple family households (9.3%) and 419 of the single-parent households (25.0%) are living below the poverty level. Within the married-couple family households, those with 3 or 4 children have the highest poverty rate, with 81 households (41.5%) falling below the poverty line. Among the single-parent households, those with 5 or more children have the highest poverty rate, with 33 household (61.1%) living below poverty.
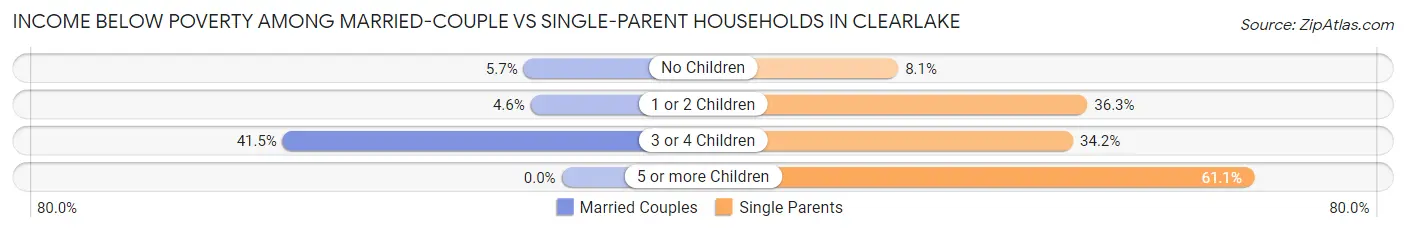
| Children | Married-Couple Families | Single-Parent Households |
| No Children | 62 (5.7%) | 57 (8.1%) |
| 1 or 2 Children | 23 (4.6%) | 236 (36.3%) |
| 3 or 4 Children | 81 (41.5%) | 93 (34.2%) |
| 5 or more Children | 0 (0.0%) | 33 (61.1%) |
| Total | 166 (9.3%) | 419 (25.0%) |
Race in Clearlake
The most populous races in Clearlake are White / Caucasian (10,254 | 61.7%), Hispanic or Latino (5,037 | 30.3%), and Some other Race (2,743 | 16.5%).
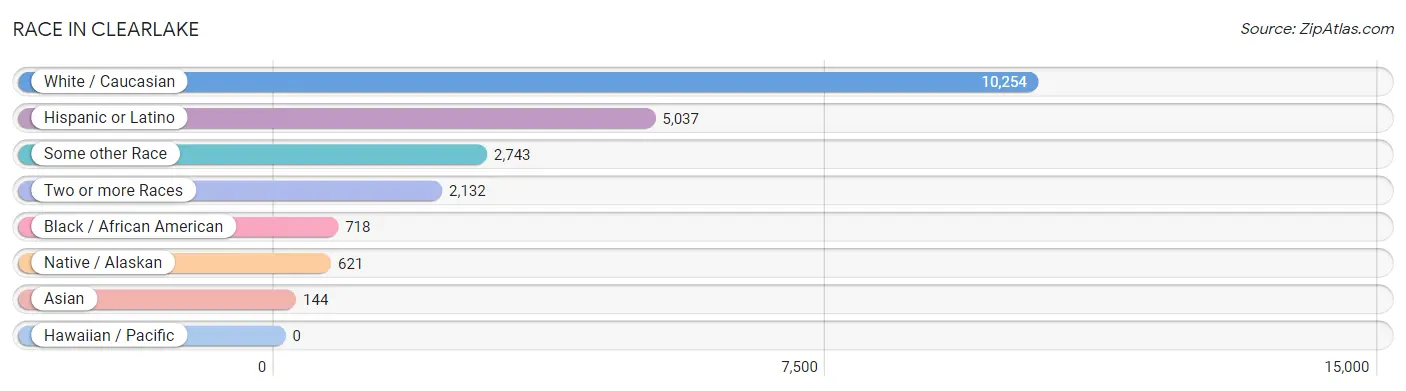
| Race | # Population | % Population |
| Asian | 144 | 0.9% |
| Black / African American | 718 | 4.3% |
| Hawaiian / Pacific | 0 | 0.0% |
| Hispanic or Latino | 5,037 | 30.3% |
| Native / Alaskan | 621 | 3.7% |
| White / Caucasian | 10,254 | 61.7% |
| Two or more Races | 2,132 | 12.8% |
| Some other Race | 2,743 | 16.5% |
| Total | 16,612 | 100.0% |
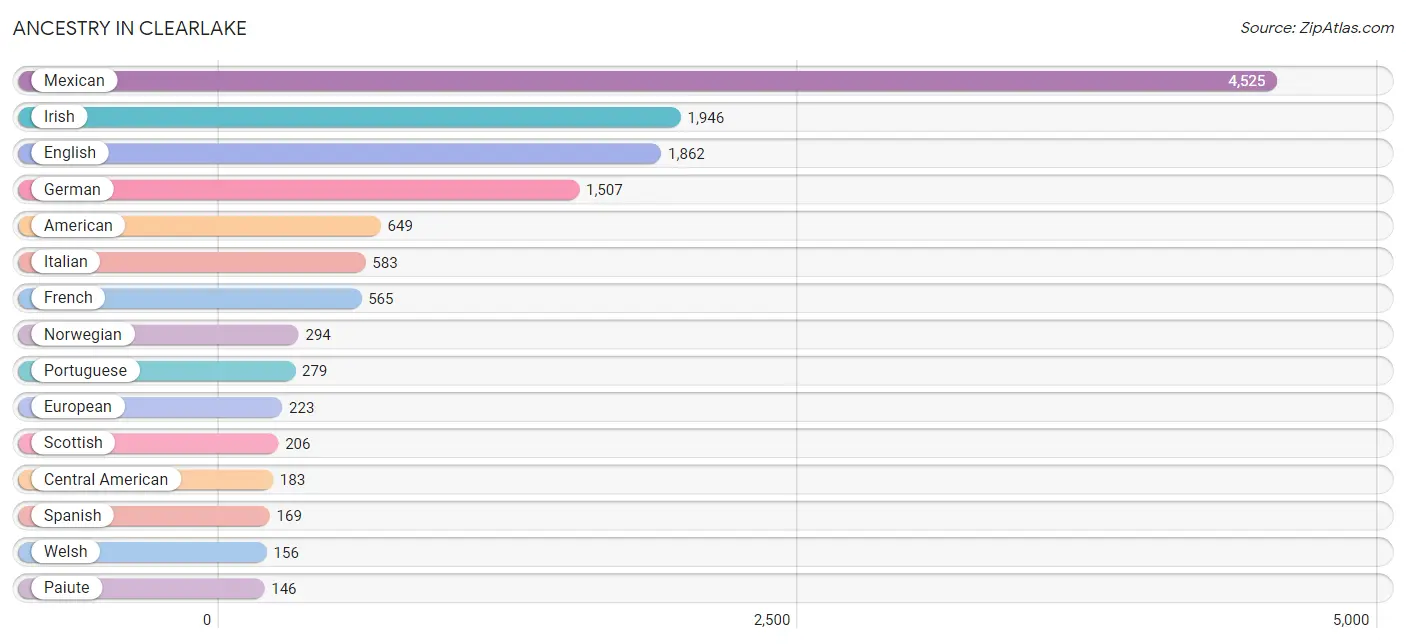
Ancestry in Clearlake
The most populous ancestries reported in Clearlake are Mexican (4,525 | 27.2%), Irish (1,946 | 11.7%), English (1,862 | 11.2%), German (1,507 | 9.1%), and American (649 | 3.9%), together accounting for 63.1% of all Clearlake residents.
| Ancestry | # Population | % Population |
| African | 98 | 0.6% |
| American | 649 | 3.9% |
| Apache | 25 | 0.2% |
| Arab | 104 | 0.6% |
| Austrian | 7 | 0.0% |
| Basque | 23 | 0.1% |
| Bhutanese | 19 | 0.1% |
| Blackfeet | 11 | 0.1% |
| British | 107 | 0.6% |
| Central American | 183 | 1.1% |
| Central American Indian | 15 | 0.1% |
| Cherokee | 101 | 0.6% |
| Chickasaw | 21 | 0.1% |
| Choctaw | 60 | 0.4% |
| Colombian | 7 | 0.0% |
| Creek | 15 | 0.1% |
| Croatian | 12 | 0.1% |
| Cuban | 60 | 0.4% |
| Danish | 56 | 0.3% |
| Dutch | 78 | 0.5% |
| Dutch West Indian | 70 | 0.4% |
| English | 1,862 | 11.2% |
| European | 223 | 1.3% |
| Finnish | 9 | 0.1% |
| French | 565 | 3.4% |
| French Canadian | 71 | 0.4% |
| German | 1,507 | 9.1% |
| Greek | 9 | 0.1% |
| Guatemalan | 41 | 0.3% |
| Haitian | 27 | 0.2% |
| Hungarian | 29 | 0.2% |
| Icelander | 25 | 0.2% |
| Indian (Asian) | 137 | 0.8% |
| Inupiat | 9 | 0.1% |
| Iranian | 39 | 0.2% |
| Irish | 1,946 | 11.7% |
| Italian | 583 | 3.5% |
| Jamaican | 8 | 0.1% |
| Korean | 96 | 0.6% |
| Lithuanian | 7 | 0.0% |
| Mexican | 4,525 | 27.2% |
| Mexican American Indian | 130 | 0.8% |
| Native Hawaiian | 32 | 0.2% |
| Navajo | 42 | 0.3% |
| Nicaraguan | 107 | 0.6% |
| Northern European | 10 | 0.1% |
| Norwegian | 294 | 1.8% |
| Paiute | 146 | 0.9% |
| Peruvian | 17 | 0.1% |
| Polish | 90 | 0.5% |
| Portuguese | 279 | 1.7% |
| Russian | 82 | 0.5% |
| Salvadoran | 35 | 0.2% |
| Scandinavian | 72 | 0.4% |
| Scotch-Irish | 52 | 0.3% |
| Scottish | 206 | 1.2% |
| Seminole | 13 | 0.1% |
| Sioux | 109 | 0.7% |
| South American | 24 | 0.1% |
| Spaniard | 50 | 0.3% |
| Spanish | 169 | 1.0% |
| Sri Lankan | 30 | 0.2% |
| Subsaharan African | 98 | 0.6% |
| Swedish | 47 | 0.3% |
| Swiss | 8 | 0.1% |
| Syrian | 78 | 0.5% |
| Thai | 23 | 0.1% |
| Tongan | 45 | 0.3% |
| Welsh | 156 | 0.9% | View All 69 Rows |
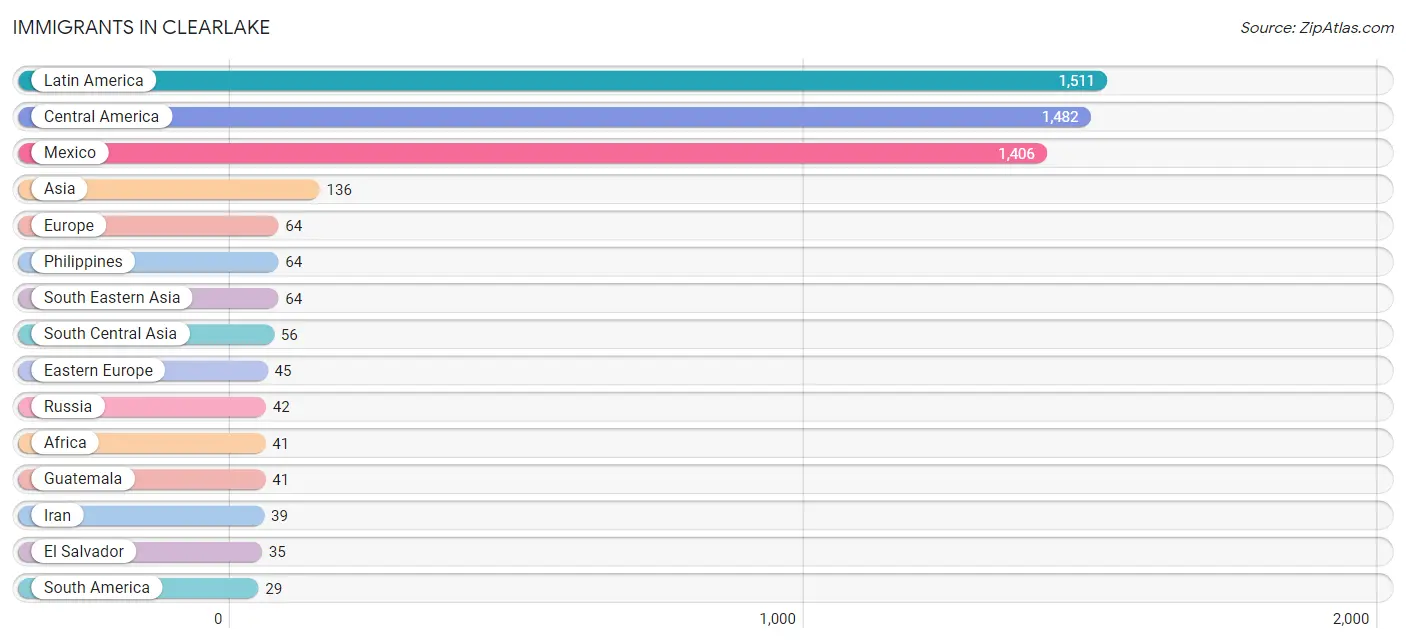
Immigrants in Clearlake
The most numerous immigrant groups reported in Clearlake came from Latin America (1,511 | 9.1%), Central America (1,482 | 8.9%), Mexico (1,406 | 8.5%), Asia (136 | 0.8%), and Europe (64 | 0.4%), together accounting for 27.7% of all Clearlake residents.
| Immigration Origin | # Population | % Population |
| Africa | 41 | 0.3% |
| Asia | 136 | 0.8% |
| Canada | 20 | 0.1% |
| Central America | 1,482 | 8.9% |
| China | 16 | 0.1% |
| Croatia | 3 | 0.0% |
| Eastern Asia | 16 | 0.1% |
| Eastern Europe | 45 | 0.3% |
| El Salvador | 35 | 0.2% |
| England | 10 | 0.1% |
| Europe | 64 | 0.4% |
| France | 9 | 0.1% |
| Guatemala | 41 | 0.3% |
| India | 17 | 0.1% |
| Iran | 39 | 0.2% |
| Latin America | 1,511 | 9.1% |
| Mexico | 1,406 | 8.5% |
| Northern Europe | 10 | 0.1% |
| Oceania | 8 | 0.1% |
| Peru | 10 | 0.1% |
| Philippines | 64 | 0.4% |
| Russia | 42 | 0.3% |
| South America | 29 | 0.2% |
| South Central Asia | 56 | 0.3% |
| South Eastern Asia | 64 | 0.4% |
| Western Europe | 9 | 0.1% | View All 26 Rows |
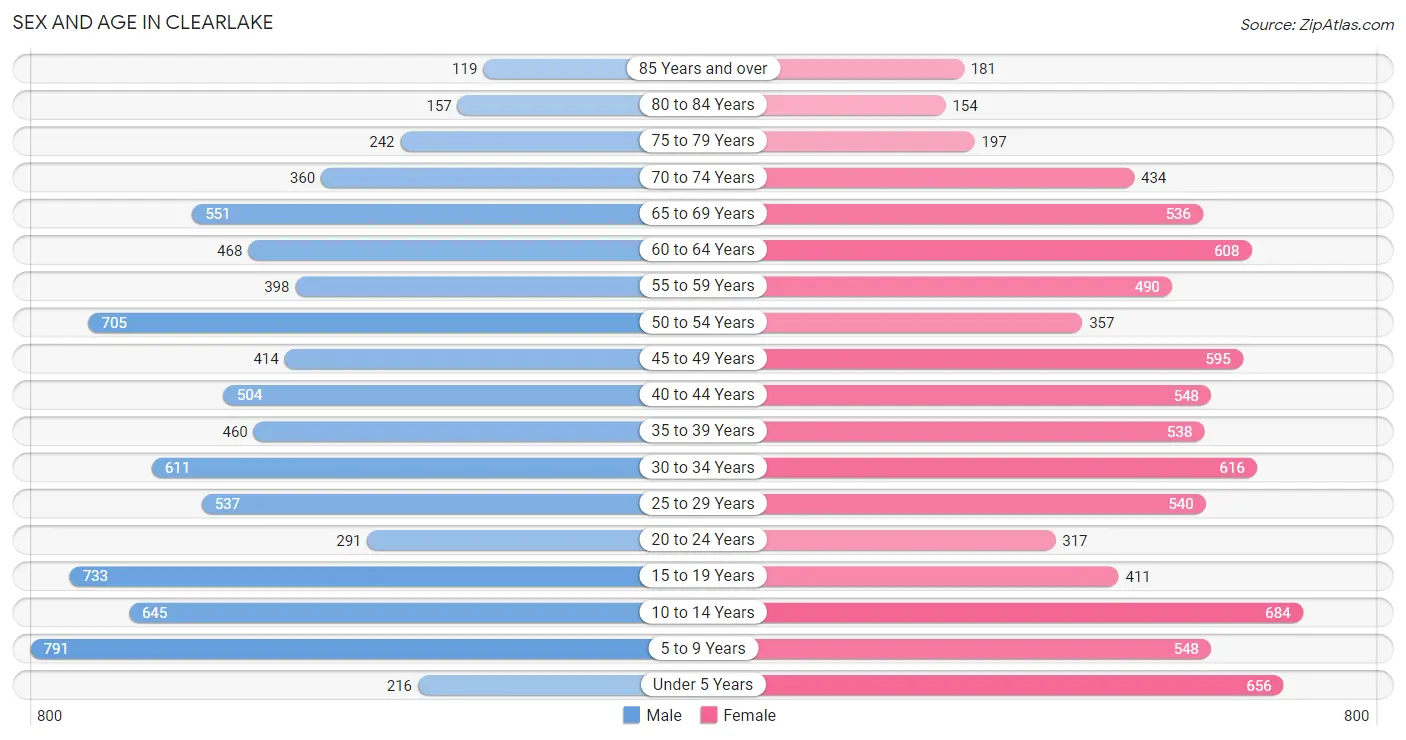
Sex and Age in Clearlake
Sex and Age in Clearlake
The most populous age groups in Clearlake are 5 to 9 Years (791 | 9.6%) for men and 10 to 14 Years (684 | 8.1%) for women.
| Age Bracket | Male | Female |
| Under 5 Years | 216 (2.6%) | 656 (7.8%) |
| 5 to 9 Years | 791 (9.6%) | 548 (6.5%) |
| 10 to 14 Years | 645 (7.9%) | 684 (8.1%) |
| 15 to 19 Years | 733 (8.9%) | 411 (4.9%) |
| 20 to 24 Years | 291 (3.5%) | 317 (3.8%) |
| 25 to 29 Years | 537 (6.6%) | 540 (6.4%) |
| 30 to 34 Years | 611 (7.4%) | 616 (7.3%) |
| 35 to 39 Years | 460 (5.6%) | 538 (6.4%) |
| 40 to 44 Years | 504 (6.1%) | 548 (6.5%) |
| 45 to 49 Years | 414 (5.1%) | 595 (7.1%) |
| 50 to 54 Years | 705 (8.6%) | 357 (4.2%) |
| 55 to 59 Years | 398 (4.9%) | 490 (5.8%) |
| 60 to 64 Years | 468 (5.7%) | 608 (7.2%) |
| 65 to 69 Years | 551 (6.7%) | 536 (6.4%) |
| 70 to 74 Years | 360 (4.4%) | 434 (5.2%) |
| 75 to 79 Years | 242 (2.9%) | 197 (2.3%) |
| 80 to 84 Years | 157 (1.9%) | 154 (1.8%) |
| 85 Years and over | 119 (1.5%) | 181 (2.1%) |
| Total | 8,202 (100.0%) | 8,410 (100.0%) |
Families and Households in Clearlake
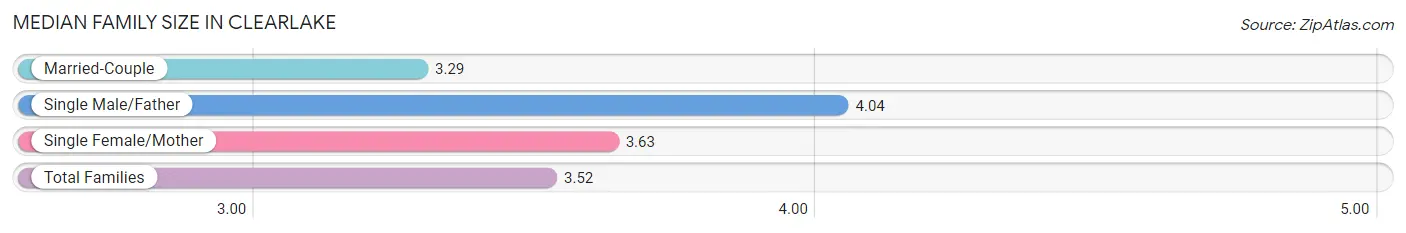
Median Family Size in Clearlake
The median family size in Clearlake is 3.52 persons per family, with single male/father families (559 | 16.1%) accounting for the largest median family size of 4.04 persons per family. On the other hand, married-couple families (1,790 | 51.6%) represent the smallest median family size with 3.29 persons per family.
| Family Type | # Families | Family Size |
| Married-Couple | 1,790 (51.6%) | 3.29 |
| Single Male/Father | 559 (16.1%) | 4.04 |
| Single Female/Mother | 1,118 (32.3%) | 3.63 |
| Total Families | 3,467 (100.0%) | 3.52 |
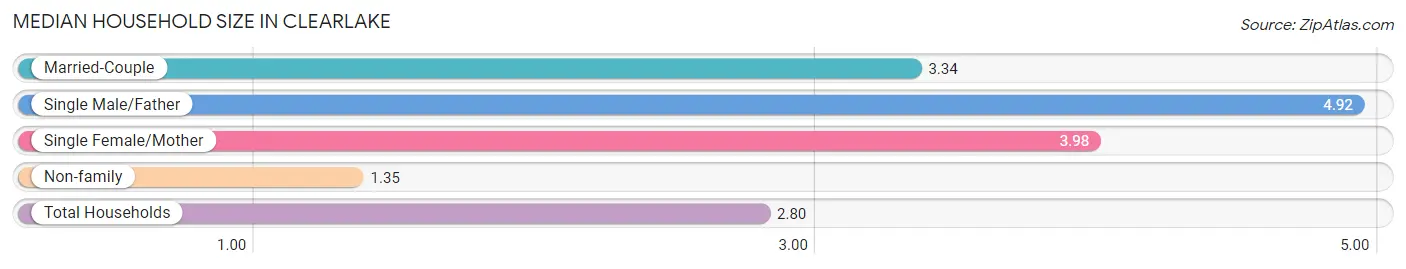
Median Household Size in Clearlake
The median household size in Clearlake is 2.80 persons per household, with single male/father households (559 | 9.6%) accounting for the largest median household size of 4.92 persons per household. non-family households (2,380 | 40.7%) represent the smallest median household size with 1.35 persons per household.
| Household Type | # Households | Household Size |
| Married-Couple | 1,790 (30.6%) | 3.34 |
| Single Male/Father | 559 (9.6%) | 4.92 |
| Single Female/Mother | 1,118 (19.1%) | 3.98 |
| Non-family | 2,380 (40.7%) | 1.35 |
| Total Households | 5,847 (100.0%) | 2.80 |
Household Size by Marriage Status in Clearlake
Out of a total of 5,847 households in Clearlake, 3,467 (59.3%) are family households, while 2,380 (40.7%) are nonfamily households. The most numerous type of family households are 2-person households, comprising 1,277, and the most common type of nonfamily households are 1-person households, comprising 1,779.
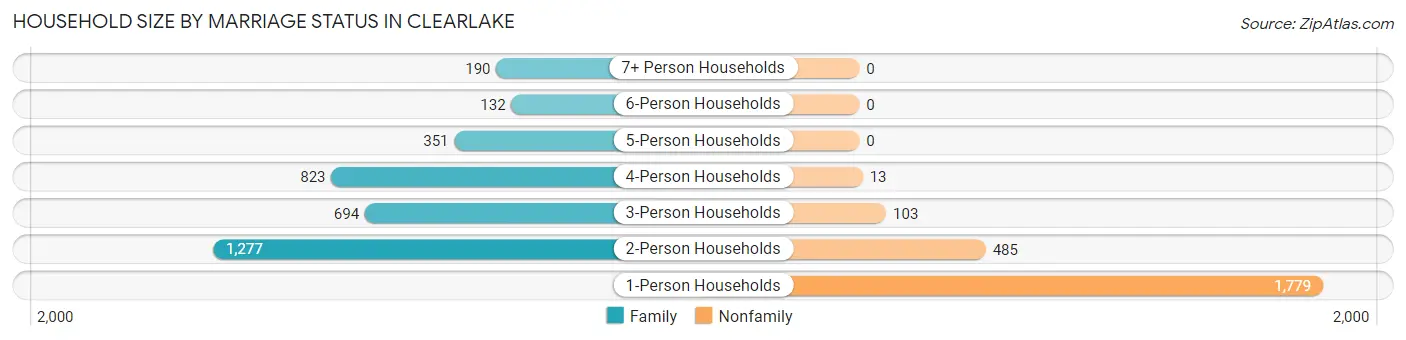
| Household Size | Family Households | Nonfamily Households |
| 1-Person Households | - | 1,779 (30.4%) |
| 2-Person Households | 1,277 (21.8%) | 485 (8.3%) |
| 3-Person Households | 694 (11.9%) | 103 (1.8%) |
| 4-Person Households | 823 (14.1%) | 13 (0.2%) |
| 5-Person Households | 351 (6.0%) | 0 (0.0%) |
| 6-Person Households | 132 (2.3%) | 0 (0.0%) |
| 7+ Person Households | 190 (3.3%) | 0 (0.0%) |
| Total | 3,467 (59.3%) | 2,380 (40.7%) |
Female Fertility in Clearlake
Fertility by Age in Clearlake
Average fertility rate in Clearlake is 53.0 births per 1,000 women. Women in the age bracket of 20 to 34 years have the highest fertility rate with 70.0 births per 1,000 women. Women in the age bracket of 20 to 34 years acount for 53.4% of all women with births.
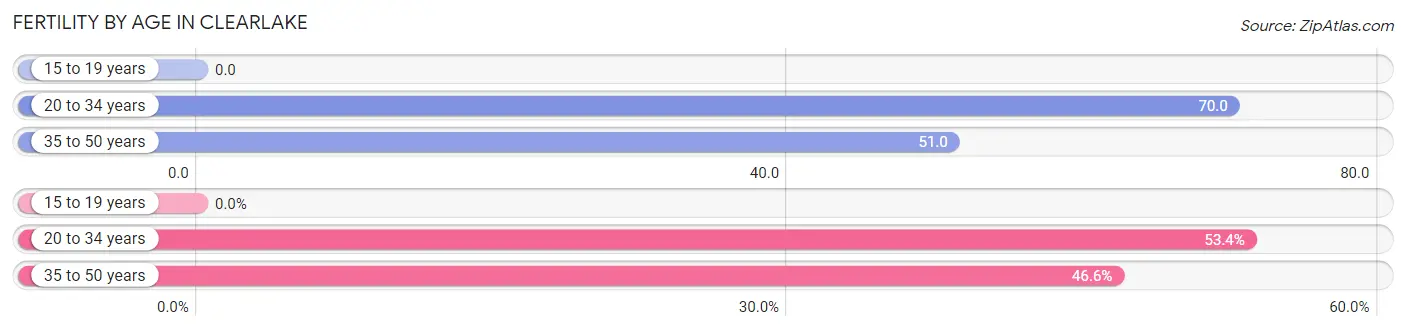
| Age Bracket | Women with Births | Births / 1,000 Women |
| 15 to 19 years | 0 (0.0%) | 0.0 |
| 20 to 34 years | 103 (53.4%) | 70.0 |
| 35 to 50 years | 90 (46.6%) | 51.0 |
| Total | 193 (100.0%) | 53.0 |
Fertility by Age by Marriage Status in Clearlake
16.6% of women with births (193) in Clearlake are married. The highest percentage of unmarried women with births falls into 35 to 50 years age bracket with 100.0% of them unmarried at the time of birth, while the lowest percentage of unmarried women with births belong to 20 to 34 years age bracket with 68.9% of them unmarried.
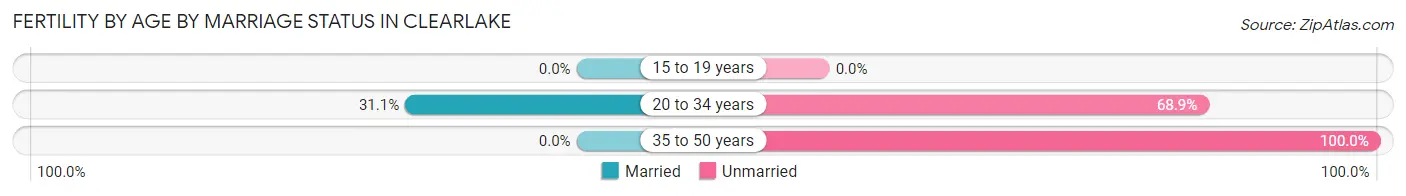
| Age Bracket | Married | Unmarried |
| 15 to 19 years | 0 (0.0%) | 0 (0.0%) |
| 20 to 34 years | 32 (31.1%) | 71 (68.9%) |
| 35 to 50 years | 0 (0.0%) | 90 (100.0%) |
| Total | 32 (16.6%) | 161 (83.4%) |
Fertility by Education in Clearlake
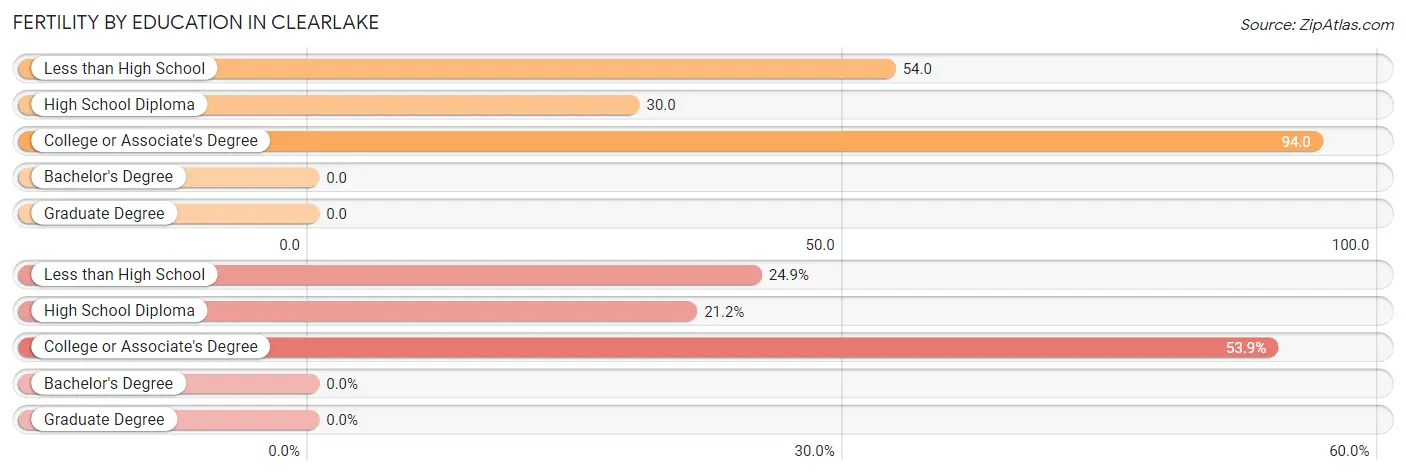
| Educational Attainment | Women with Births | Births / 1,000 Women |
| Less than High School | 48 (24.9%) | 54.0 |
| High School Diploma | 41 (21.2%) | 30.0 |
| College or Associate's Degree | 104 (53.9%) | 94.0 |
| Bachelor's Degree | 0 (0.0%) | 0.0 |
| Graduate Degree | 0 (0.0%) | 0.0 |
| Total | 193 (100.0%) | 53.0 |
Fertility by Education by Marriage Status in Clearlake
83.4% of women with births in Clearlake are unmarried. Women with the educational attainment of college or associate's degree are most likely to be married with 30.8% of them married at childbirth, while women with the educational attainment of less than high school are least likely to be married with 100.0% of them unmarried at childbirth.
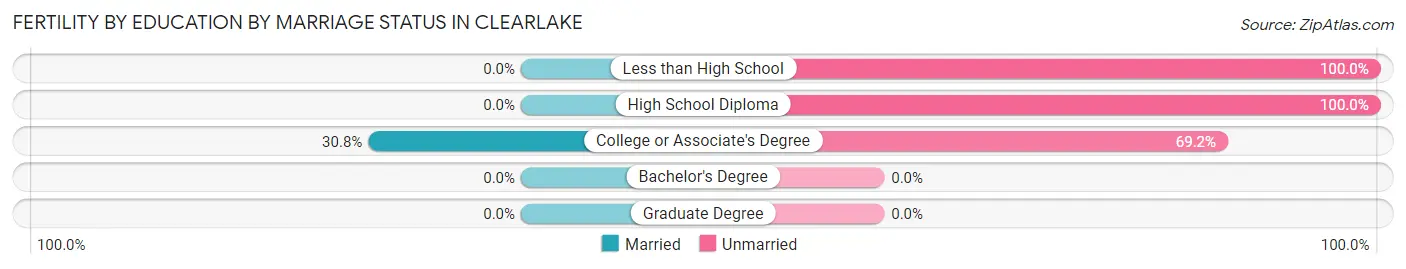
| Educational Attainment | Married | Unmarried |
| Less than High School | 0 (0.0%) | 48 (100.0%) |
| High School Diploma | 0 (0.0%) | 41 (100.0%) |
| College or Associate's Degree | 32 (30.8%) | 72 (69.2%) |
| Bachelor's Degree | 0 (0.0%) | 0 (0.0%) |
| Graduate Degree | 0 (0.0%) | 0 (0.0%) |
| Total | 32 (16.6%) | 161 (83.4%) |
Employment Characteristics in Clearlake
Employment by Class of Employer in Clearlake
Among the 4,944 employed individuals in Clearlake, private company employees (3,108 | 62.9%), state government employees (586 | 11.8%), and local government employees (515 | 10.4%) make up the most common classes of employment.
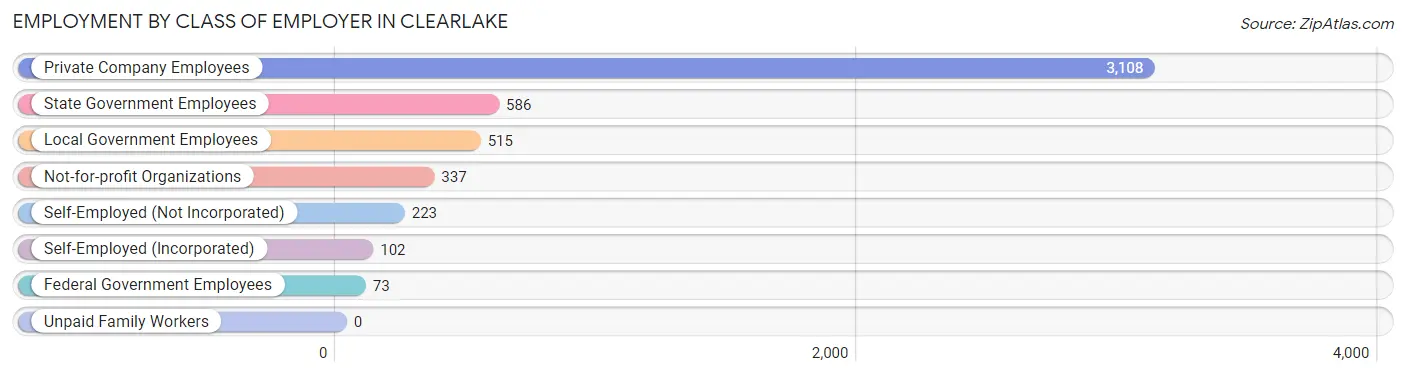
| Employer Class | # Employees | % Employees |
| Private Company Employees | 3,108 | 62.9% |
| Self-Employed (Incorporated) | 102 | 2.1% |
| Self-Employed (Not Incorporated) | 223 | 4.5% |
| Not-for-profit Organizations | 337 | 6.8% |
| Local Government Employees | 515 | 10.4% |
| State Government Employees | 586 | 11.8% |
| Federal Government Employees | 73 | 1.5% |
| Unpaid Family Workers | 0 | 0.0% |
| Total | 4,944 | 100.0% |
Employment Status by Age in Clearlake
According to the labor force statistics for Clearlake, out of the total population over 16 years of age (12,742), 48.2% or 6,142 individuals are in the labor force, with 16.7% or 1,026 of them unemployed. The age group with the highest labor force participation rate is 30 to 34 years, with 79.1% or 971 individuals in the labor force. Within the labor force, the 16 to 19 years age range has the highest percentage of unemployed individuals, with 45.0% or 72 of them being unemployed.
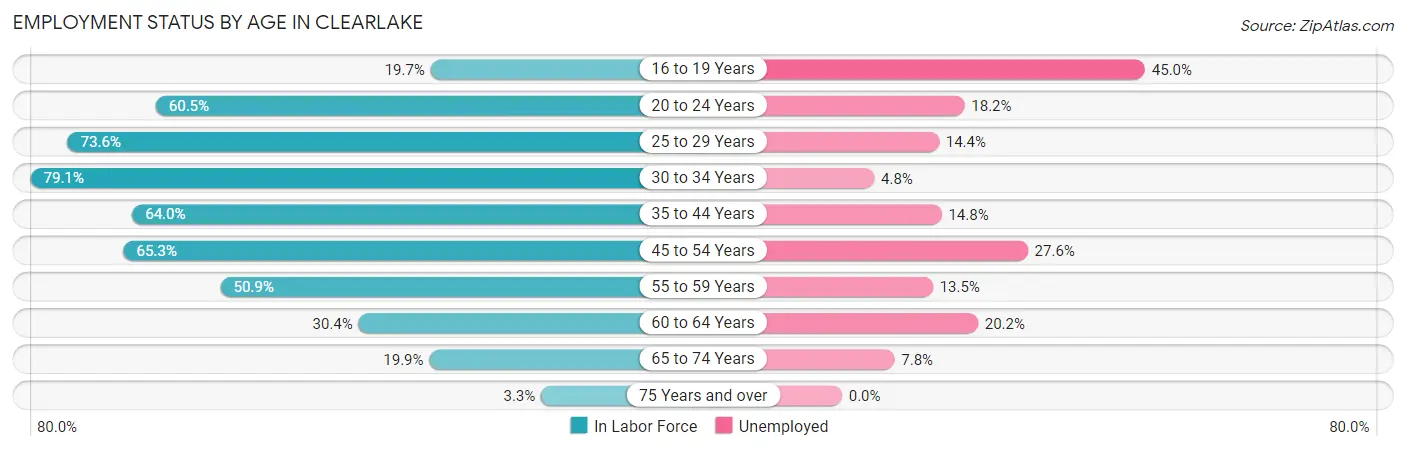
| Age Bracket | In Labor Force | Unemployed |
| 16 to 19 Years | 160 (19.7%) | 72 (45.0%) |
| 20 to 24 Years | 368 (60.5%) | 67 (18.2%) |
| 25 to 29 Years | 793 (73.6%) | 114 (14.4%) |
| 30 to 34 Years | 971 (79.1%) | 47 (4.8%) |
| 35 to 44 Years | 1,312 (64.0%) | 194 (14.8%) |
| 45 to 54 Years | 1,352 (65.3%) | 373 (27.6%) |
| 55 to 59 Years | 452 (50.9%) | 61 (13.5%) |
| 60 to 64 Years | 327 (30.4%) | 66 (20.2%) |
| 65 to 74 Years | 374 (19.9%) | 29 (7.8%) |
| 75 Years and over | 35 (3.3%) | 0 (0.0%) |
| Total | 6,142 (48.2%) | 1,026 (16.7%) |
Employment Status by Educational Attainment in Clearlake
According to labor force statistics for Clearlake, 62.1% of individuals (5,210) out of the total population between 25 and 64 years of age (8,389) are in the labor force, with 16.4% or 854 of them being unemployed. The group with the highest labor force participation rate are those with the educational attainment of bachelor's degree or higher, with 75.4% or 433 individuals in the labor force. Within the labor force, individuals with less than high school education have the highest percentage of unemployment, with 23.8% or 247 of them being unemployed.
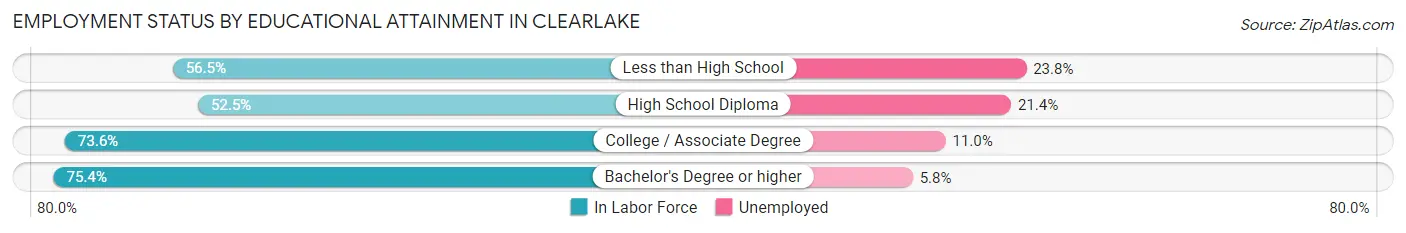
| Educational Attainment | In Labor Force | Unemployed |
| Less than High School | 1,038 (56.5%) | 437 (23.8%) |
| High School Diploma | 1,656 (52.5%) | 675 (21.4%) |
| College / Associate Degree | 2,078 (73.6%) | 311 (11.0%) |
| Bachelor's Degree or higher | 433 (75.4%) | 33 (5.8%) |
| Total | 5,210 (62.1%) | 1,376 (16.4%) |
Employment Occupations by Sex in Clearlake
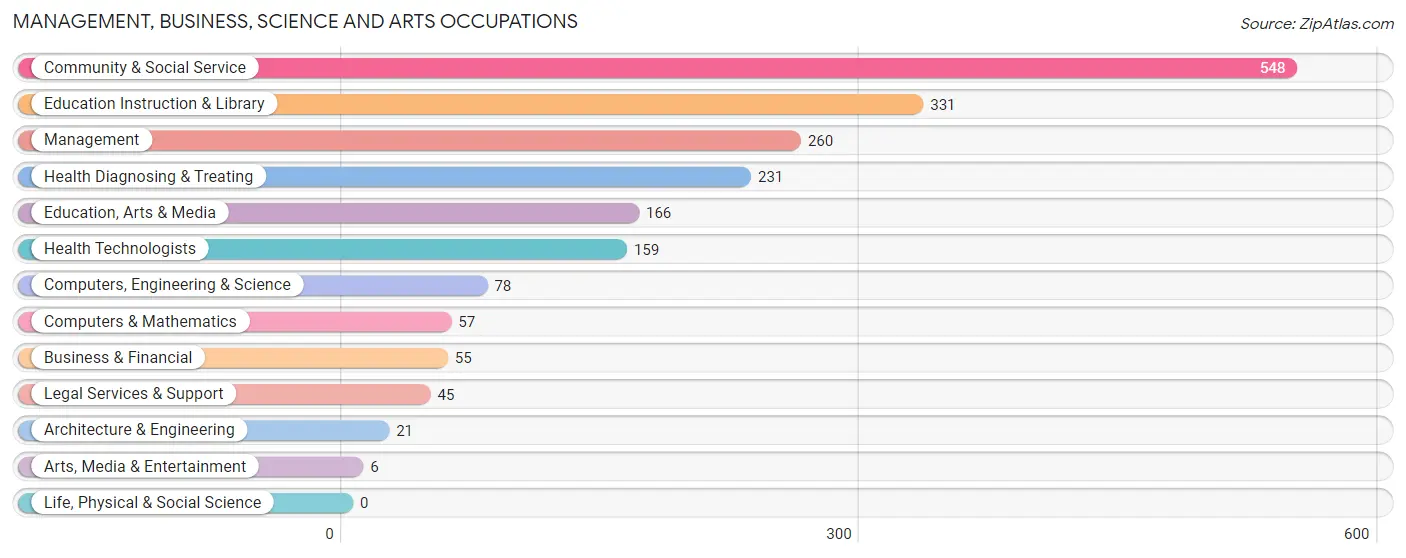
Management, Business, Science and Arts Occupations
The most common Management, Business, Science and Arts occupations in Clearlake are Community & Social Service (548 | 10.7%), Education Instruction & Library (331 | 6.5%), Management (260 | 5.1%), Health Diagnosing & Treating (231 | 4.5%), and Education, Arts & Media (166 | 3.2%).
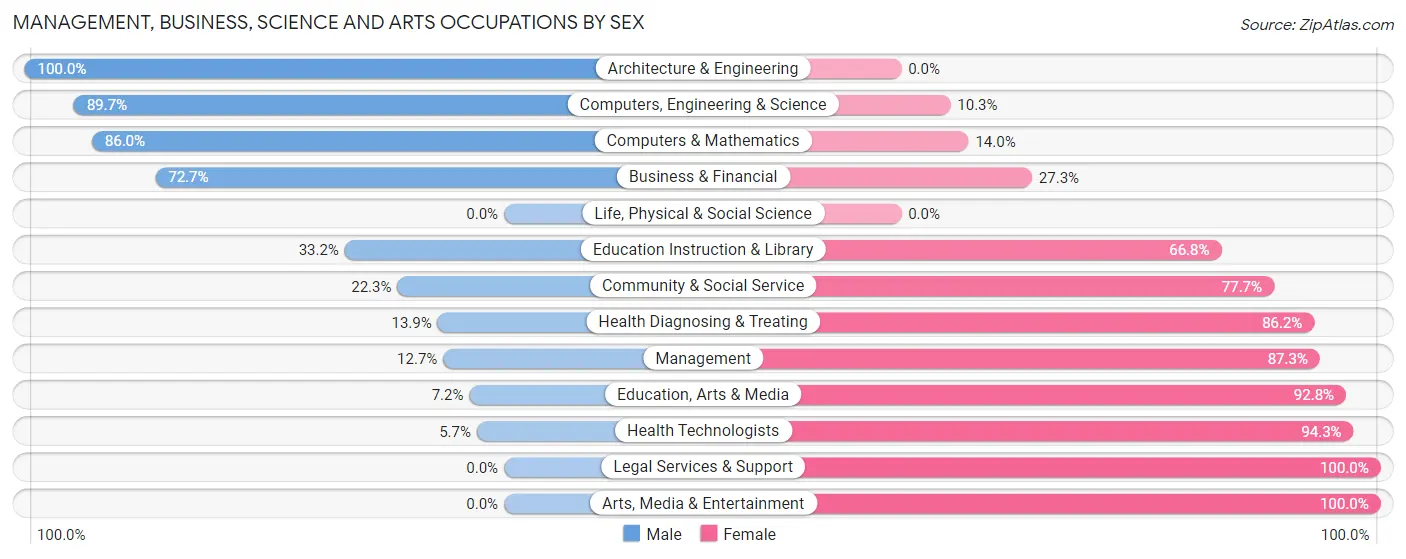
Management, Business, Science and Arts Occupations by Sex
Within the Management, Business, Science and Arts occupations in Clearlake, the most male-oriented occupations are Architecture & Engineering (100.0%), Computers, Engineering & Science (89.7%), and Computers & Mathematics (86.0%), while the most female-oriented occupations are Legal Services & Support (100.0%), Arts, Media & Entertainment (100.0%), and Health Technologists (94.3%).
| Occupation | Male | Female |
| Management | 33 (12.7%) | 227 (87.3%) |
| Business & Financial | 40 (72.7%) | 15 (27.3%) |
| Computers, Engineering & Science | 70 (89.7%) | 8 (10.3%) |
| Computers & Mathematics | 49 (86.0%) | 8 (14.0%) |
| Architecture & Engineering | 21 (100.0%) | 0 (0.0%) |
| Life, Physical & Social Science | 0 (0.0%) | 0 (0.0%) |
| Community & Social Service | 122 (22.3%) | 426 (77.7%) |
| Education, Arts & Media | 12 (7.2%) | 154 (92.8%) |
| Legal Services & Support | 0 (0.0%) | 45 (100.0%) |
| Education Instruction & Library | 110 (33.2%) | 221 (66.8%) |
| Arts, Media & Entertainment | 0 (0.0%) | 6 (100.0%) |
| Health Diagnosing & Treating | 32 (13.9%) | 199 (86.2%) |
| Health Technologists | 9 (5.7%) | 150 (94.3%) |
| Total (Category) | 297 (25.3%) | 875 (74.7%) |
| Total (Overall) | 2,397 (46.8%) | 2,723 (53.2%) |
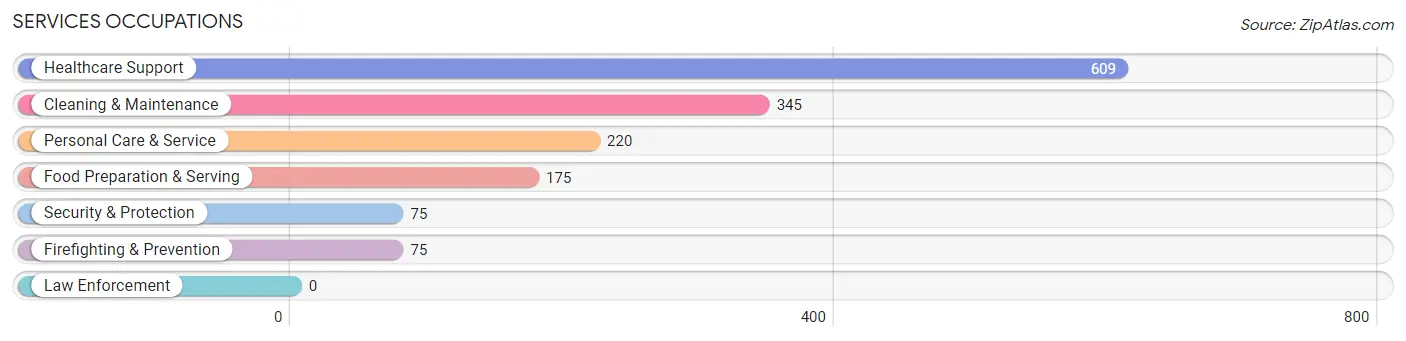
Services Occupations
The most common Services occupations in Clearlake are Healthcare Support (609 | 11.9%), Cleaning & Maintenance (345 | 6.7%), Personal Care & Service (220 | 4.3%), Food Preparation & Serving (175 | 3.4%), and Security & Protection (75 | 1.5%).
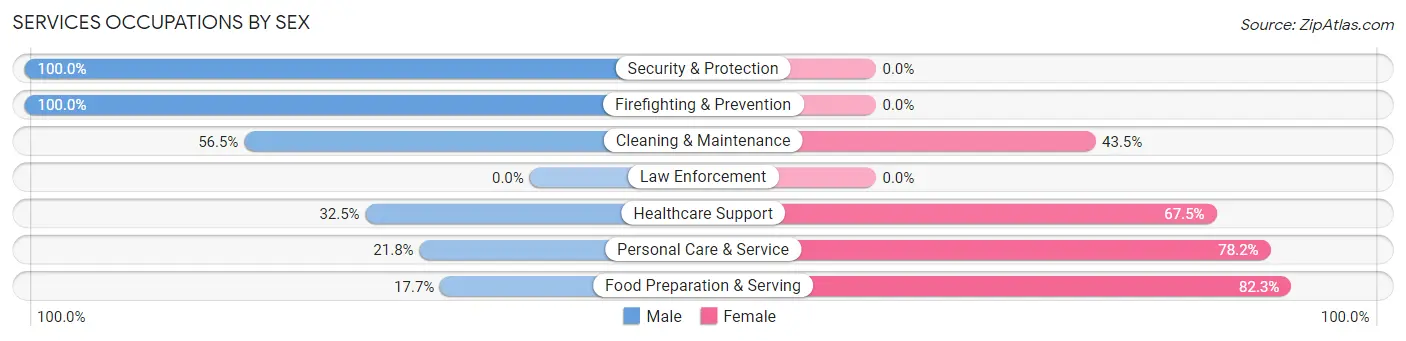
Services Occupations by Sex
Within the Services occupations in Clearlake, the most male-oriented occupations are Security & Protection (100.0%), Firefighting & Prevention (100.0%), and Cleaning & Maintenance (56.5%), while the most female-oriented occupations are Food Preparation & Serving (82.3%), Personal Care & Service (78.2%), and Healthcare Support (67.5%).
| Occupation | Male | Female |
| Healthcare Support | 198 (32.5%) | 411 (67.5%) |
| Security & Protection | 75 (100.0%) | 0 (0.0%) |
| Firefighting & Prevention | 75 (100.0%) | 0 (0.0%) |
| Law Enforcement | 0 (0.0%) | 0 (0.0%) |
| Food Preparation & Serving | 31 (17.7%) | 144 (82.3%) |
| Cleaning & Maintenance | 195 (56.5%) | 150 (43.5%) |
| Personal Care & Service | 48 (21.8%) | 172 (78.2%) |
| Total (Category) | 547 (38.4%) | 877 (61.6%) |
| Total (Overall) | 2,397 (46.8%) | 2,723 (53.2%) |
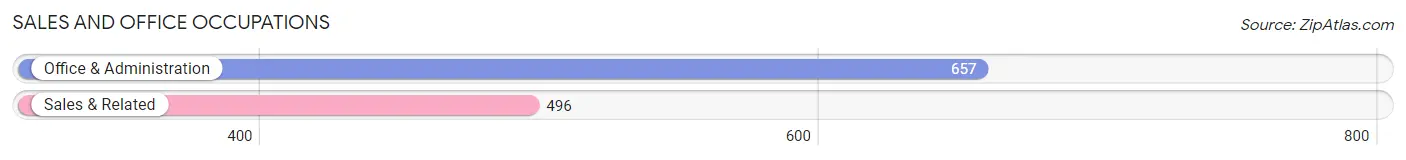
Sales and Office Occupations
The most common Sales and Office occupations in Clearlake are Office & Administration (657 | 12.8%), and Sales & Related (496 | 9.7%).
Sales and Office Occupations by Sex
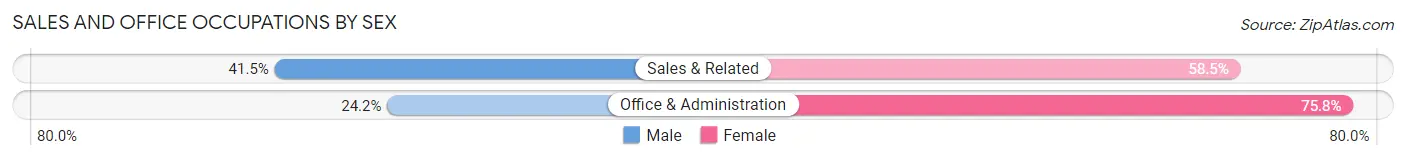
| Occupation | Male | Female |
| Sales & Related | 206 (41.5%) | 290 (58.5%) |
| Office & Administration | 159 (24.2%) | 498 (75.8%) |
| Total (Category) | 365 (31.7%) | 788 (68.3%) |
| Total (Overall) | 2,397 (46.8%) | 2,723 (53.2%) |
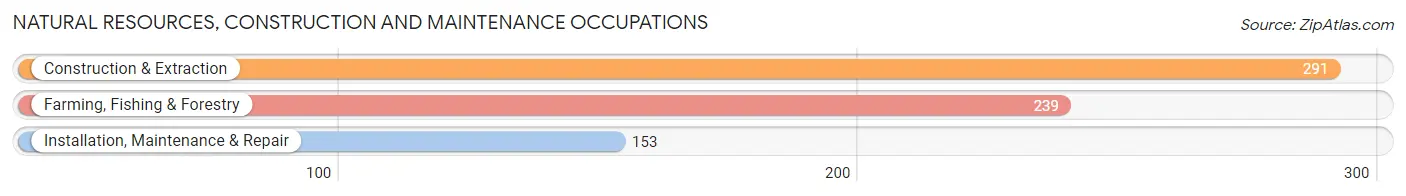
Natural Resources, Construction and Maintenance Occupations
The most common Natural Resources, Construction and Maintenance occupations in Clearlake are Construction & Extraction (291 | 5.7%), Farming, Fishing & Forestry (239 | 4.7%), and Installation, Maintenance & Repair (153 | 3.0%).
Natural Resources, Construction and Maintenance Occupations by Sex
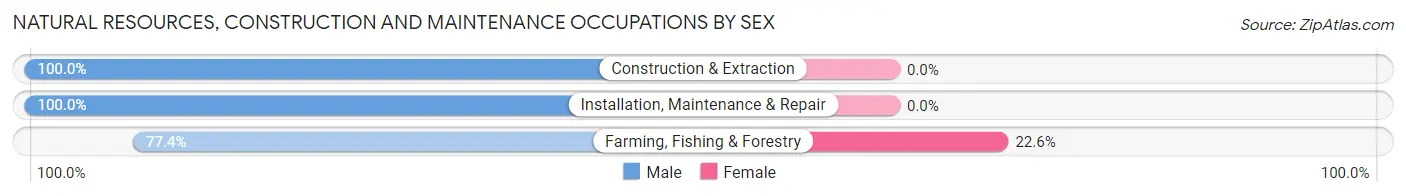
| Occupation | Male | Female |
| Farming, Fishing & Forestry | 185 (77.4%) | 54 (22.6%) |
| Construction & Extraction | 291 (100.0%) | 0 (0.0%) |
| Installation, Maintenance & Repair | 153 (100.0%) | 0 (0.0%) |
| Total (Category) | 629 (92.1%) | 54 (7.9%) |
| Total (Overall) | 2,397 (46.8%) | 2,723 (53.2%) |
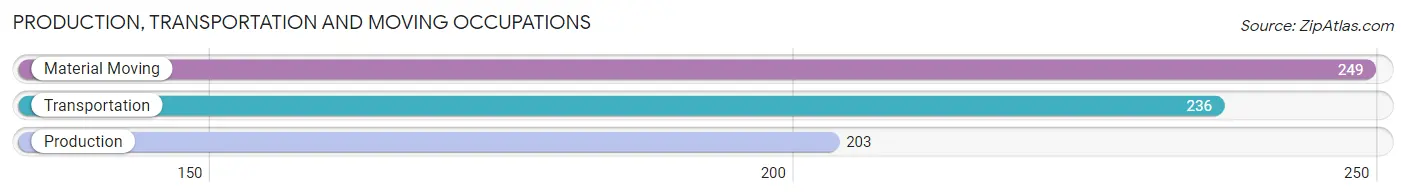
Production, Transportation and Moving Occupations
The most common Production, Transportation and Moving occupations in Clearlake are Material Moving (249 | 4.9%), Transportation (236 | 4.6%), and Production (203 | 4.0%).
Production, Transportation and Moving Occupations by Sex
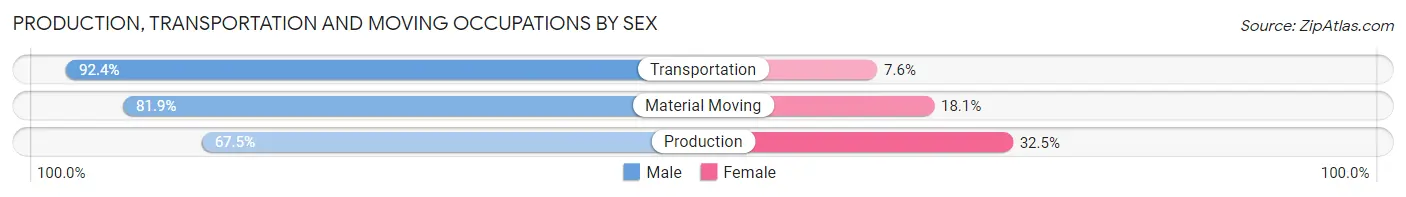
| Occupation | Male | Female |
| Production | 137 (67.5%) | 66 (32.5%) |
| Transportation | 218 (92.4%) | 18 (7.6%) |
| Material Moving | 204 (81.9%) | 45 (18.1%) |
| Total (Category) | 559 (81.2%) | 129 (18.8%) |
| Total (Overall) | 2,397 (46.8%) | 2,723 (53.2%) |
Employment Industries by Sex in Clearlake
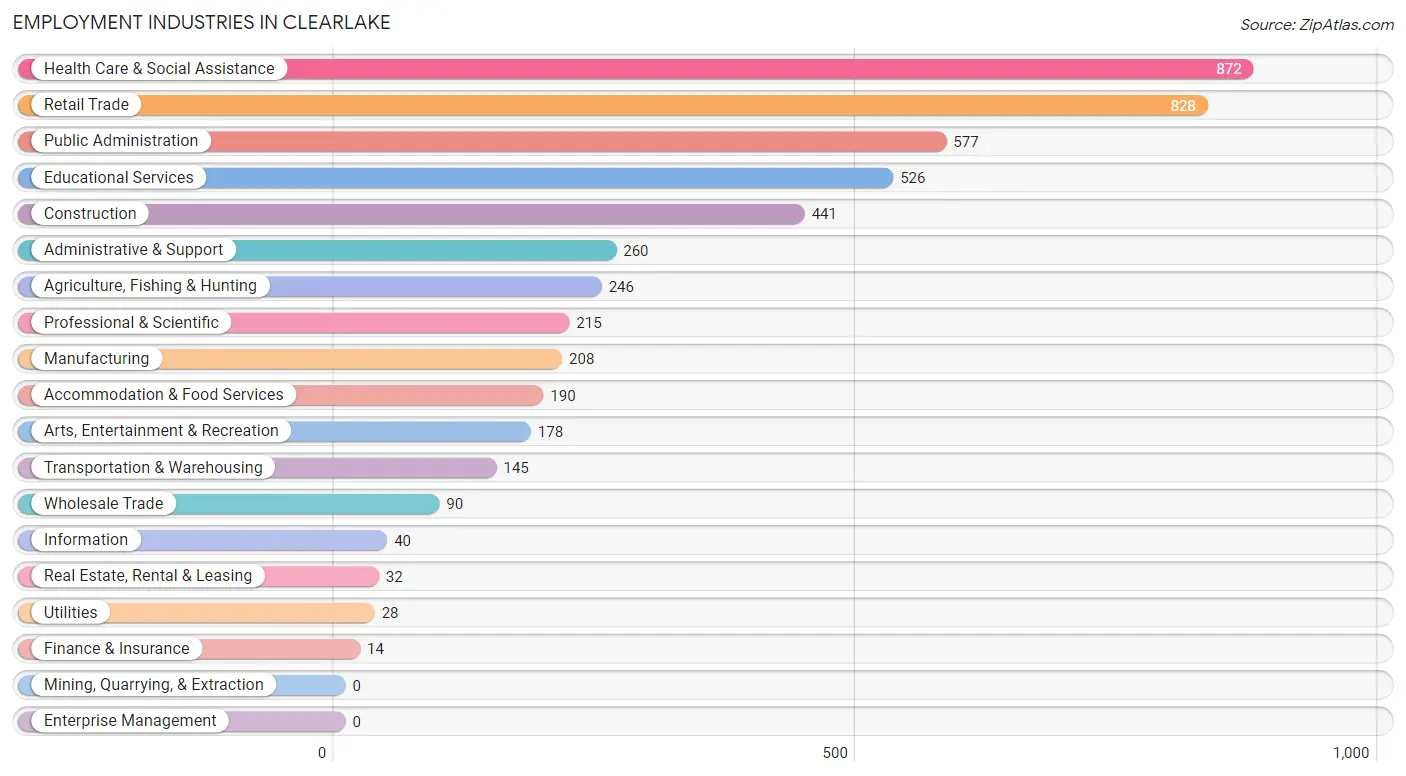
Employment Industries in Clearlake
The major employment industries in Clearlake include Health Care & Social Assistance (872 | 17.0%), Retail Trade (828 | 16.2%), Public Administration (577 | 11.3%), Educational Services (526 | 10.3%), and Construction (441 | 8.6%).
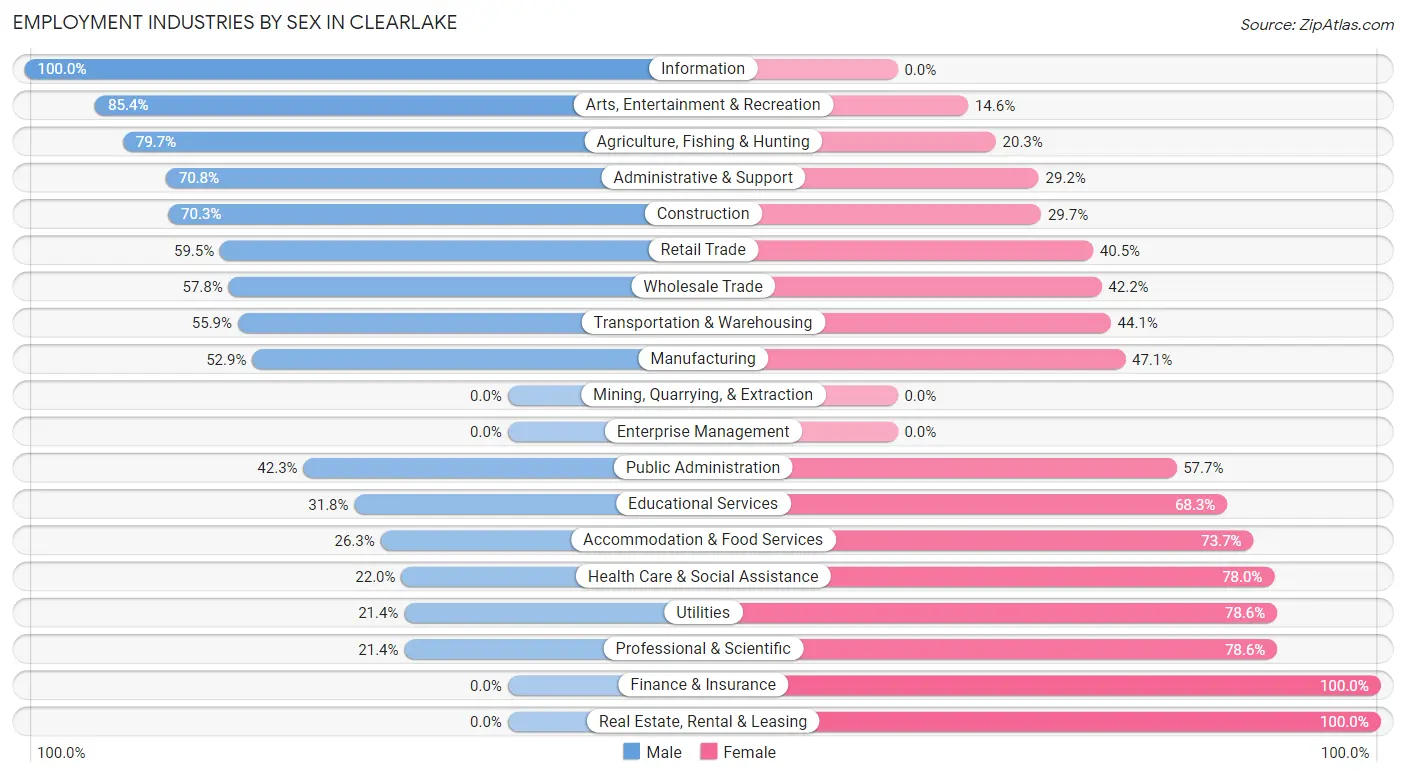
Employment Industries by Sex in Clearlake
The Clearlake industries that see more men than women are Information (100.0%), Arts, Entertainment & Recreation (85.4%), and Agriculture, Fishing & Hunting (79.7%), whereas the industries that tend to have a higher number of women are Finance & Insurance (100.0%), Real Estate, Rental & Leasing (100.0%), and Professional & Scientific (78.6%).
| Industry | Male | Female |
| Agriculture, Fishing & Hunting | 196 (79.7%) | 50 (20.3%) |
| Mining, Quarrying, & Extraction | 0 (0.0%) | 0 (0.0%) |
| Construction | 310 (70.3%) | 131 (29.7%) |
| Manufacturing | 110 (52.9%) | 98 (47.1%) |
| Wholesale Trade | 52 (57.8%) | 38 (42.2%) |
| Retail Trade | 493 (59.5%) | 335 (40.5%) |
| Transportation & Warehousing | 81 (55.9%) | 64 (44.1%) |
| Utilities | 6 (21.4%) | 22 (78.6%) |
| Information | 40 (100.0%) | 0 (0.0%) |
| Finance & Insurance | 0 (0.0%) | 14 (100.0%) |
| Real Estate, Rental & Leasing | 0 (0.0%) | 32 (100.0%) |
| Professional & Scientific | 46 (21.4%) | 169 (78.6%) |
| Enterprise Management | 0 (0.0%) | 0 (0.0%) |
| Administrative & Support | 184 (70.8%) | 76 (29.2%) |
| Educational Services | 167 (31.8%) | 359 (68.2%) |
| Health Care & Social Assistance | 192 (22.0%) | 680 (78.0%) |
| Arts, Entertainment & Recreation | 152 (85.4%) | 26 (14.6%) |
| Accommodation & Food Services | 50 (26.3%) | 140 (73.7%) |
| Public Administration | 244 (42.3%) | 333 (57.7%) |
| Total | 2,397 (46.8%) | 2,723 (53.2%) |
Education in Clearlake
School Enrollment in Clearlake
The most common levels of schooling among the 4,182 students in Clearlake are high school (1,120 | 26.8%), middle school (1,084 | 25.9%), and elementary school (918 | 22.0%).
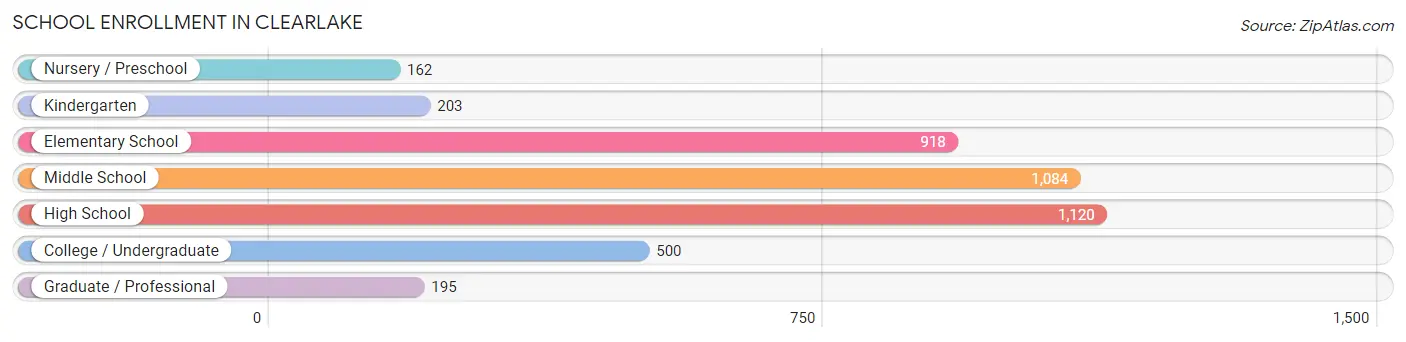
| School Level | # Students | % Students |
| Nursery / Preschool | 162 | 3.9% |
| Kindergarten | 203 | 4.9% |
| Elementary School | 918 | 22.0% |
| Middle School | 1,084 | 25.9% |
| High School | 1,120 | 26.8% |
| College / Undergraduate | 500 | 12.0% |
| Graduate / Professional | 195 | 4.7% |
| Total | 4,182 | 100.0% |
School Enrollment by Age by Funding Source in Clearlake
Out of a total of 4,182 students who are enrolled in schools in Clearlake, 213 (5.1%) attend a private institution, while the remaining 3,969 (94.9%) are enrolled in public schools. The age group of 3 to 4 year olds has the highest likelihood of being enrolled in private schools, with 81 (72.3% in the age bracket) enrolled. Conversely, the age group of 10 to 14 year olds has the lowest likelihood of being enrolled in a private school, with 1,304 (100.0% in the age bracket) attending a public institution.
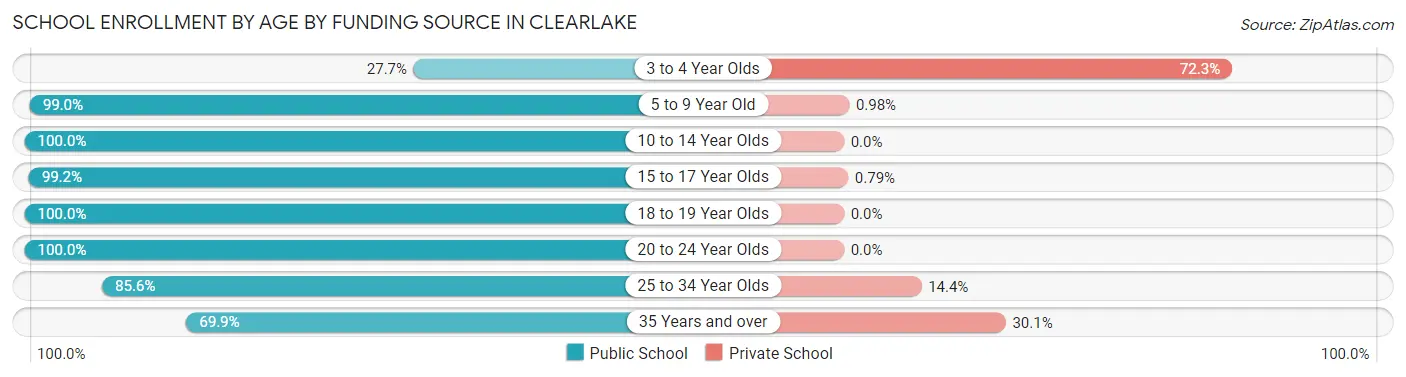
| Age Bracket | Public School | Private School |
| 3 to 4 Year Olds | 31 (27.7%) | 81 (72.3%) |
| 5 to 9 Year Old | 1,107 (99.0%) | 11 (1.0%) |
| 10 to 14 Year Olds | 1,304 (100.0%) | 0 (0.0%) |
| 15 to 17 Year Olds | 758 (99.2%) | 6 (0.8%) |
| 18 to 19 Year Olds | 143 (100.0%) | 0 (0.0%) |
| 20 to 24 Year Olds | 172 (100.0%) | 0 (0.0%) |
| 25 to 34 Year Olds | 308 (85.6%) | 52 (14.4%) |
| 35 Years and over | 146 (69.9%) | 63 (30.1%) |
| Total | 3,969 (94.9%) | 213 (5.1%) |
Educational Attainment by Field of Study in Clearlake
Business (135 | 14.1%), science & technology (130 | 13.6%), social sciences (128 | 13.4%), liberal arts & history (106 | 11.1%), and literature & languages (96 | 10.1%) are the most common fields of study among 955 individuals in Clearlake who have obtained a bachelor's degree or higher.
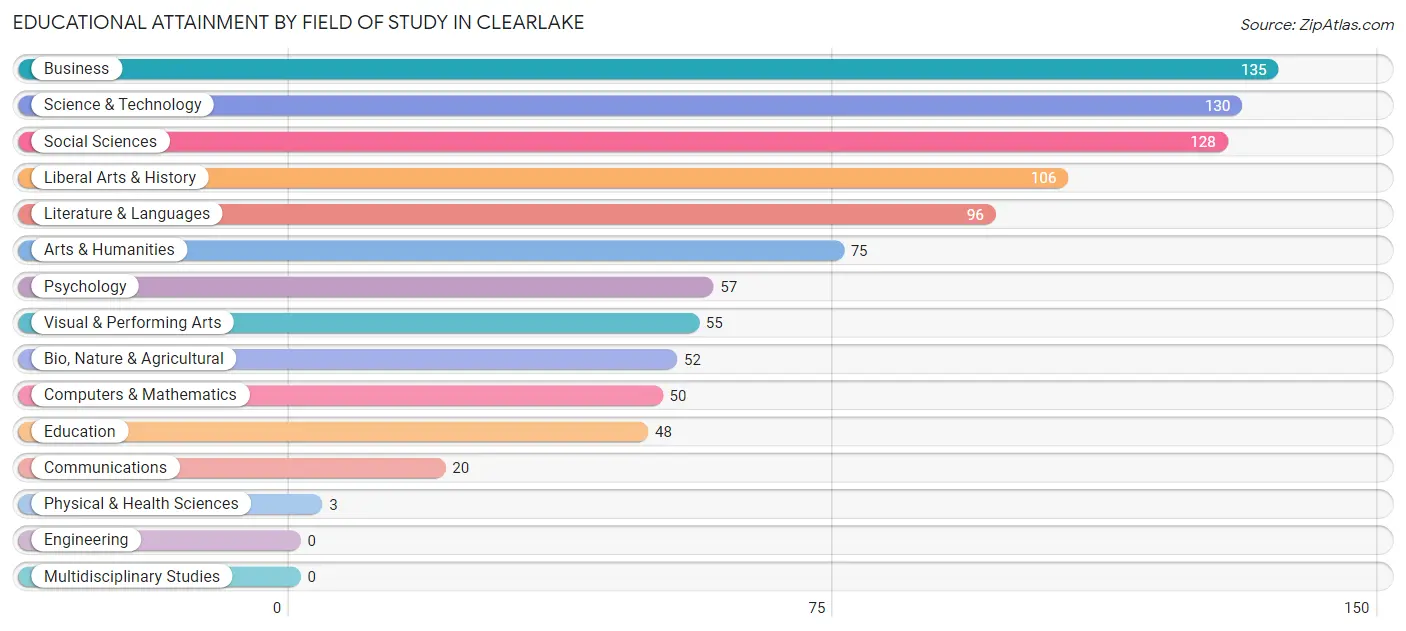
| Field of Study | # Graduates | % Graduates |
| Computers & Mathematics | 50 | 5.2% |
| Bio, Nature & Agricultural | 52 | 5.4% |
| Physical & Health Sciences | 3 | 0.3% |
| Psychology | 57 | 6.0% |
| Social Sciences | 128 | 13.4% |
| Engineering | 0 | 0.0% |
| Multidisciplinary Studies | 0 | 0.0% |
| Science & Technology | 130 | 13.6% |
| Business | 135 | 14.1% |
| Education | 48 | 5.0% |
| Literature & Languages | 96 | 10.1% |
| Liberal Arts & History | 106 | 11.1% |
| Visual & Performing Arts | 55 | 5.8% |
| Communications | 20 | 2.1% |
| Arts & Humanities | 75 | 7.9% |
| Total | 955 | 100.0% |
Transportation & Commute in Clearlake
Vehicle Availability by Sex in Clearlake
The most prevalent vehicle ownership categories in Clearlake are males with 2 vehicles (1,009, accounting for 44.2%) and females with 2 vehicles (958, making up 38.5%).
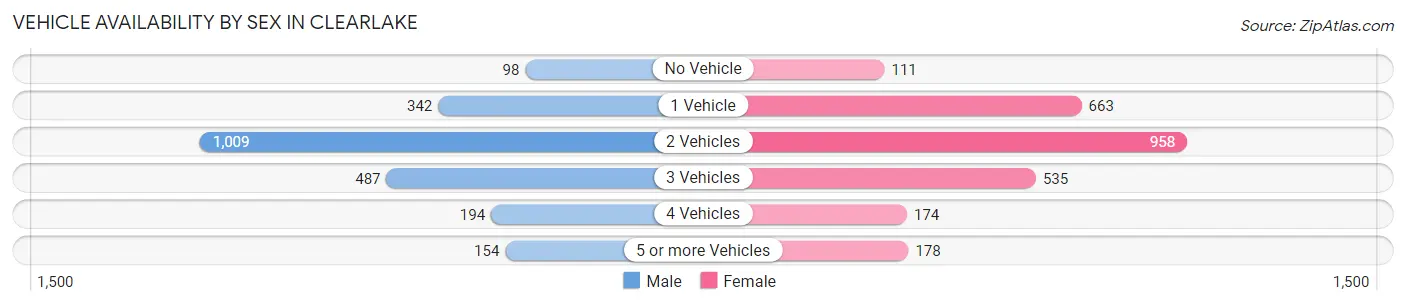
| Vehicles Available | Male | Female |
| No Vehicle | 98 (4.3%) | 111 (4.2%) |
| 1 Vehicle | 342 (15.0%) | 663 (25.3%) |
| 2 Vehicles | 1,009 (44.2%) | 958 (36.6%) |
| 3 Vehicles | 487 (21.3%) | 535 (20.4%) |
| 4 Vehicles | 194 (8.5%) | 174 (6.6%) |
| 5 or more Vehicles | 154 (6.7%) | 178 (6.8%) |
| Total | 2,284 (100.0%) | 2,619 (100.0%) |
Commute Time in Clearlake
The most frequently occuring commute durations in Clearlake are 5 to 9 minutes (805 commuters, 18.4%), 10 to 14 minutes (736 commuters, 16.8%), and 15 to 19 minutes (507 commuters, 11.6%).
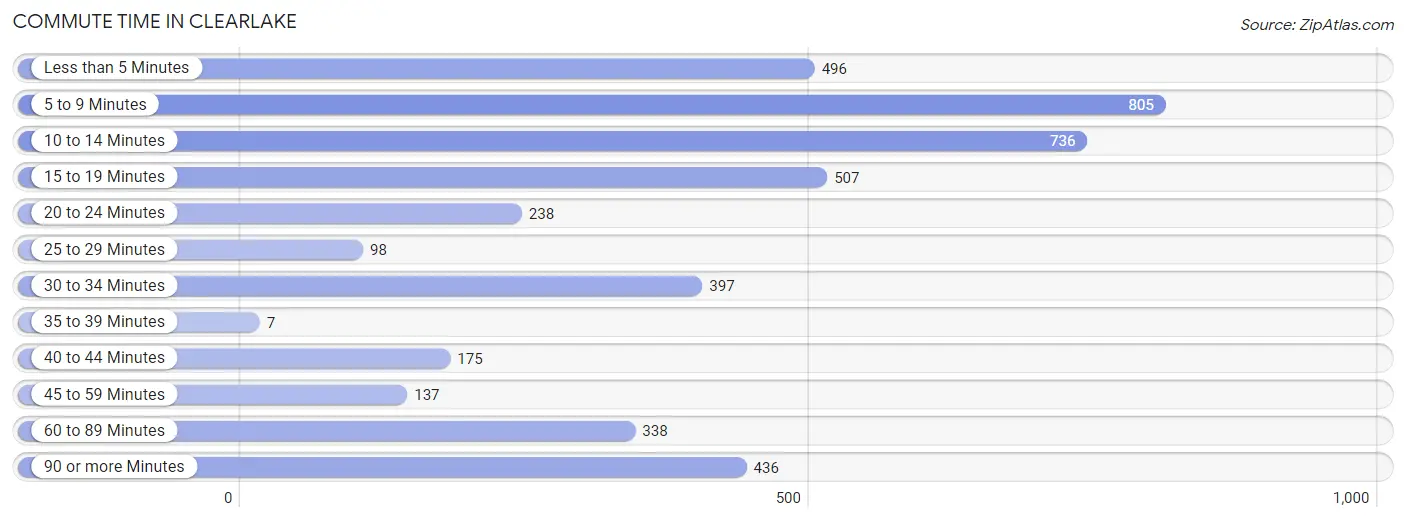
| Commute Time | # Commuters | % Commuters |
| Less than 5 Minutes | 496 | 11.4% |
| 5 to 9 Minutes | 805 | 18.4% |
| 10 to 14 Minutes | 736 | 16.8% |
| 15 to 19 Minutes | 507 | 11.6% |
| 20 to 24 Minutes | 238 | 5.4% |
| 25 to 29 Minutes | 98 | 2.2% |
| 30 to 34 Minutes | 397 | 9.1% |
| 35 to 39 Minutes | 7 | 0.2% |
| 40 to 44 Minutes | 175 | 4.0% |
| 45 to 59 Minutes | 137 | 3.1% |
| 60 to 89 Minutes | 338 | 7.7% |
| 90 or more Minutes | 436 | 10.0% |
Commute Time by Sex in Clearlake
The most common commute times in Clearlake are 10 to 14 minutes (367 commuters, 17.4%) for males and 5 to 9 minutes (653 commuters, 28.8%) for females.
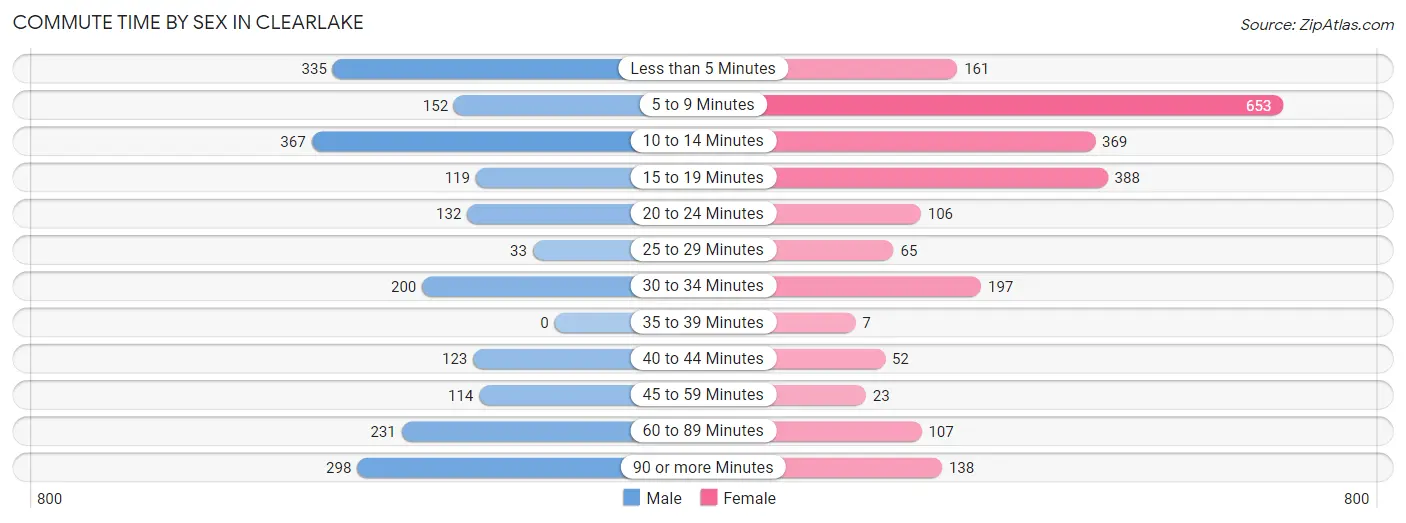
| Commute Time | Male | Female |
| Less than 5 Minutes | 335 (15.9%) | 161 (7.1%) |
| 5 to 9 Minutes | 152 (7.2%) | 653 (28.8%) |
| 10 to 14 Minutes | 367 (17.4%) | 369 (16.3%) |
| 15 to 19 Minutes | 119 (5.7%) | 388 (17.1%) |
| 20 to 24 Minutes | 132 (6.3%) | 106 (4.7%) |
| 25 to 29 Minutes | 33 (1.6%) | 65 (2.9%) |
| 30 to 34 Minutes | 200 (9.5%) | 197 (8.7%) |
| 35 to 39 Minutes | 0 (0.0%) | 7 (0.3%) |
| 40 to 44 Minutes | 123 (5.9%) | 52 (2.3%) |
| 45 to 59 Minutes | 114 (5.4%) | 23 (1.0%) |
| 60 to 89 Minutes | 231 (11.0%) | 107 (4.7%) |
| 90 or more Minutes | 298 (14.2%) | 138 (6.1%) |
Time of Departure to Work by Sex in Clearlake
The most frequent times of departure to work in Clearlake are 8:00 AM to 8:29 AM (307, 14.6%) for males and 7:30 AM to 7:59 AM (407, 18.0%) for females.
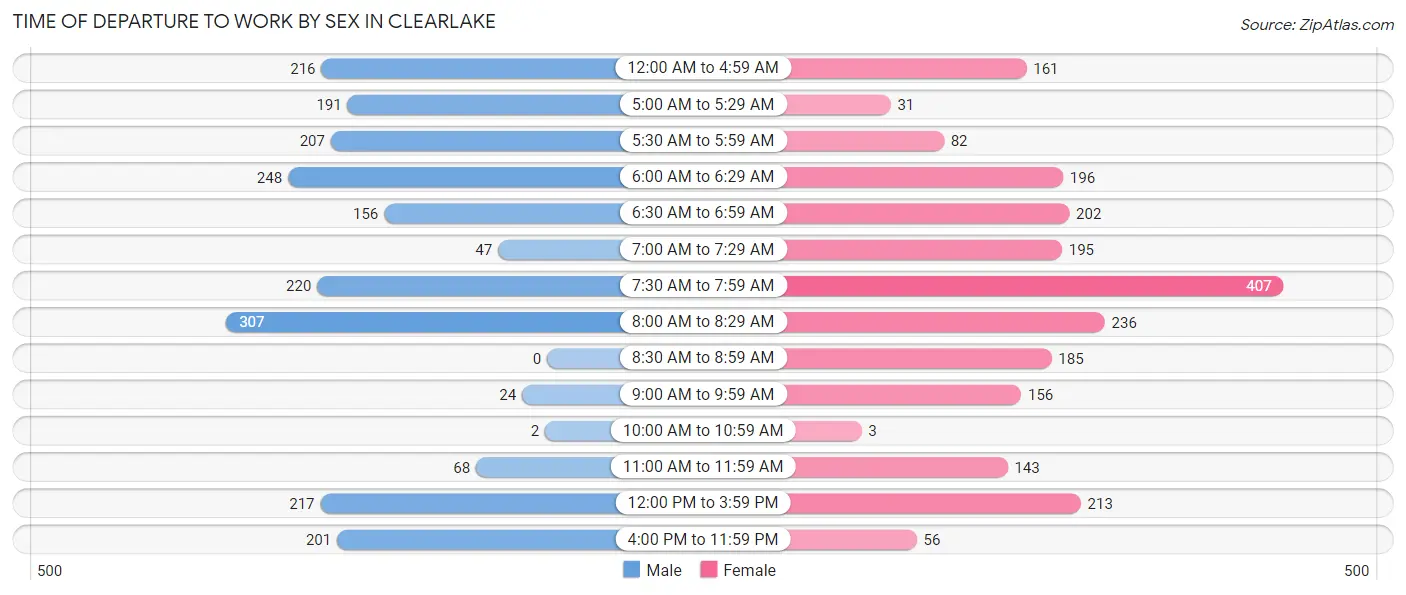
| Time of Departure | Male | Female |
| 12:00 AM to 4:59 AM | 216 (10.3%) | 161 (7.1%) |
| 5:00 AM to 5:29 AM | 191 (9.1%) | 31 (1.4%) |
| 5:30 AM to 5:59 AM | 207 (9.8%) | 82 (3.6%) |
| 6:00 AM to 6:29 AM | 248 (11.8%) | 196 (8.6%) |
| 6:30 AM to 6:59 AM | 156 (7.4%) | 202 (8.9%) |
| 7:00 AM to 7:29 AM | 47 (2.2%) | 195 (8.6%) |
| 7:30 AM to 7:59 AM | 220 (10.5%) | 407 (18.0%) |
| 8:00 AM to 8:29 AM | 307 (14.6%) | 236 (10.4%) |
| 8:30 AM to 8:59 AM | 0 (0.0%) | 185 (8.2%) |
| 9:00 AM to 9:59 AM | 24 (1.1%) | 156 (6.9%) |
| 10:00 AM to 10:59 AM | 2 (0.1%) | 3 (0.1%) |
| 11:00 AM to 11:59 AM | 68 (3.2%) | 143 (6.3%) |
| 12:00 PM to 3:59 PM | 217 (10.3%) | 213 (9.4%) |
| 4:00 PM to 11:59 PM | 201 (9.6%) | 56 (2.5%) |
| Total | 2,104 (100.0%) | 2,266 (100.0%) |
Housing Occupancy in Clearlake
Occupancy by Ownership in Clearlake
Of the total 5,847 dwellings in Clearlake, owner-occupied units account for 3,476 (59.5%), while renter-occupied units make up 2,371 (40.6%).
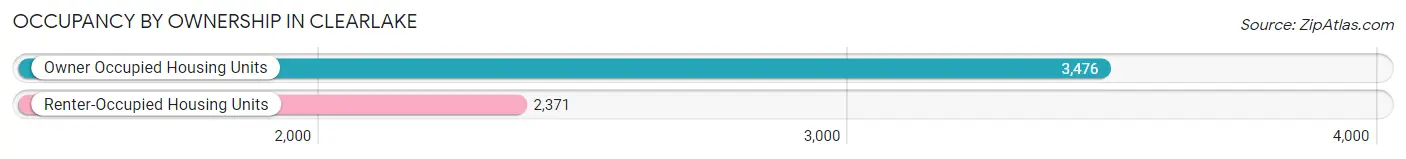
| Occupancy | # Housing Units | % Housing Units |
| Owner Occupied Housing Units | 3,476 | 59.5% |
| Renter-Occupied Housing Units | 2,371 | 40.6% |
| Total Occupied Housing Units | 5,847 | 100.0% |
Occupancy by Household Size in Clearlake
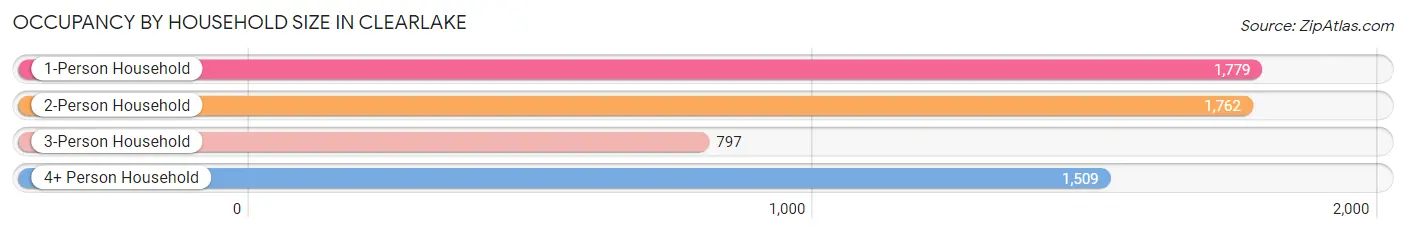
| Household Size | # Housing Units | % Housing Units |
| 1-Person Household | 1,779 | 30.4% |
| 2-Person Household | 1,762 | 30.1% |
| 3-Person Household | 797 | 13.6% |
| 4+ Person Household | 1,509 | 25.8% |
| Total Housing Units | 5,847 | 100.0% |
Occupancy by Ownership by Household Size in Clearlake
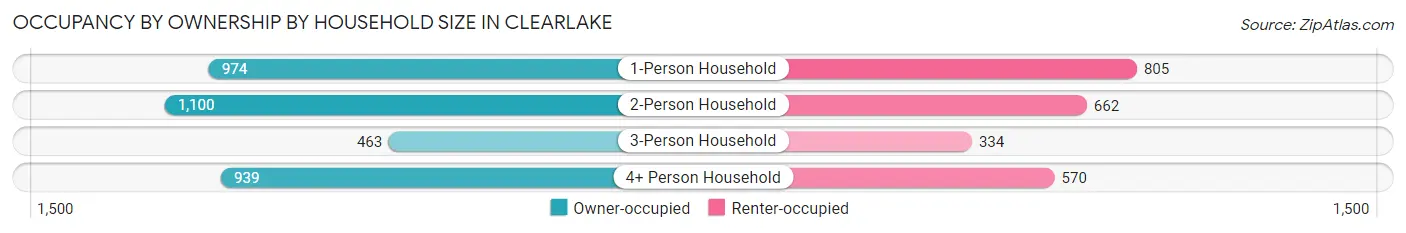
| Household Size | Owner-occupied | Renter-occupied |
| 1-Person Household | 974 (54.7%) | 805 (45.3%) |
| 2-Person Household | 1,100 (62.4%) | 662 (37.6%) |
| 3-Person Household | 463 (58.1%) | 334 (41.9%) |
| 4+ Person Household | 939 (62.2%) | 570 (37.8%) |
| Total Housing Units | 3,476 (59.5%) | 2,371 (40.6%) |
Occupancy by Educational Attainment in Clearlake
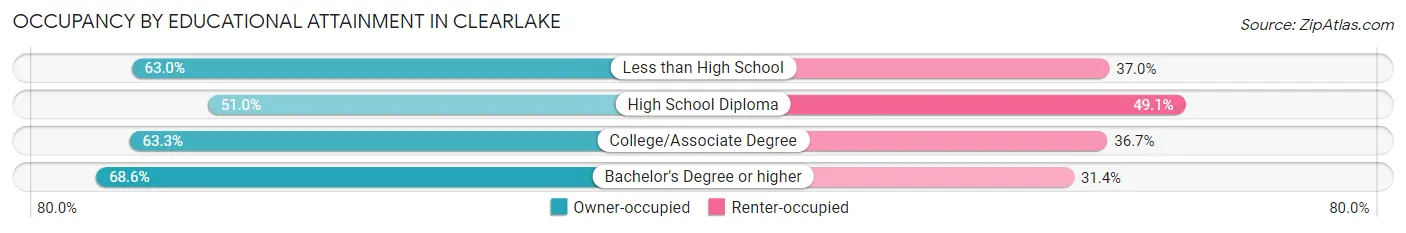
| Household Size | Owner-occupied | Renter-occupied |
| Less than High School | 617 (63.0%) | 362 (37.0%) |
| High School Diploma | 1,021 (50.9%) | 983 (49.0%) |
| College/Associate Degree | 1,523 (63.3%) | 882 (36.7%) |
| Bachelor's Degree or higher | 315 (68.6%) | 144 (31.4%) |
Occupancy by Age of Householder in Clearlake
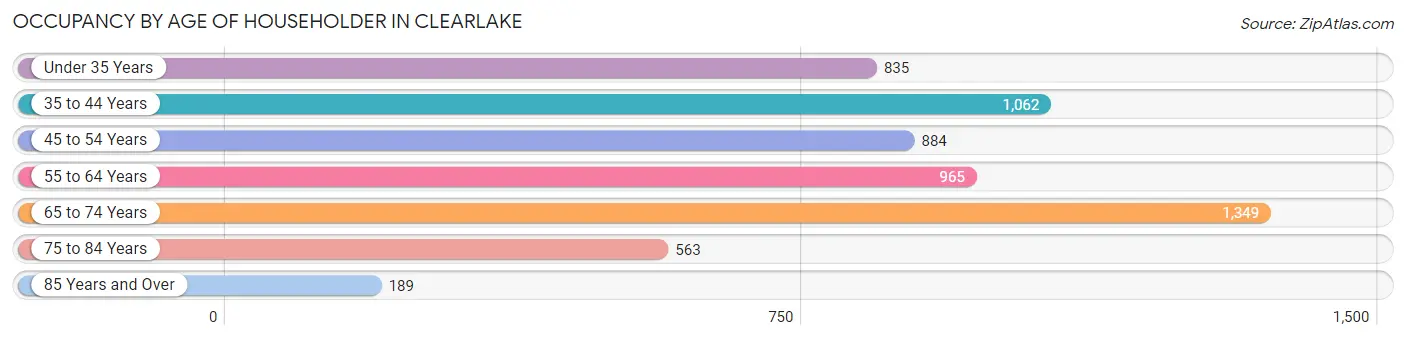
| Age Bracket | # Households | % Households |
| Under 35 Years | 835 | 14.3% |
| 35 to 44 Years | 1,062 | 18.2% |
| 45 to 54 Years | 884 | 15.1% |
| 55 to 64 Years | 965 | 16.5% |
| 65 to 74 Years | 1,349 | 23.1% |
| 75 to 84 Years | 563 | 9.6% |
| 85 Years and Over | 189 | 3.2% |
| Total | 5,847 | 100.0% |
Housing Finances in Clearlake
Median Income by Occupancy in Clearlake
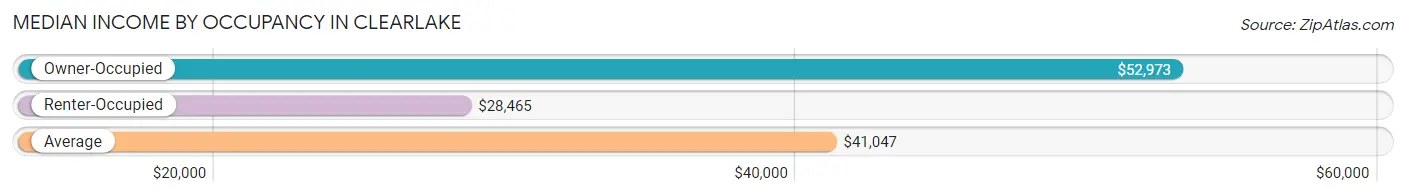
| Occupancy Type | # Households | Median Income |
| Owner-Occupied | 3,476 (59.5%) | $52,973 |
| Renter-Occupied | 2,371 (40.6%) | $28,465 |
| Average | 5,847 (100.0%) | $41,047 |
Occupancy by Householder Income Bracket in Clearlake
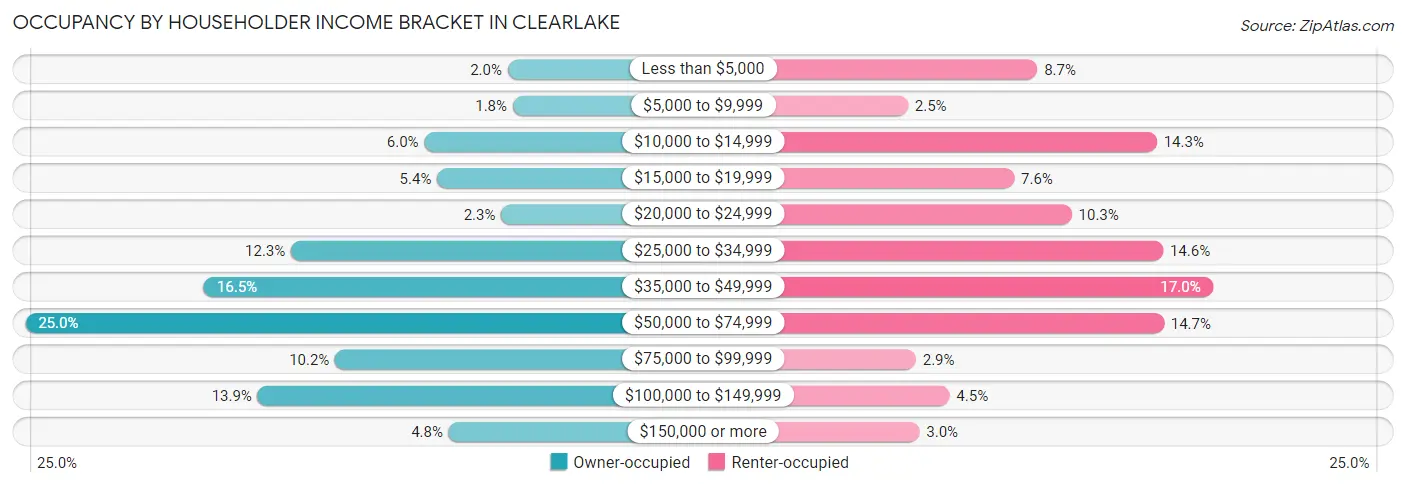
| Income Bracket | Owner-occupied | Renter-occupied |
| Less than $5,000 | 69 (2.0%) | 205 (8.6%) |
| $5,000 to $9,999 | 61 (1.8%) | 59 (2.5%) |
| $10,000 to $14,999 | 207 (6.0%) | 340 (14.3%) |
| $15,000 to $19,999 | 186 (5.3%) | 179 (7.5%) |
| $20,000 to $24,999 | 80 (2.3%) | 244 (10.3%) |
| $25,000 to $34,999 | 428 (12.3%) | 347 (14.6%) |
| $35,000 to $49,999 | 572 (16.5%) | 403 (17.0%) |
| $50,000 to $74,999 | 868 (25.0%) | 348 (14.7%) |
| $75,000 to $99,999 | 355 (10.2%) | 68 (2.9%) |
| $100,000 to $149,999 | 483 (13.9%) | 106 (4.5%) |
| $150,000 or more | 167 (4.8%) | 72 (3.0%) |
| Total | 3,476 (100.0%) | 2,371 (100.0%) |
Monthly Housing Cost Tiers in Clearlake
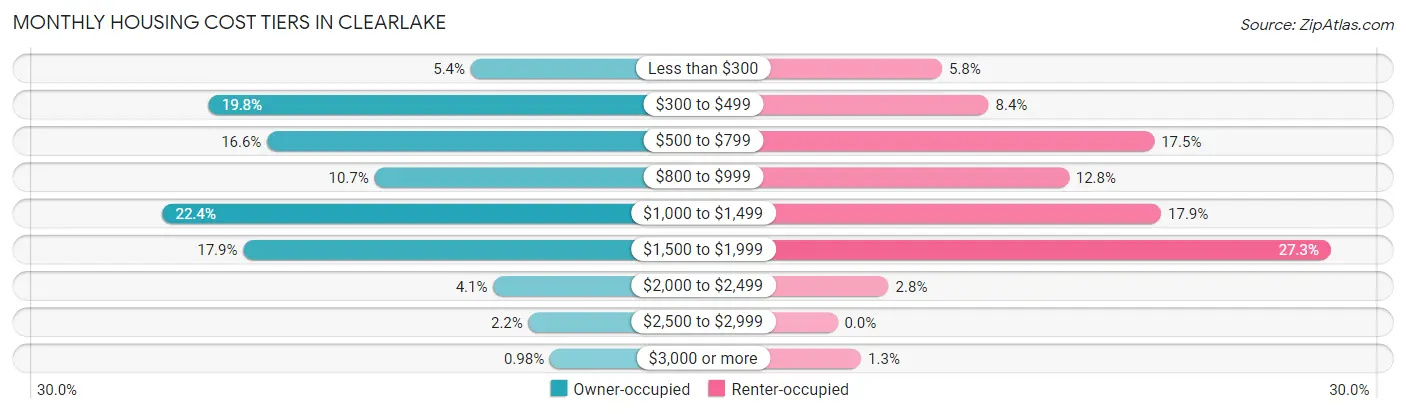
| Monthly Cost | Owner-occupied | Renter-occupied |
| Less than $300 | 186 (5.3%) | 137 (5.8%) |
| $300 to $499 | 689 (19.8%) | 198 (8.4%) |
| $500 to $799 | 577 (16.6%) | 415 (17.5%) |
| $800 to $999 | 371 (10.7%) | 303 (12.8%) |
| $1,000 to $1,499 | 778 (22.4%) | 424 (17.9%) |
| $1,500 to $1,999 | 623 (17.9%) | 646 (27.3%) |
| $2,000 to $2,499 | 143 (4.1%) | 67 (2.8%) |
| $2,500 to $2,999 | 75 (2.2%) | 0 (0.0%) |
| $3,000 or more | 34 (1.0%) | 31 (1.3%) |
| Total | 3,476 (100.0%) | 2,371 (100.0%) |
Physical Housing Characteristics in Clearlake
Housing Structures in Clearlake
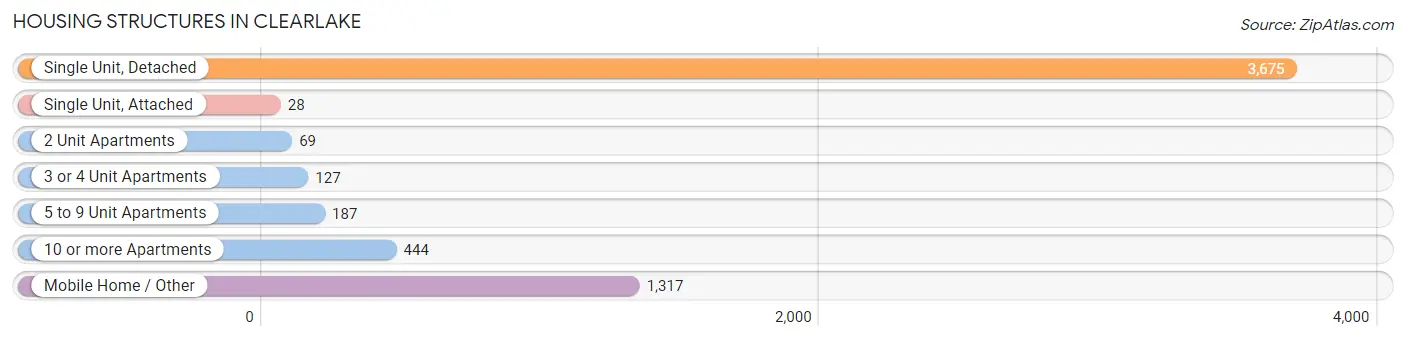
| Structure Type | # Housing Units | % Housing Units |
| Single Unit, Detached | 3,675 | 62.8% |
| Single Unit, Attached | 28 | 0.5% |
| 2 Unit Apartments | 69 | 1.2% |
| 3 or 4 Unit Apartments | 127 | 2.2% |
| 5 to 9 Unit Apartments | 187 | 3.2% |
| 10 or more Apartments | 444 | 7.6% |
| Mobile Home / Other | 1,317 | 22.5% |
| Total | 5,847 | 100.0% |
Housing Structures by Occupancy in Clearlake
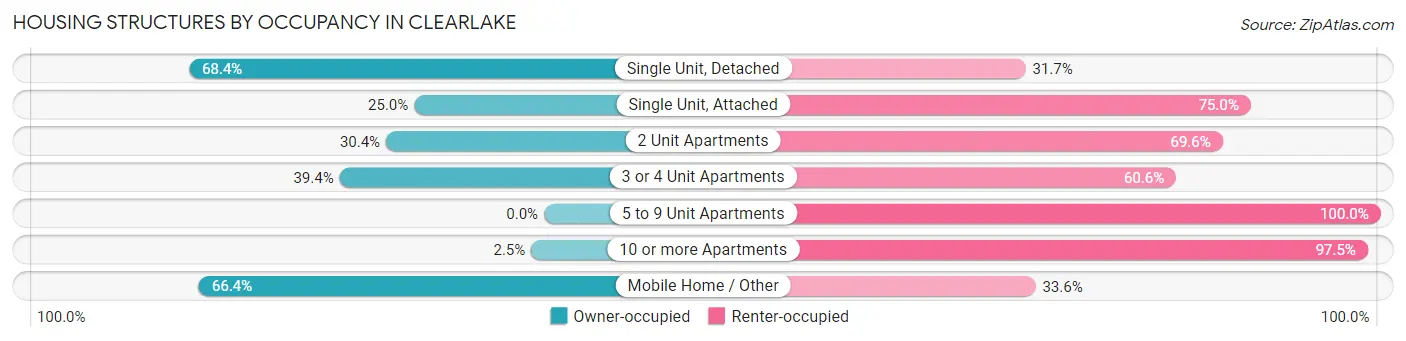
| Structure Type | Owner-occupied | Renter-occupied |
| Single Unit, Detached | 2,512 (68.3%) | 1,163 (31.7%) |
| Single Unit, Attached | 7 (25.0%) | 21 (75.0%) |
| 2 Unit Apartments | 21 (30.4%) | 48 (69.6%) |
| 3 or 4 Unit Apartments | 50 (39.4%) | 77 (60.6%) |
| 5 to 9 Unit Apartments | 0 (0.0%) | 187 (100.0%) |
| 10 or more Apartments | 11 (2.5%) | 433 (97.5%) |
| Mobile Home / Other | 875 (66.4%) | 442 (33.6%) |
| Total | 3,476 (59.5%) | 2,371 (40.6%) |
Housing Structures by Number of Rooms in Clearlake
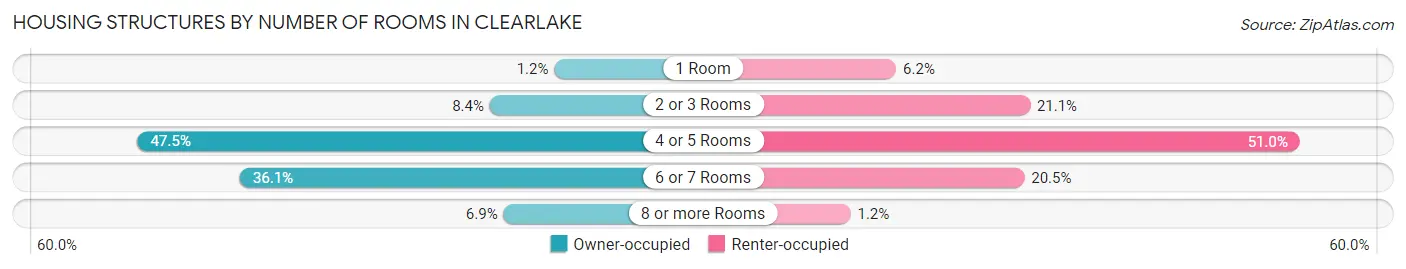
| Number of Rooms | Owner-occupied | Renter-occupied |
| 1 Room | 42 (1.2%) | 148 (6.2%) |
| 2 or 3 Rooms | 291 (8.4%) | 500 (21.1%) |
| 4 or 5 Rooms | 1,650 (47.5%) | 1,210 (51.0%) |
| 6 or 7 Rooms | 1,255 (36.1%) | 485 (20.5%) |
| 8 or more Rooms | 238 (6.9%) | 28 (1.2%) |
| Total | 3,476 (100.0%) | 2,371 (100.0%) |
Housing Structure by Heating Type in Clearlake
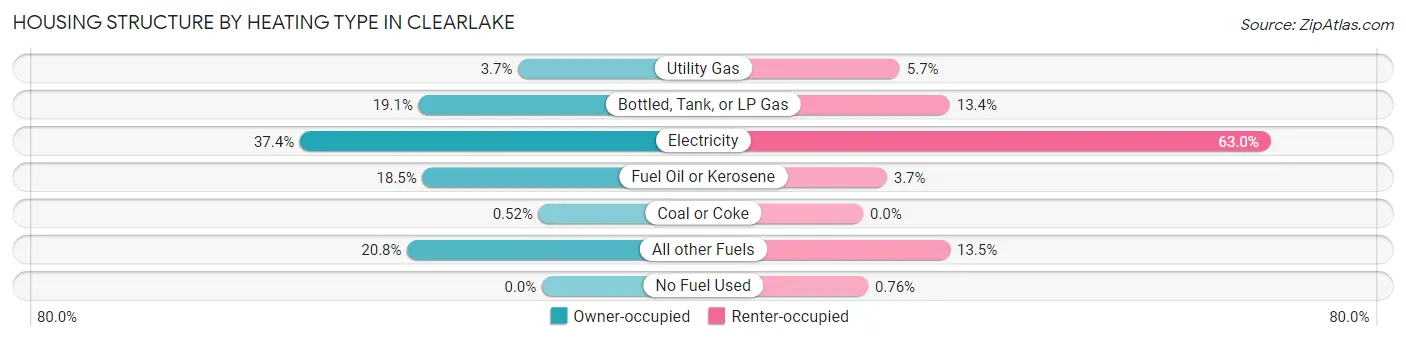
| Heating Type | Owner-occupied | Renter-occupied |
| Utility Gas | 128 (3.7%) | 135 (5.7%) |
| Bottled, Tank, or LP Gas | 663 (19.1%) | 318 (13.4%) |
| Electricity | 1,301 (37.4%) | 1,494 (63.0%) |
| Fuel Oil or Kerosene | 642 (18.5%) | 87 (3.7%) |
| Coal or Coke | 18 (0.5%) | 0 (0.0%) |
| All other Fuels | 724 (20.8%) | 319 (13.5%) |
| No Fuel Used | 0 (0.0%) | 18 (0.8%) |
| Total | 3,476 (100.0%) | 2,371 (100.0%) |
Household Vehicle Usage in Clearlake
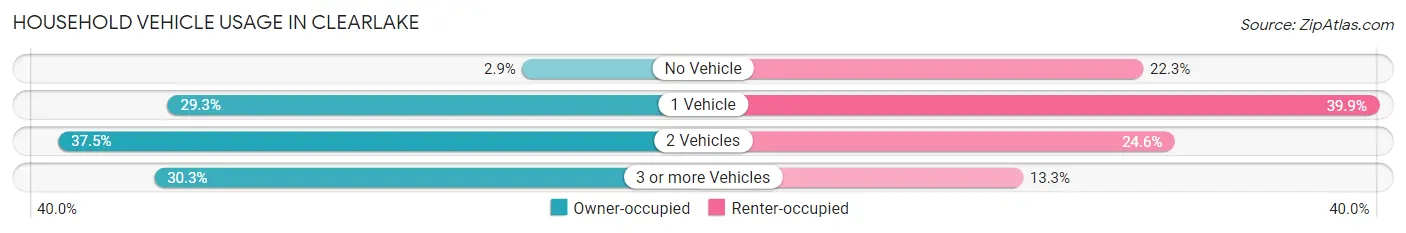
| Vehicles per Household | Owner-occupied | Renter-occupied |
| No Vehicle | 100 (2.9%) | 528 (22.3%) |
| 1 Vehicle | 1,019 (29.3%) | 945 (39.9%) |
| 2 Vehicles | 1,303 (37.5%) | 583 (24.6%) |
| 3 or more Vehicles | 1,054 (30.3%) | 315 (13.3%) |
| Total | 3,476 (100.0%) | 2,371 (100.0%) |
Real Estate & Mortgages in Clearlake
Real Estate and Mortgage Overview in Clearlake
| Characteristic | Without Mortgage | With Mortgage |
| Housing Units | 1,514 | 1,962 |
| Median Property Value | $151,100 | $204,300 |
| Median Household Income | $45,278 | $80 |
| Monthly Housing Costs | $474 | $34 |
| Real Estate Taxes | $1,056 | $108 |
Property Value by Mortgage Status in Clearlake
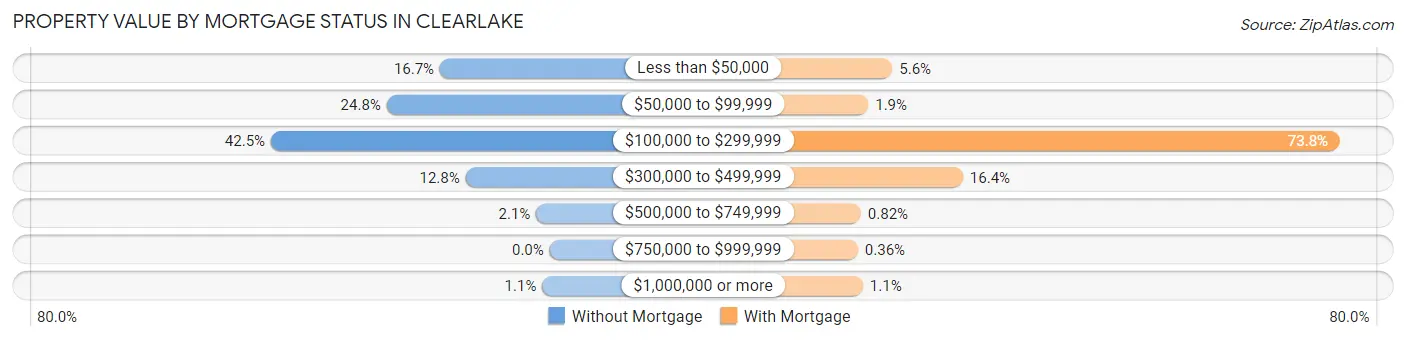
| Property Value | Without Mortgage | With Mortgage |
| Less than $50,000 | 253 (16.7%) | 110 (5.6%) |
| $50,000 to $99,999 | 376 (24.8%) | 38 (1.9%) |
| $100,000 to $299,999 | 643 (42.5%) | 1,448 (73.8%) |
| $300,000 to $499,999 | 194 (12.8%) | 321 (16.4%) |
| $500,000 to $749,999 | 31 (2.1%) | 16 (0.8%) |
| $750,000 to $999,999 | 0 (0.0%) | 7 (0.4%) |
| $1,000,000 or more | 17 (1.1%) | 22 (1.1%) |
| Total | 1,514 (100.0%) | 1,962 (100.0%) |
Household Income by Mortgage Status in Clearlake
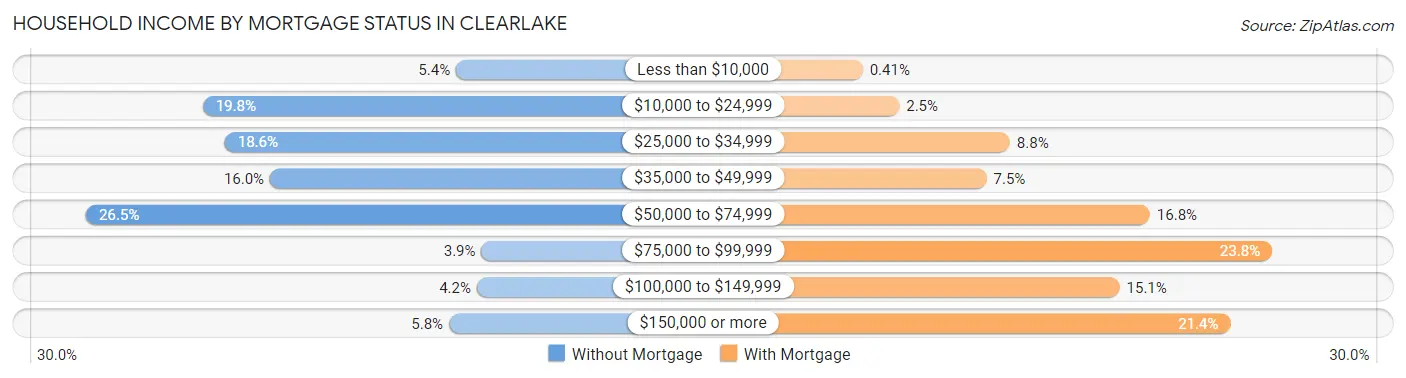
| Household Income | Without Mortgage | With Mortgage |
| Less than $10,000 | 81 (5.3%) | 8 (0.4%) |
| $10,000 to $24,999 | 300 (19.8%) | 49 (2.5%) |
| $25,000 to $34,999 | 281 (18.6%) | 173 (8.8%) |
| $35,000 to $49,999 | 242 (16.0%) | 147 (7.5%) |
| $50,000 to $74,999 | 401 (26.5%) | 330 (16.8%) |
| $75,000 to $99,999 | 59 (3.9%) | 467 (23.8%) |
| $100,000 to $149,999 | 63 (4.2%) | 296 (15.1%) |
| $150,000 or more | 87 (5.8%) | 420 (21.4%) |
| Total | 1,514 (100.0%) | 1,962 (100.0%) |
Property Value to Household Income Ratio in Clearlake
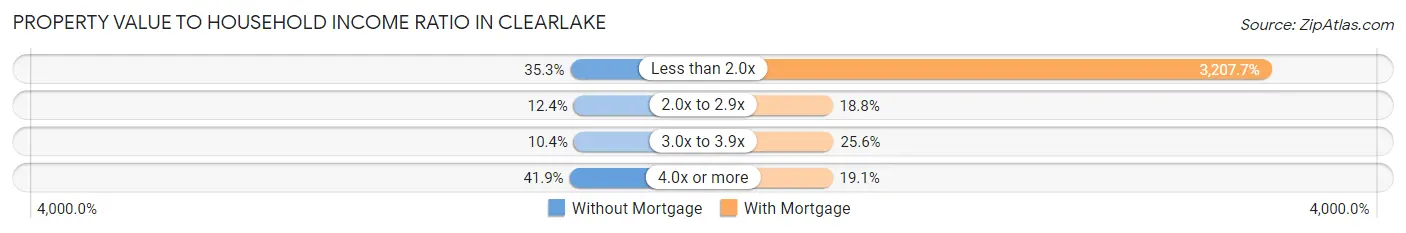
| Value-to-Income Ratio | Without Mortgage | With Mortgage |
| Less than 2.0x | 534 (35.3%) | 62,935 (3,207.7%) |
| 2.0x to 2.9x | 188 (12.4%) | 368 (18.8%) |
| 3.0x to 3.9x | 157 (10.4%) | 503 (25.6%) |
| 4.0x or more | 635 (41.9%) | 374 (19.1%) |
| Total | 1,514 (100.0%) | 1,962 (100.0%) |
Real Estate Taxes by Mortgage Status in Clearlake
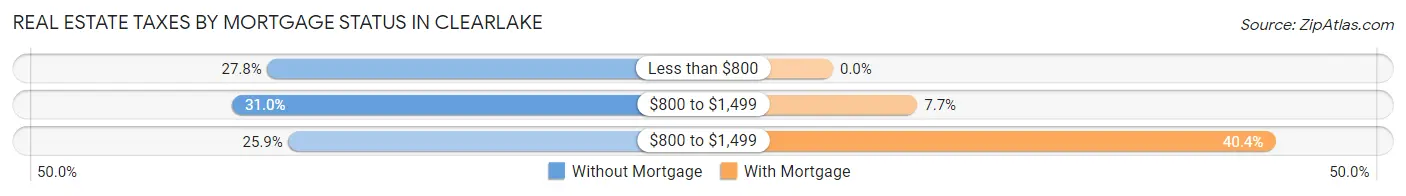
| Property Taxes | Without Mortgage | With Mortgage |
| Less than $800 | 421 (27.8%) | 0 (0.0%) |
| $800 to $1,499 | 470 (31.0%) | 151 (7.7%) |
| $800 to $1,499 | 392 (25.9%) | 792 (40.4%) |
| Total | 1,514 (100.0%) | 1,962 (100.0%) |
Health & Disability in Clearlake
Health Insurance Coverage by Age in Clearlake
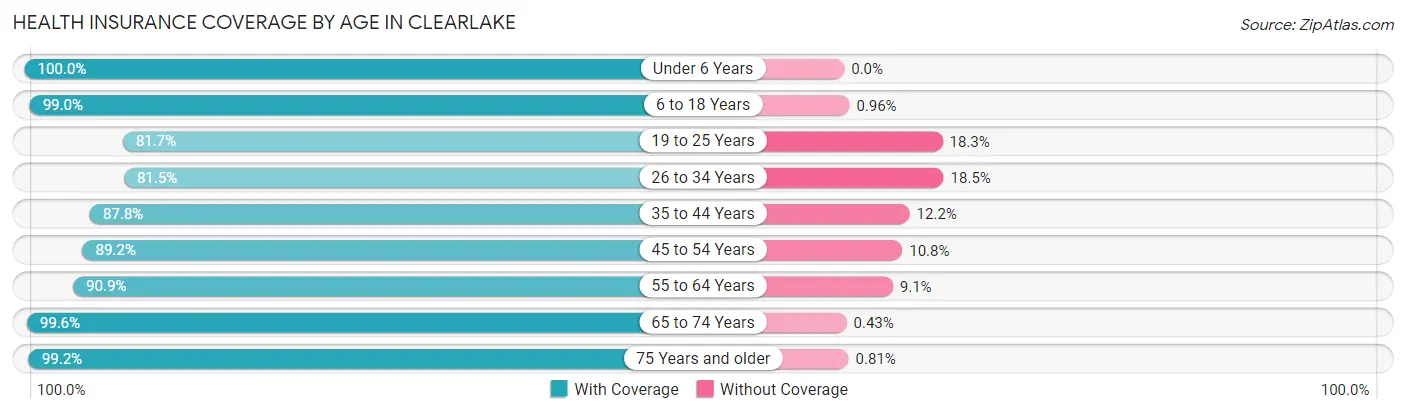
| Age Bracket | With Coverage | Without Coverage |
| Under 6 Years | 1,113 (100.0%) | 0 (0.0%) |
| 6 to 18 Years | 3,395 (99.0%) | 33 (1.0%) |
| 19 to 25 Years | 767 (81.7%) | 172 (18.3%) |
| 26 to 34 Years | 1,724 (81.5%) | 392 (18.5%) |
| 35 to 44 Years | 1,793 (87.8%) | 249 (12.2%) |
| 45 to 54 Years | 1,847 (89.2%) | 224 (10.8%) |
| 55 to 64 Years | 1,786 (90.9%) | 178 (9.1%) |
| 65 to 74 Years | 1,865 (99.6%) | 8 (0.4%) |
| 75 Years and older | 975 (99.2%) | 8 (0.8%) |
| Total | 15,265 (92.3%) | 1,264 (7.6%) |
Health Insurance Coverage by Citizenship Status in Clearlake
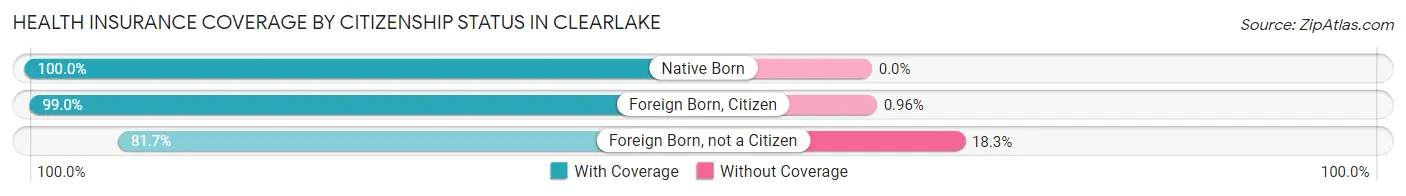
| Citizenship Status | With Coverage | Without Coverage |
| Native Born | 1,113 (100.0%) | 0 (0.0%) |
| Foreign Born, Citizen | 3,395 (99.0%) | 33 (1.0%) |
| Foreign Born, not a Citizen | 767 (81.7%) | 172 (18.3%) |
Health Insurance Coverage by Household Income in Clearlake
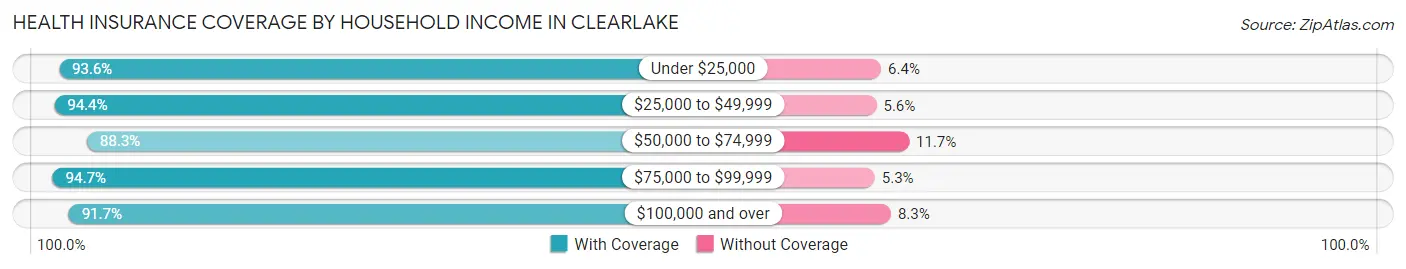
| Household Income | With Coverage | Without Coverage |
| Under $25,000 | 2,889 (93.6%) | 199 (6.4%) |
| $25,000 to $49,999 | 4,404 (94.4%) | 260 (5.6%) |
| $50,000 to $74,999 | 3,283 (88.3%) | 434 (11.7%) |
| $75,000 to $99,999 | 1,602 (94.7%) | 89 (5.3%) |
| $100,000 and over | 2,972 (91.7%) | 268 (8.3%) |
Public vs Private Health Insurance Coverage by Age in Clearlake
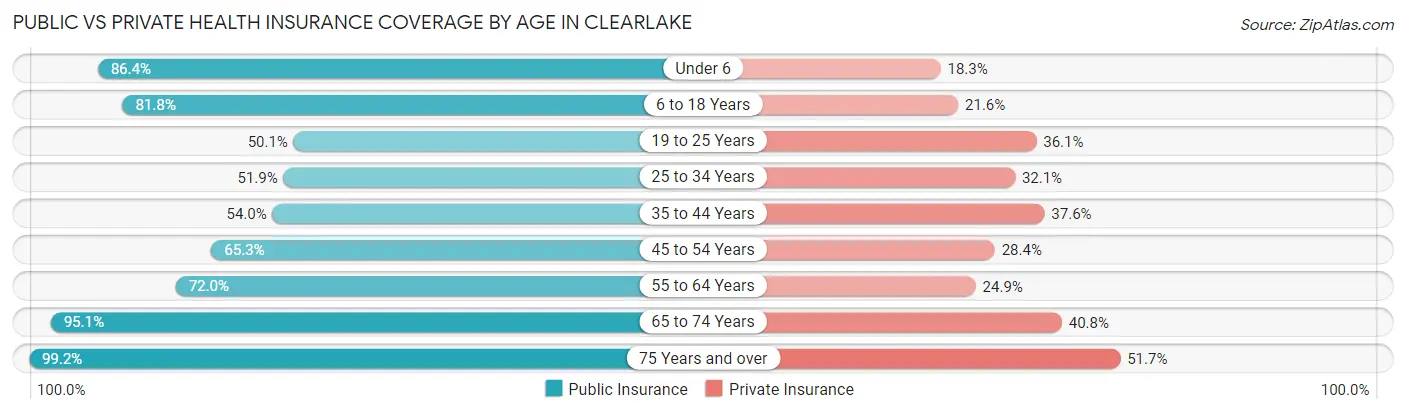
| Age Bracket | Public Insurance | Private Insurance |
| Under 6 | 962 (86.4%) | 204 (18.3%) |
| 6 to 18 Years | 2,805 (81.8%) | 740 (21.6%) |
| 19 to 25 Years | 470 (50.0%) | 339 (36.1%) |
| 25 to 34 Years | 1,099 (51.9%) | 680 (32.1%) |
| 35 to 44 Years | 1,102 (54.0%) | 768 (37.6%) |
| 45 to 54 Years | 1,353 (65.3%) | 588 (28.4%) |
| 55 to 64 Years | 1,413 (72.0%) | 488 (24.8%) |
| 65 to 74 Years | 1,782 (95.1%) | 765 (40.8%) |
| 75 Years and over | 975 (99.2%) | 508 (51.7%) |
| Total | 11,961 (72.4%) | 5,080 (30.7%) |
Disability Status by Sex by Age in Clearlake
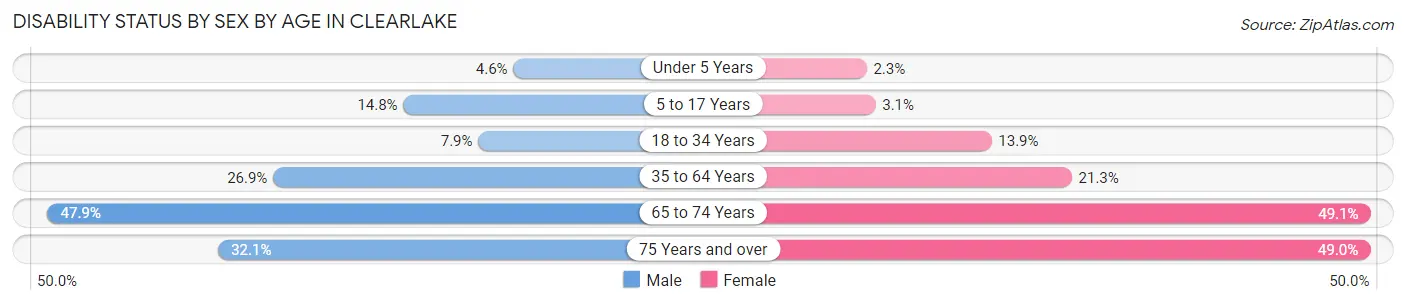
| Age Bracket | Male | Female |
| Under 5 Years | 10 (4.6%) | 15 (2.3%) |
| 5 to 17 Years | 293 (14.8%) | 48 (3.1%) |
| 18 to 34 Years | 129 (7.9%) | 218 (13.9%) |
| 35 to 64 Years | 792 (26.9%) | 669 (21.3%) |
| 65 to 74 Years | 436 (47.9%) | 472 (49.1%) |
| 75 Years and over | 166 (32.1%) | 228 (49.0%) |
Disability Class by Sex by Age in Clearlake
Disability Class: Hearing Difficulty
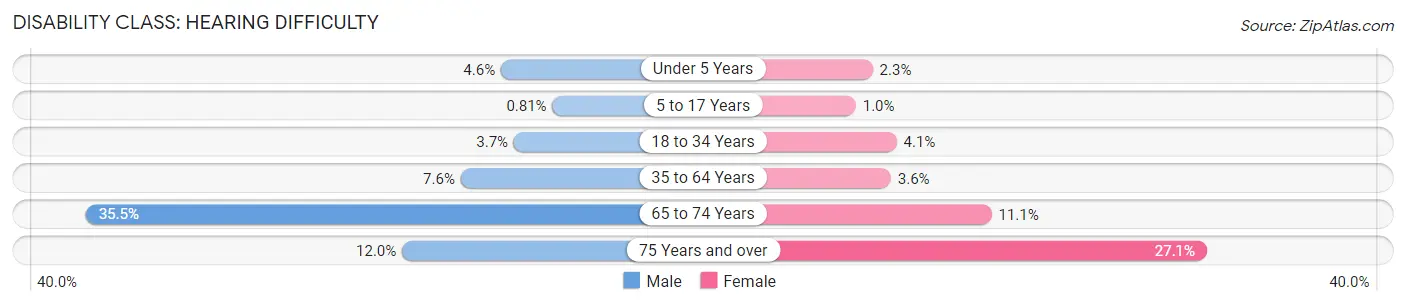
| Age Bracket | Male | Female |
| Under 5 Years | 10 (4.6%) | 15 (2.3%) |
| 5 to 17 Years | 16 (0.8%) | 16 (1.0%) |
| 18 to 34 Years | 60 (3.7%) | 64 (4.1%) |
| 35 to 64 Years | 224 (7.6%) | 114 (3.6%) |
| 65 to 74 Years | 323 (35.5%) | 107 (11.1%) |
| 75 Years and over | 62 (12.0%) | 126 (27.1%) |
Disability Class: Vision Difficulty
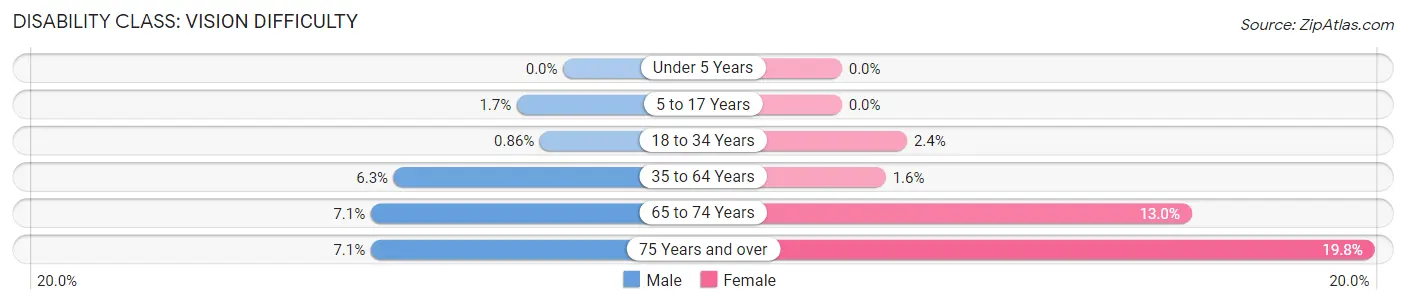
| Age Bracket | Male | Female |
| Under 5 Years | 0 (0.0%) | 0 (0.0%) |
| 5 to 17 Years | 34 (1.7%) | 0 (0.0%) |
| 18 to 34 Years | 14 (0.9%) | 38 (2.4%) |
| 35 to 64 Years | 185 (6.3%) | 51 (1.6%) |
| 65 to 74 Years | 65 (7.1%) | 125 (13.0%) |
| 75 Years and over | 37 (7.1%) | 92 (19.8%) |
Disability Class: Cognitive Difficulty
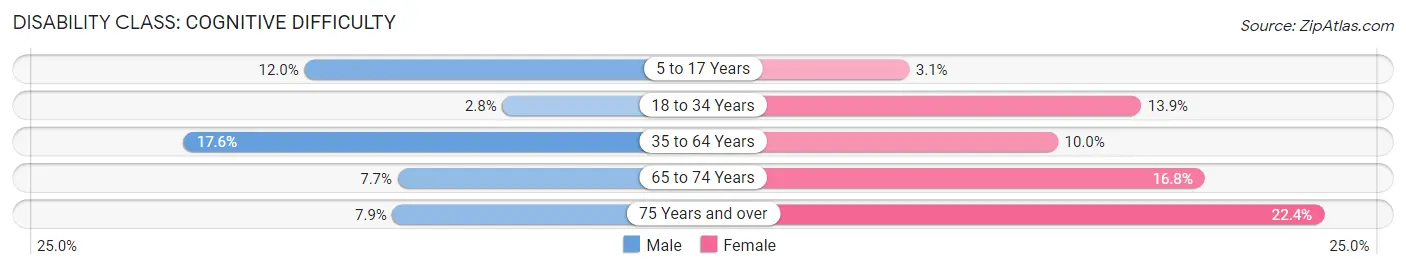
| Age Bracket | Male | Female |
| 5 to 17 Years | 237 (12.0%) | 48 (3.1%) |
| 18 to 34 Years | 46 (2.8%) | 218 (13.9%) |
| 35 to 64 Years | 518 (17.6%) | 314 (10.0%) |
| 65 to 74 Years | 70 (7.7%) | 162 (16.8%) |
| 75 Years and over | 41 (7.9%) | 104 (22.4%) |
Disability Class: Ambulatory Difficulty
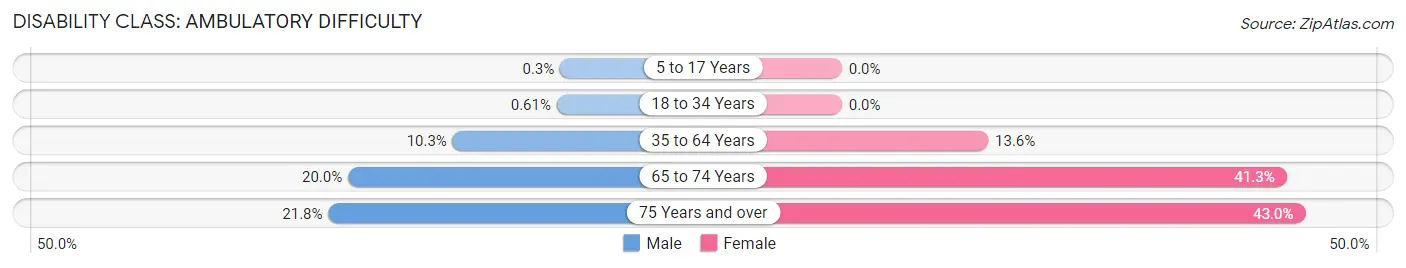
| Age Bracket | Male | Female |
| 5 to 17 Years | 6 (0.3%) | 0 (0.0%) |
| 18 to 34 Years | 10 (0.6%) | 0 (0.0%) |
| 35 to 64 Years | 302 (10.3%) | 426 (13.6%) |
| 65 to 74 Years | 182 (20.0%) | 397 (41.3%) |
| 75 Years and over | 113 (21.8%) | 200 (43.0%) |
Disability Class: Self-Care Difficulty
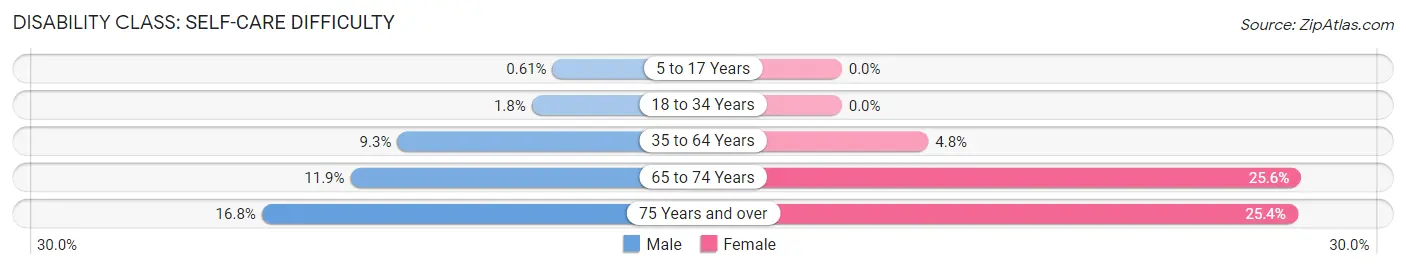
| Age Bracket | Male | Female |
| 5 to 17 Years | 12 (0.6%) | 0 (0.0%) |
| 18 to 34 Years | 29 (1.8%) | 0 (0.0%) |
| 35 to 64 Years | 272 (9.2%) | 151 (4.8%) |
| 65 to 74 Years | 108 (11.9%) | 246 (25.6%) |
| 75 Years and over | 87 (16.8%) | 118 (25.4%) |
Technology Access in Clearlake
Computing Device Access in Clearlake
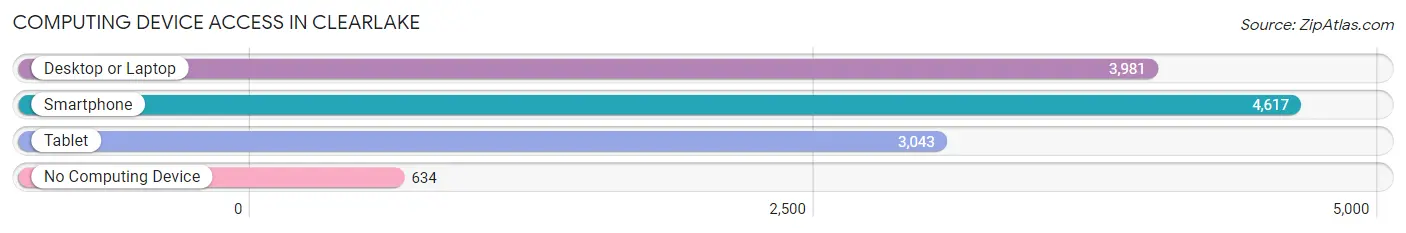
| Device Type | # Households | % Households |
| Desktop or Laptop | 3,981 | 68.1% |
| Smartphone | 4,617 | 79.0% |
| Tablet | 3,043 | 52.0% |
| No Computing Device | 634 | 10.8% |
| Total | 5,847 | 100.0% |
Internet Access in Clearlake
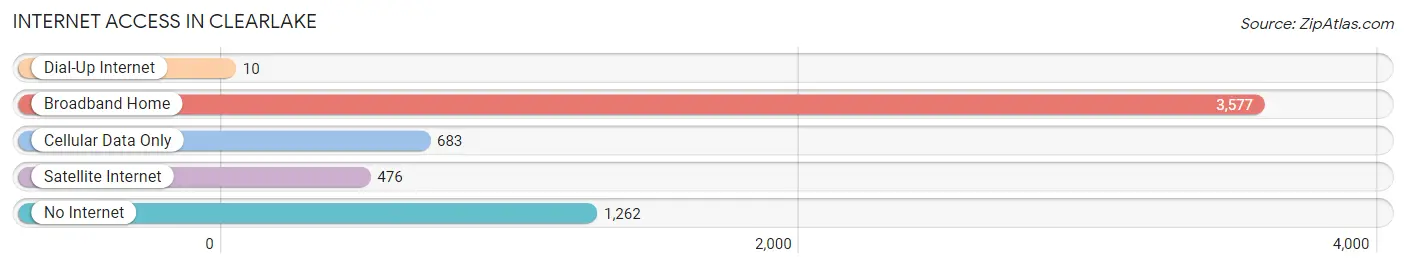
| Internet Type | # Households | % Households |
| Dial-Up Internet | 10 | 0.2% |
| Broadband Home | 3,577 | 61.2% |
| Cellular Data Only | 683 | 11.7% |
| Satellite Internet | 476 | 8.1% |
| No Internet | 1,262 | 21.6% |
| Total | 5,847 | 100.0% |
Clearlake Summary
Lake County, California is located in the northern part of the state, and is home to the city of Clearlake. Clearlake is the largest natural freshwater lake in California, and is the county seat of Lake County. The city is located in the Clear Lake Valley, and is surrounded by hills and mountains. The city has a population of approximately 15,000 people, and is the largest city in the county.
History
The area around Clearlake has been inhabited for thousands of years by the Pomo people. The first Europeans to explore the area were Spanish explorers in the late 1700s. The first permanent settlement in the area was established in 1867 by a group of settlers from the Midwest. The settlement was named Clearlake after the lake, and the city was incorporated in 1901.
The city grew rapidly in the early 20th century, and by the 1950s it had become a popular tourist destination. The city was also home to a thriving agricultural industry, and was known for its production of walnuts, pears, and other fruits and vegetables.
Geography
Clearlake is located in the Clear Lake Valley, which is surrounded by hills and mountains. The city is located at an elevation of 1,400 feet, and is situated on the shore of Clear Lake. The lake is the largest natural freshwater lake in California, and is approximately 20 miles long and 8 miles wide. The lake is fed by several creeks and streams, and is home to a variety of fish and wildlife.
The city is located in a Mediterranean climate zone, and has hot, dry summers and mild, wet winters. The average annual temperature is around 60 degrees Fahrenheit, and the average annual precipitation is around 20 inches.
Economy
The economy of Clearlake is largely based on tourism and agriculture. The city is home to several resorts and hotels, and is a popular destination for fishing, boating, and other outdoor activities. The city is also home to a thriving agricultural industry, and is known for its production of walnuts, pears, and other fruits and vegetables.
The city is also home to several manufacturing and technology companies, including a large solar panel manufacturing plant. The city is also home to a number of retail stores, restaurants, and other businesses.
Demographics
As of the 2010 census, the population of Clearlake was 15,250. The racial makeup of the city was 75.3% White, 0.9% African American, 1.2% Native American, 0.7% Asian, 0.1% Pacific Islander, 17.7% from other races, and 4.1% from two or more races. Hispanic or Latino of any race were 28.3% of the population.
The median income for a household in the city was $35,938, and the median income for a family was $41,938. The per capita income for the city was $17,938. About 17.7% of families and 22.2% of the population were below the poverty line, including 33.3% of those under age 18 and 8.3% of those age 65 or over.
Common Questions
What is Per Capita Income in Clearlake?
Per Capita income in Clearlake is $20,089.
What is the Median Family Income in Clearlake?
Median Family Income in Clearlake is $50,756.
What is the Median Household income in Clearlake?
Median Household Income in Clearlake is $41,047.
What is Income or Wage Gap in Clearlake?
Income or Wage Gap in Clearlake is 0.5%.
Women in Clearlake earn 99.5 cents for every dollar earned by a man.
What is Family Income Deficit in Clearlake?
Family Income Deficit in Clearlake is $11,144.
Families that are below poverty line in Clearlake earn $11,144 less on average than the poverty threshold level.
What is Inequality or Gini Index in Clearlake?
Inequality or Gini Index in Clearlake is 0.43.
What is the Total Population of Clearlake?
Total Population of Clearlake is 16,612.
What is the Total Male Population of Clearlake?
Total Male Population of Clearlake is 8,202.
What is the Total Female Population of Clearlake?
Total Female Population of Clearlake is 8,410.
What is the Ratio of Males per 100 Females in Clearlake?
There are 97.53 Males per 100 Females in Clearlake.
What is the Ratio of Females per 100 Males in Clearlake?
There are 102.54 Females per 100 Males in Clearlake.
What is the Median Population Age in Clearlake?
Median Population Age in Clearlake is 38.6 Years.
What is the Average Family Size in Clearlake
Average Family Size in Clearlake is 3.5 People.
What is the Average Household Size in Clearlake
Average Household Size in Clearlake is 2.8 People.
How Large is the Labor Force in Clearlake?
There are 6,142 People in the Labor Forcein in Clearlake.
What is the Percentage of People in the Labor Force in Clearlake?
48.2% of People are in the Labor Force in Clearlake.
What is the Unemployment Rate in Clearlake?
Unemployment Rate in Clearlake is 16.7%.