Cities with the Highest Poverty Level Among Seniors Over the Age of 75 in Ohio
RELATED REPORTS & OPTIONS
Highest Poverty | Seniors 75+
Ohio
Compare Cities
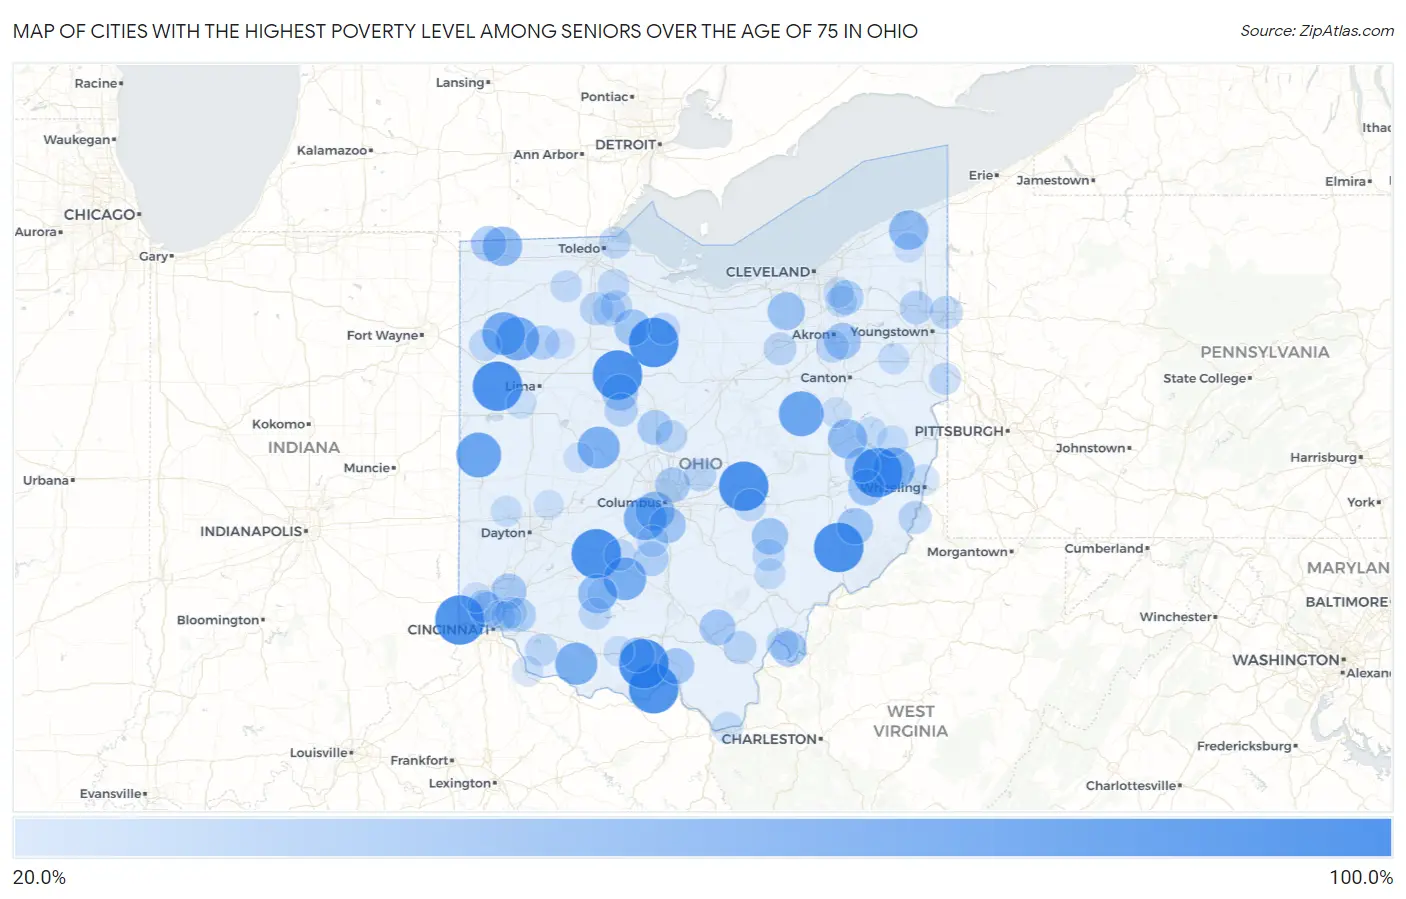
Map of Cities with the Highest Poverty Level Among Seniors Over the Age of 75 in Ohio
0.0%
100.0%
Cities with the Highest Poverty Level Among Seniors Over the Age of 75 in Ohio
| City | Senior Poverty | vs State | vs National | |
| 1. | South Mount Vernon | 100.0% | 9.7%(+90.3)#1 | 11.1%(+88.9)#43 |
| 2. | Friendship | 100.0% | 9.7%(+90.3)#2 | 11.1%(+88.9)#71 |
| 3. | Marne | 100.0% | 9.7%(+90.3)#3 | 11.1%(+88.9)#109 |
| 4. | Holloway | 100.0% | 9.7%(+90.3)#4 | 11.1%(+88.9)#110 |
| 5. | Elizabethtown | 100.0% | 9.7%(+90.3)#5 | 11.1%(+88.9)#136 |
| 6. | Brandt | 100.0% | 9.7%(+90.3)#6 | 11.1%(+88.9)#168 |
| 7. | Dexter City | 100.0% | 9.7%(+90.3)#7 | 11.1%(+88.9)#230 |
| 8. | East Alliance | 100.0% | 9.7%(+90.3)#8 | 11.1%(+88.9)#236 |
| 9. | Elgin | 100.0% | 9.7%(+90.3)#9 | 11.1%(+88.9)#240 |
| 10. | Melmore | 100.0% | 9.7%(+90.3)#10 | 11.1%(+88.9)#265 |
| 11. | Otway | 100.0% | 9.7%(+90.3)#11 | 11.1%(+88.9)#280 |
| 12. | Octa | 100.0% | 9.7%(+90.3)#12 | 11.1%(+88.9)#323 |
| 13. | Kirby | 100.0% | 9.7%(+90.3)#13 | 11.1%(+88.9)#330 |
| 14. | Berlin | 81.8% | 9.7%(+72.1)#14 | 11.1%(+70.8)#475 |
| 15. | Rossburg | 81.8% | 9.7%(+72.1)#15 | 11.1%(+70.8)#478 |
| 16. | Dupont | 75.6% | 9.7%(+65.8)#16 | 11.1%(+64.5)#546 |
| 17. | Melrose | 75.0% | 9.7%(+65.3)#17 | 11.1%(+63.9)#552 |
| 18. | Good Hope | 73.3% | 9.7%(+63.6)#18 | 11.1%(+62.3)#585 |
| 19. | Darbydale | 72.7% | 9.7%(+63.0)#19 | 11.1%(+61.7)#588 |
| 20. | Russellville | 71.8% | 9.7%(+62.1)#20 | 11.1%(+60.8)#601 |
| 21. | New Athens | 71.4% | 9.7%(+61.7)#21 | 11.1%(+60.4)#608 |
| 22. | East Liberty | 71.0% | 9.7%(+61.3)#22 | 11.1%(+59.9)#611 |
| 23. | Austinburg | 61.3% | 9.7%(+51.6)#23 | 11.1%(+50.3)#810 |
| 24. | Alvordton | 61.1% | 9.7%(+51.4)#24 | 11.1%(+50.0)#817 |
| 25. | Tuscarawas | 60.0% | 9.7%(+50.3)#25 | 11.1%(+48.9)#833 |
| 26. | Urbancrest | 60.0% | 9.7%(+50.3)#26 | 11.1%(+48.9)#834 |
| 27. | Highland | 58.8% | 9.7%(+49.1)#27 | 11.1%(+47.8)#892 |
| 28. | Massieville | 57.4% | 9.7%(+47.7)#28 | 11.1%(+46.4)#933 |
| 29. | Valley City | 53.7% | 9.7%(+44.0)#29 | 11.1%(+42.7)#1,073 |
| 30. | Sawyerwood | 50.4% | 9.7%(+40.7)#30 | 11.1%(+39.4)#1,170 |
| 31. | Bascom | 50.0% | 9.7%(+40.3)#31 | 11.1%(+38.9)#1,221 |
| 32. | Lockbourne | 50.0% | 9.7%(+40.3)#32 | 11.1%(+38.9)#1,228 |
| 33. | Summerfield | 50.0% | 9.7%(+40.3)#33 | 11.1%(+38.9)#1,243 |
| 34. | Rose Farm | 50.0% | 9.7%(+40.3)#34 | 11.1%(+38.9)#1,287 |
| 35. | Marseilles | 50.0% | 9.7%(+40.3)#35 | 11.1%(+38.9)#1,292 |
| 36. | Fairview | 50.0% | 9.7%(+40.3)#36 | 11.1%(+38.9)#1,308 |
| 37. | Clarktown | 48.3% | 9.7%(+38.6)#37 | 11.1%(+37.3)#1,358 |
| 38. | Wellston | 48.0% | 9.7%(+38.3)#38 | 11.1%(+36.9)#1,372 |
| 39. | Racine | 47.5% | 9.7%(+37.8)#39 | 11.1%(+36.4)#1,404 |
| 40. | Roachester | 47.1% | 9.7%(+37.3)#40 | 11.1%(+36.0)#1,432 |
| 41. | Skyline Acres | 46.6% | 9.7%(+36.9)#41 | 11.1%(+35.6)#1,467 |
| 42. | Wetherington | 46.2% | 9.7%(+36.4)#42 | 11.1%(+35.1)#1,485 |
| 43. | Freeport | 46.2% | 9.7%(+36.4)#43 | 11.1%(+35.1)#1,488 |
| 44. | Pioneer | 46.0% | 9.7%(+36.3)#44 | 11.1%(+35.0)#1,495 |
| 45. | Minerva Park | 44.4% | 9.7%(+34.7)#45 | 11.1%(+33.4)#1,582 |
| 46. | Waldo | 44.4% | 9.7%(+34.7)#46 | 11.1%(+33.4)#1,592 |
| 47. | Rarden | 44.4% | 9.7%(+34.7)#47 | 11.1%(+33.4)#1,596 |
| 48. | Williamsport | 42.9% | 9.7%(+33.1)#48 | 11.1%(+31.8)#1,684 |
| 49. | Camp Dennison | 41.9% | 9.7%(+32.2)#49 | 11.1%(+30.9)#1,769 |
| 50. | Reminderville | 41.9% | 9.7%(+32.1)#50 | 11.1%(+30.8)#1,772 |
| 51. | Glandorf | 41.3% | 9.7%(+31.5)#51 | 11.1%(+30.2)#1,820 |
| 52. | Morgandale | 39.0% | 9.7%(+29.2)#52 | 11.1%(+27.9)#2,027 |
| 53. | La Rue | 38.7% | 9.7%(+28.9)#53 | 11.1%(+27.6)#2,055 |
| 54. | West Hill | 37.5% | 9.7%(+27.8)#54 | 11.1%(+26.4)#2,158 |
| 55. | Jerry City | 37.5% | 9.7%(+27.8)#55 | 11.1%(+26.4)#2,166 |
| 56. | Vinton | 37.5% | 9.7%(+27.8)#56 | 11.1%(+26.4)#2,172 |
| 57. | Powhatan Point | 37.4% | 9.7%(+27.6)#57 | 11.1%(+26.3)#2,199 |
| 58. | Portage Lakes | 36.6% | 9.7%(+26.8)#58 | 11.1%(+25.5)#2,258 |
| 59. | Johnstown | 36.4% | 9.7%(+26.7)#59 | 11.1%(+25.4)#2,262 |
| 60. | Burbank | 36.4% | 9.7%(+26.6)#60 | 11.1%(+25.3)#2,280 |
| 61. | West Millgrove | 36.4% | 9.7%(+26.6)#61 | 11.1%(+25.3)#2,291 |
| 62. | Northgate | 36.1% | 9.7%(+26.4)#62 | 11.1%(+25.0)#2,307 |
| 63. | Syracuse | 35.0% | 9.7%(+25.3)#63 | 11.1%(+23.9)#2,410 |
| 64. | Corning | 35.0% | 9.7%(+25.3)#64 | 11.1%(+23.9)#2,414 |
| 65. | Ashley | 34.6% | 9.7%(+24.9)#65 | 11.1%(+23.5)#2,451 |
| 66. | Bethel | 34.5% | 9.7%(+24.8)#66 | 11.1%(+23.5)#2,461 |
| 67. | Brownsville | 33.9% | 9.7%(+24.1)#67 | 11.1%(+22.8)#2,525 |
| 68. | Hillsboro | 33.6% | 9.7%(+23.9)#68 | 11.1%(+22.6)#2,541 |
| 69. | Bloomingburg | 33.3% | 9.7%(+23.6)#69 | 11.1%(+22.3)#2,582 |
| 70. | Republic | 33.3% | 9.7%(+23.6)#70 | 11.1%(+22.3)#2,594 |
| 71. | Risingsun | 33.3% | 9.7%(+23.6)#71 | 11.1%(+22.3)#2,609 |
| 72. | Negley | 33.3% | 9.7%(+23.6)#72 | 11.1%(+22.3)#2,629 |
| 73. | Darbyville | 33.3% | 9.7%(+23.6)#73 | 11.1%(+22.3)#2,635 |
| 74. | Haviland | 33.3% | 9.7%(+23.6)#74 | 11.1%(+22.3)#2,651 |
| 75. | Harbor View | 33.3% | 9.7%(+23.6)#75 | 11.1%(+22.3)#2,688 |
| 76. | Pemberville | 32.6% | 9.7%(+22.9)#76 | 11.1%(+21.6)#2,774 |
| 77. | Grand Rapids | 32.6% | 9.7%(+22.8)#77 | 11.1%(+21.5)#2,778 |
| 78. | Concorde Hills | 32.5% | 9.7%(+22.8)#78 | 11.1%(+21.4)#2,782 |
| 79. | Twinsburg Heights | 32.3% | 9.7%(+22.5)#79 | 11.1%(+21.2)#2,812 |
| 80. | Chesapeake | 31.7% | 9.7%(+22.0)#80 | 11.1%(+20.7)#2,877 |
| 81. | Bowerston | 31.4% | 9.7%(+21.7)#81 | 11.1%(+20.4)#2,911 |
| 82. | Jewett | 31.2% | 9.7%(+21.5)#82 | 11.1%(+20.2)#2,932 |
| 83. | Martins Ferry | 30.8% | 9.7%(+21.0)#83 | 11.1%(+19.7)#2,982 |
| 84. | Golf Manor | 30.7% | 9.7%(+20.9)#84 | 11.1%(+19.6)#3,011 |
| 85. | Beloit | 30.3% | 9.7%(+20.5)#85 | 11.1%(+19.2)#3,076 |
| 86. | Phillipsburg | 30.0% | 9.7%(+20.3)#86 | 11.1%(+18.9)#3,119 |
| 87. | Jacksonville | 29.8% | 9.7%(+20.0)#87 | 11.1%(+18.7)#3,168 |
| 88. | Leesburg | 29.6% | 9.7%(+19.9)#88 | 11.1%(+18.6)#3,192 |
| 89. | Parral | 29.0% | 9.7%(+19.3)#89 | 11.1%(+18.0)#3,286 |
| 90. | Glenwillow | 28.9% | 9.7%(+19.1)#90 | 11.1%(+17.8)#3,301 |
| 91. | Neville | 28.6% | 9.7%(+18.8)#91 | 11.1%(+17.5)#3,385 |
| 92. | Peebles | 28.4% | 9.7%(+18.7)#92 | 11.1%(+17.4)#3,399 |
| 93. | Ross | 28.0% | 9.7%(+18.3)#93 | 11.1%(+17.0)#3,449 |
| 94. | Rock Creek | 28.0% | 9.7%(+18.3)#94 | 11.1%(+16.9)#3,460 |
| 95. | West Liberty | 27.7% | 9.7%(+18.0)#95 | 11.1%(+16.7)#3,516 |
| 96. | Silverton | 27.4% | 9.7%(+17.6)#96 | 11.1%(+16.3)#3,572 |
| 97. | Buckland | 27.3% | 9.7%(+17.5)#97 | 11.1%(+16.2)#3,601 |
| 98. | Gilboa | 27.3% | 9.7%(+17.5)#98 | 11.1%(+16.2)#3,606 |
| 99. | Newport Cdp Washington County | 26.8% | 9.7%(+17.0)#99 | 11.1%(+15.7)#3,708 |
| 100. | New Carlisle | 26.5% | 9.7%(+16.8)#100 | 11.1%(+15.4)#3,755 |
Common Questions
What are the Top 10 Cities with the Highest Poverty Level Among Seniors Over the Age of 75 in Ohio?
Top 10 Cities with the Highest Poverty Level Among Seniors Over the Age of 75 in Ohio are:
#1
100.0%
#2
100.0%
#3
100.0%
#4
100.0%
#5
100.0%
#6
100.0%
#7
100.0%
#8
100.0%
#9
100.0%
#10
100.0%
What city has the Highest Poverty Level Among Seniors Over the Age of 75 in Ohio?
Friendship has the Highest Poverty Level Among Seniors Over the Age of 75 in Ohio with 100.0%.
What is the Poverty Level Among Seniors Over the Age of 75 in the State of Ohio?
Poverty Level Among Seniors Over the Age of 75 in Ohio is 9.7%.
What is the Poverty Level Among Seniors Over the Age of 75 in the United States?
Poverty Level Among Seniors Over the Age of 75 in the United States is 11.1%.