Cities with the Highest Poverty Level Among Seniors Over the Age of 75 in Minnesota
RELATED REPORTS & OPTIONS
Highest Poverty | Seniors 75+
Minnesota
Compare Cities
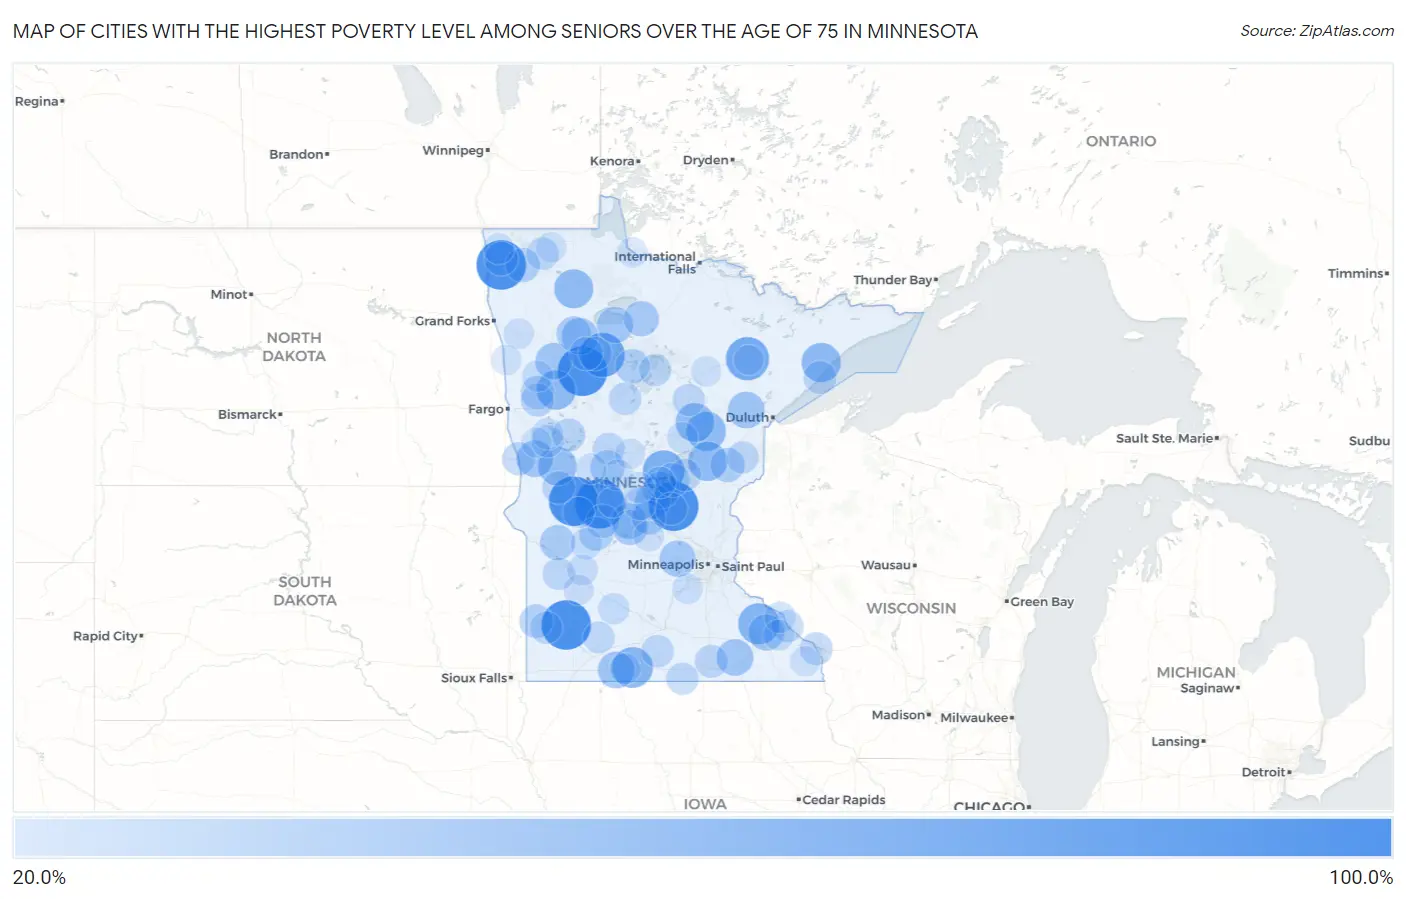
Map of Cities with the Highest Poverty Level Among Seniors Over the Age of 75 in Minnesota
0.0%
100.0%
Cities with the Highest Poverty Level Among Seniors Over the Age of 75 in Minnesota
| City | Senior Poverty | vs State | vs National | |
| 1. | Garvin | 100.0% | 9.5%(+90.5)#1 | 11.1%(+88.9)#253 |
| 2. | St Anthony City Stearns County | 100.0% | 9.5%(+90.5)#2 | 11.1%(+88.9)#311 |
| 3. | Ronneby | 100.0% | 9.5%(+90.5)#3 | 11.1%(+88.9)#315 |
| 4. | Westport | 100.0% | 9.5%(+90.5)#4 | 11.1%(+88.9)#333 |
| 5. | South End | 100.0% | 9.5%(+90.5)#5 | 11.1%(+88.9)#347 |
| 6. | Farwell | 100.0% | 9.5%(+90.5)#6 | 11.1%(+88.9)#355 |
| 7. | Donaldson | 100.0% | 9.5%(+90.5)#7 | 11.1%(+88.9)#391 |
| 8. | Solway | 80.0% | 9.5%(+70.5)#8 | 11.1%(+68.9)#494 |
| 9. | Leonidas | 75.0% | 9.5%(+65.5)#9 | 11.1%(+63.9)#569 |
| 10. | Harding | 70.0% | 9.5%(+60.5)#10 | 11.1%(+58.9)#623 |
| 11. | Hammond | 66.7% | 9.5%(+57.2)#11 | 11.1%(+55.6)#692 |
| 12. | Welcome | 65.8% | 9.5%(+56.3)#12 | 11.1%(+54.7)#716 |
| 13. | Mcgregor | 60.3% | 9.5%(+50.8)#13 | 11.1%(+49.3)#829 |
| 14. | Ogema | 60.0% | 9.5%(+50.5)#14 | 11.1%(+48.9)#847 |
| 15. | Finland | 60.0% | 9.5%(+50.5)#15 | 11.1%(+48.9)#853 |
| 16. | Mcgrath | 60.0% | 9.5%(+50.5)#16 | 11.1%(+48.9)#869 |
| 17. | Grygla | 59.1% | 9.5%(+49.6)#17 | 11.1%(+48.0)#883 |
| 18. | Palisade | 58.3% | 9.5%(+48.8)#18 | 11.1%(+47.3)#906 |
| 19. | Dalton | 57.1% | 9.5%(+47.7)#19 | 11.1%(+46.1)#945 |
| 20. | St. John's University | 53.8% | 9.5%(+44.4)#20 | 11.1%(+42.8)#1,066 |
| 21. | Buckman | 50.0% | 9.5%(+40.5)#21 | 11.1%(+38.9)#1,220 |
| 22. | Gonvick | 50.0% | 9.5%(+40.5)#22 | 11.1%(+38.9)#1,247 |
| 23. | Alpha | 50.0% | 9.5%(+40.5)#23 | 11.1%(+38.9)#1,274 |
| 24. | Foxhome | 50.0% | 9.5%(+40.5)#24 | 11.1%(+38.9)#1,275 |
| 25. | Brookston | 50.0% | 9.5%(+40.5)#25 | 11.1%(+38.9)#1,283 |
| 26. | Bejou | 50.0% | 9.5%(+40.5)#26 | 11.1%(+38.9)#1,290 |
| 27. | Sargeant | 50.0% | 9.5%(+40.5)#27 | 11.1%(+38.9)#1,311 |
| 28. | Redby | 48.4% | 9.5%(+38.9)#28 | 11.1%(+37.3)#1,352 |
| 29. | Delano | 48.2% | 9.5%(+38.7)#29 | 11.1%(+37.1)#1,363 |
| 30. | Elgin | 48.1% | 9.5%(+38.6)#30 | 11.1%(+37.0)#1,368 |
| 31. | Rice | 47.1% | 9.5%(+37.6)#31 | 11.1%(+36.0)#1,427 |
| 32. | St Martin | 45.8% | 9.5%(+36.3)#32 | 11.1%(+34.8)#1,506 |
| 33. | Kelliher | 45.0% | 9.5%(+35.5)#33 | 11.1%(+33.9)#1,557 |
| 34. | Roscoe | 44.4% | 9.5%(+35.0)#34 | 11.1%(+33.4)#1,598 |
| 35. | Holloway | 44.4% | 9.5%(+35.0)#35 | 11.1%(+33.4)#1,599 |
| 36. | Gully | 42.9% | 9.5%(+33.4)#36 | 11.1%(+31.8)#1,715 |
| 37. | Karlstad | 41.9% | 9.5%(+32.4)#37 | 11.1%(+30.9)#1,768 |
| 38. | Eagle Bend | 41.9% | 9.5%(+32.4)#38 | 11.1%(+30.8)#1,773 |
| 39. | Finlayson | 41.7% | 9.5%(+32.2)#39 | 11.1%(+30.6)#1,795 |
| 40. | Cass Lake | 40.9% | 9.5%(+31.4)#40 | 11.1%(+29.8)#1,844 |
| 41. | St Joseph | 40.8% | 9.5%(+31.3)#41 | 11.1%(+29.7)#1,850 |
| 42. | Sunburg | 40.0% | 9.5%(+30.5)#42 | 11.1%(+28.9)#1,951 |
| 43. | Hillman | 40.0% | 9.5%(+30.5)#43 | 11.1%(+28.9)#1,966 |
| 44. | Lake Benton | 38.9% | 9.5%(+29.4)#44 | 11.1%(+27.8)#2,033 |
| 45. | Kennedy | 38.5% | 9.5%(+29.0)#45 | 11.1%(+27.4)#2,082 |
| 46. | Shevlin | 38.5% | 9.5%(+29.0)#46 | 11.1%(+27.4)#2,083 |
| 47. | Brooten | 38.4% | 9.5%(+28.9)#47 | 11.1%(+27.3)#2,091 |
| 48. | Ulen | 37.8% | 9.5%(+28.3)#48 | 11.1%(+26.8)#2,140 |
| 49. | Bagley | 37.5% | 9.5%(+28.0)#49 | 11.1%(+26.4)#2,160 |
| 50. | Breckenridge | 36.8% | 9.5%(+27.3)#50 | 11.1%(+25.8)#2,233 |
| 51. | Hitterdal | 36.5% | 9.5%(+27.0)#51 | 11.1%(+25.5)#2,261 |
| 52. | Dent | 36.4% | 9.5%(+26.9)#52 | 11.1%(+25.3)#2,284 |
| 53. | Hollandale | 36.0% | 9.5%(+26.5)#53 | 11.1%(+24.9)#2,315 |
| 54. | Beaver Bay | 35.7% | 9.5%(+26.2)#54 | 11.1%(+24.6)#2,346 |
| 55. | Holdingford | 35.3% | 9.5%(+25.8)#55 | 11.1%(+24.2)#2,381 |
| 56. | Dakota | 35.3% | 9.5%(+25.8)#56 | 11.1%(+24.2)#2,388 |
| 57. | Barrett | 34.8% | 9.5%(+25.3)#57 | 11.1%(+23.7)#2,441 |
| 58. | Amboy | 34.7% | 9.5%(+25.2)#58 | 11.1%(+23.6)#2,446 |
| 59. | Greenbush | 34.2% | 9.5%(+24.8)#59 | 11.1%(+23.2)#2,489 |
| 60. | Akeley | 34.1% | 9.5%(+24.7)#60 | 11.1%(+23.1)#2,498 |
| 61. | Onamia | 33.7% | 9.5%(+24.2)#61 | 11.1%(+22.7)#2,536 |
| 62. | Foley | 33.5% | 9.5%(+24.1)#62 | 11.1%(+22.5)#2,551 |
| 63. | Kiester | 33.3% | 9.5%(+23.8)#63 | 11.1%(+22.3)#2,598 |
| 64. | Verndale | 33.3% | 9.5%(+23.8)#64 | 11.1%(+22.3)#2,608 |
| 65. | Ruthton | 33.3% | 9.5%(+23.8)#65 | 11.1%(+22.3)#2,661 |
| 66. | Boyd | 33.3% | 9.5%(+23.8)#66 | 11.1%(+22.3)#2,671 |
| 67. | Erhard | 33.3% | 9.5%(+23.8)#67 | 11.1%(+22.3)#2,678 |
| 68. | Bena | 33.3% | 9.5%(+23.8)#68 | 11.1%(+22.3)#2,682 |
| 69. | Minneiska | 33.3% | 9.5%(+23.8)#69 | 11.1%(+22.3)#2,701 |
| 70. | Bruno | 33.3% | 9.5%(+23.8)#70 | 11.1%(+22.3)#2,724 |
| 71. | Hill City | 32.7% | 9.5%(+23.2)#71 | 11.1%(+21.6)#2,772 |
| 72. | Jeffers | 31.6% | 9.5%(+22.1)#72 | 11.1%(+20.5)#2,896 |
| 73. | Pelican Rapids | 31.1% | 9.5%(+21.6)#73 | 11.1%(+20.0)#2,952 |
| 74. | Pierz | 31.0% | 9.5%(+21.5)#74 | 11.1%(+20.0)#2,954 |
| 75. | Starbuck | 30.2% | 9.5%(+20.7)#75 | 11.1%(+19.1)#3,084 |
| 76. | Murdock | 30.0% | 9.5%(+20.5)#76 | 11.1%(+18.9)#3,128 |
| 77. | Kellogg | 29.8% | 9.5%(+20.3)#77 | 11.1%(+18.7)#3,167 |
| 78. | Twin Valley | 29.8% | 9.5%(+20.3)#78 | 11.1%(+18.7)#3,171 |
| 79. | Morgan | 29.3% | 9.5%(+19.9)#79 | 11.1%(+18.3)#3,245 |
| 80. | Browerville | 29.0% | 9.5%(+19.5)#80 | 11.1%(+17.9)#3,291 |
| 81. | Hallock | 28.8% | 9.5%(+19.3)#81 | 11.1%(+17.7)#3,309 |
| 82. | Sobieski | 28.6% | 9.5%(+19.1)#82 | 11.1%(+17.5)#3,370 |
| 83. | Elba | 28.6% | 9.5%(+19.1)#83 | 11.1%(+17.5)#3,382 |
| 84. | Parkers Prairie | 28.2% | 9.5%(+18.7)#84 | 11.1%(+17.1)#3,434 |
| 85. | Aitkin | 28.1% | 9.5%(+18.6)#85 | 11.1%(+17.0)#3,443 |
| 86. | Sherburn | 27.8% | 9.5%(+18.3)#86 | 11.1%(+16.8)#3,487 |
| 87. | Maynard | 27.8% | 9.5%(+18.3)#87 | 11.1%(+16.7)#3,508 |
| 88. | Kimball | 27.6% | 9.5%(+18.1)#88 | 11.1%(+16.5)#3,532 |
| 89. | Crookston | 27.4% | 9.5%(+17.9)#89 | 11.1%(+16.4)#3,558 |
| 90. | Jordan | 27.0% | 9.5%(+17.6)#90 | 11.1%(+16.0)#3,653 |
| 91. | Wood Lake | 26.7% | 9.5%(+17.2)#91 | 11.1%(+15.6)#3,723 |
| 92. | Sauk Centre | 26.4% | 9.5%(+16.9)#92 | 11.1%(+15.3)#3,778 |
| 93. | Marble | 26.3% | 9.5%(+16.8)#93 | 11.1%(+15.2)#3,796 |
| 94. | Shelly | 26.3% | 9.5%(+16.8)#94 | 11.1%(+15.2)#3,808 |
| 95. | Motley | 26.1% | 9.5%(+16.6)#95 | 11.1%(+15.0)#3,852 |
| 96. | Baudette | 26.0% | 9.5%(+16.5)#96 | 11.1%(+15.0)#3,864 |
| 97. | Houston | 26.0% | 9.5%(+16.5)#97 | 11.1%(+14.9)#3,879 |
| 98. | Rothsay | 25.8% | 9.5%(+16.3)#98 | 11.1%(+14.7)#3,923 |
| 99. | Badger | 25.8% | 9.5%(+16.3)#99 | 11.1%(+14.7)#3,924 |
| 100. | Eveleth | 25.8% | 9.5%(+16.3)#100 | 11.1%(+14.7)#3,932 |
Common Questions
What are the Top 10 Cities with the Highest Poverty Level Among Seniors Over the Age of 75 in Minnesota?
Top 10 Cities with the Highest Poverty Level Among Seniors Over the Age of 75 in Minnesota are:
What city has the Highest Poverty Level Among Seniors Over the Age of 75 in Minnesota?
Garvin has the Highest Poverty Level Among Seniors Over the Age of 75 in Minnesota with 100.0%.
What is the Poverty Level Among Seniors Over the Age of 75 in the State of Minnesota?
Poverty Level Among Seniors Over the Age of 75 in Minnesota is 9.5%.
What is the Poverty Level Among Seniors Over the Age of 75 in the United States?
Poverty Level Among Seniors Over the Age of 75 in the United States is 11.1%.