Cities with the Highest Poverty Level Among Seniors Over the Age of 75 in Michigan
RELATED REPORTS & OPTIONS
Highest Poverty | Seniors 75+
Michigan
Compare Cities
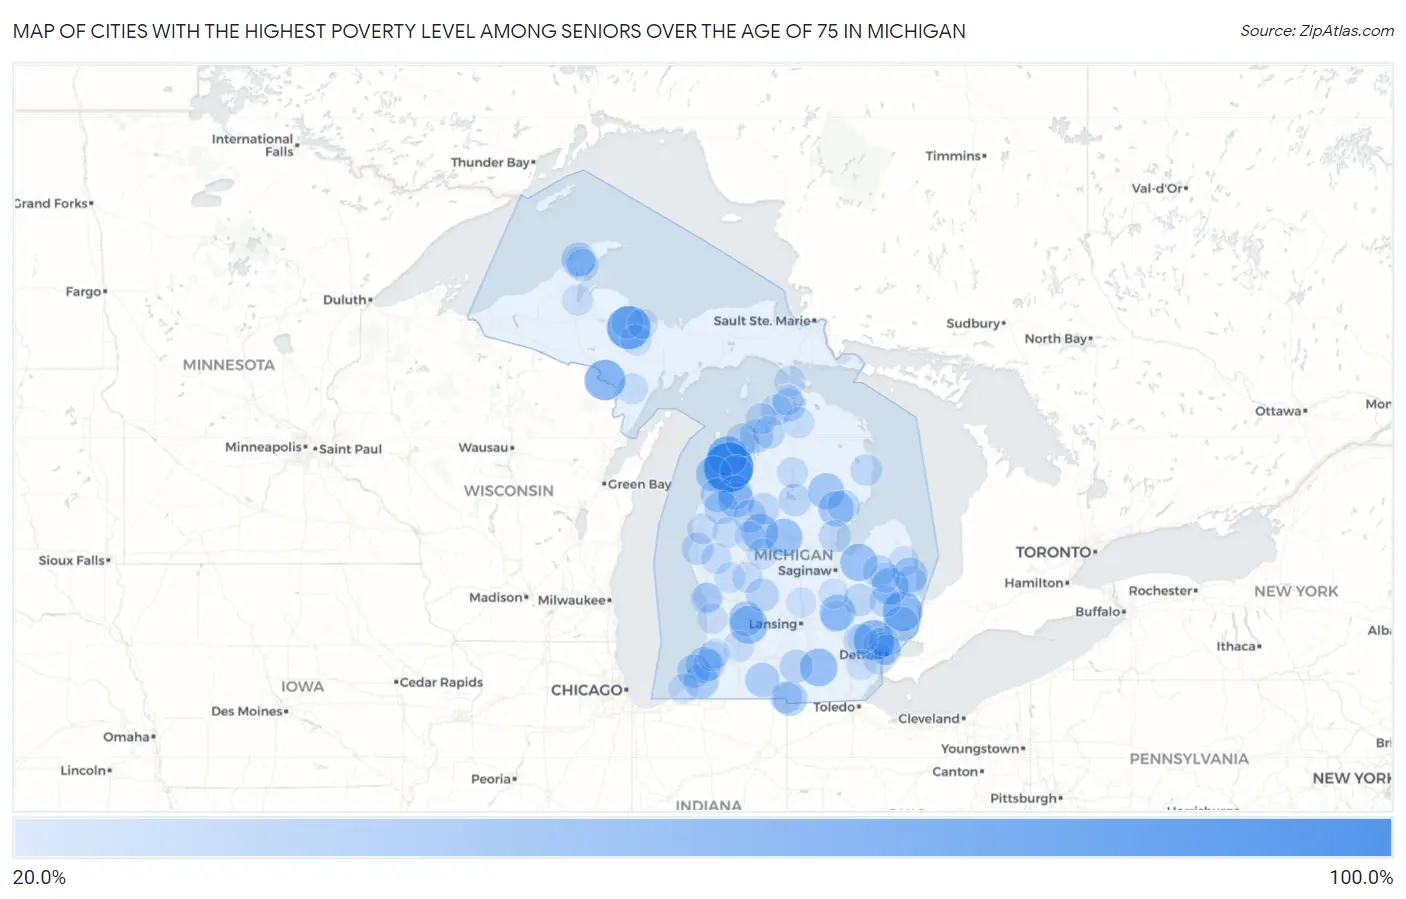
Map of Cities with the Highest Poverty Level Among Seniors Over the Age of 75 in Michigan
0.0%
100.0%
Cities with the Highest Poverty Level Among Seniors Over the Age of 75 in Michigan
| City | Senior Poverty | vs State | vs National | |
| 1. | Barnes Lake | 100.0% | 9.6%(+90.4)#1 | 11.1%(+88.9)#61 |
| 2. | Hardwood Acres | 100.0% | 9.6%(+90.4)#2 | 11.1%(+88.9)#74 |
| 3. | Mohawk | 100.0% | 9.6%(+90.4)#3 | 11.1%(+88.9)#158 |
| 4. | Eureka | 100.0% | 9.6%(+90.4)#4 | 11.1%(+88.9)#245 |
| 5. | Elm Hall | 82.1% | 9.6%(+72.4)#5 | 11.1%(+71.0)#473 |
| 6. | Mears | 76.9% | 9.6%(+67.3)#6 | 11.1%(+65.9)#528 |
| 7. | Palmer | 75.0% | 9.6%(+65.4)#7 | 11.1%(+63.9)#553 |
| 8. | Millburg | 64.5% | 9.6%(+54.9)#8 | 11.1%(+53.4)#726 |
| 9. | Quinnesec | 63.0% | 9.6%(+53.3)#9 | 11.1%(+51.9)#759 |
| 10. | Bingham Farms | 60.5% | 9.6%(+50.8)#10 | 11.1%(+49.4)#827 |
| 11. | Maple City | 60.0% | 9.6%(+50.4)#11 | 11.1%(+48.9)#854 |
| 12. | Memphis | 59.3% | 9.6%(+49.6)#12 | 11.1%(+48.2)#880 |
| 13. | Cambria | 58.3% | 9.6%(+48.7)#13 | 11.1%(+47.3)#904 |
| 14. | Middleville | 52.3% | 9.6%(+42.7)#14 | 11.1%(+41.2)#1,114 |
| 15. | Napoleon | 51.4% | 9.6%(+41.8)#15 | 11.1%(+40.4)#1,140 |
| 16. | Farwell | 50.7% | 9.6%(+41.1)#16 | 11.1%(+39.7)#1,164 |
| 17. | Fairgrove | 50.0% | 9.6%(+40.4)#17 | 11.1%(+38.9)#1,197 |
| 18. | Hurontown | 50.0% | 9.6%(+40.4)#18 | 11.1%(+38.9)#1,230 |
| 19. | Evart | 48.3% | 9.6%(+38.7)#19 | 11.1%(+37.2)#1,360 |
| 20. | Brown City | 47.6% | 9.6%(+38.0)#20 | 11.1%(+36.6)#1,393 |
| 21. | Falmouth | 45.7% | 9.6%(+36.1)#21 | 11.1%(+34.6)#1,512 |
| 22. | Rose City | 45.5% | 9.6%(+35.8)#22 | 11.1%(+34.4)#1,527 |
| 23. | Gaines | 44.4% | 9.6%(+34.8)#23 | 11.1%(+33.4)#1,590 |
| 24. | Beulah | 43.5% | 9.6%(+33.9)#24 | 11.1%(+32.4)#1,649 |
| 25. | Prescott | 42.1% | 9.6%(+32.5)#25 | 11.1%(+31.0)#1,752 |
| 26. | Watervliet | 41.9% | 9.6%(+32.3)#26 | 11.1%(+30.9)#1,766 |
| 27. | Harrietta | 41.7% | 9.6%(+32.0)#27 | 11.1%(+30.6)#1,794 |
| 28. | New Haven | 40.7% | 9.6%(+31.1)#28 | 11.1%(+29.6)#1,858 |
| 29. | Calumet | 40.7% | 9.6%(+31.1)#29 | 11.1%(+29.6)#1,860 |
| 30. | Eau Claire | 40.0% | 9.6%(+30.4)#30 | 11.1%(+28.9)#1,906 |
| 31. | Applegate | 40.0% | 9.6%(+30.4)#31 | 11.1%(+28.9)#1,929 |
| 32. | Caledonia | 39.6% | 9.6%(+30.0)#32 | 11.1%(+28.6)#1,979 |
| 33. | Camden | 38.5% | 9.6%(+28.8)#33 | 11.1%(+27.4)#2,073 |
| 34. | Sherwood | 38.5% | 9.6%(+28.8)#34 | 11.1%(+27.4)#2,074 |
| 35. | Mesick | 37.5% | 9.6%(+27.9)#35 | 11.1%(+26.4)#2,171 |
| 36. | Kaleva | 36.2% | 9.6%(+26.6)#36 | 11.1%(+25.1)#2,302 |
| 37. | Benton Harbor | 35.8% | 9.6%(+26.1)#37 | 11.1%(+24.7)#2,325 |
| 38. | Eastport | 35.6% | 9.6%(+26.0)#38 | 11.1%(+24.5)#2,356 |
| 39. | Crystal | 35.3% | 9.6%(+25.7)#39 | 11.1%(+24.2)#2,378 |
| 40. | Wellston | 35.3% | 9.6%(+25.7)#40 | 11.1%(+24.2)#2,390 |
| 41. | Concord | 33.9% | 9.6%(+24.3)#41 | 11.1%(+22.8)#2,522 |
| 42. | Belding | 33.3% | 9.6%(+23.7)#42 | 11.1%(+22.3)#2,560 |
| 43. | Omena | 33.3% | 9.6%(+23.7)#43 | 11.1%(+22.3)#2,640 |
| 44. | Brutus | 33.3% | 9.6%(+23.7)#44 | 11.1%(+22.3)#2,655 |
| 45. | Tustin | 33.3% | 9.6%(+23.7)#45 | 11.1%(+22.3)#2,657 |
| 46. | Highland Park | 32.2% | 9.6%(+22.5)#46 | 11.1%(+21.1)#2,822 |
| 47. | Whittemore | 31.0% | 9.6%(+21.4)#47 | 11.1%(+20.0)#2,957 |
| 48. | Prudenville | 31.0% | 9.6%(+21.3)#48 | 11.1%(+19.9)#2,967 |
| 49. | Negaunee | 30.8% | 9.6%(+21.2)#49 | 11.1%(+19.8)#2,980 |
| 50. | Kingston | 30.8% | 9.6%(+21.1)#50 | 11.1%(+19.7)#2,994 |
| 51. | East Jordan | 30.7% | 9.6%(+21.1)#51 | 11.1%(+19.6)#3,013 |
| 52. | Grawn | 30.6% | 9.6%(+21.0)#52 | 11.1%(+19.6)#3,016 |
| 53. | Davison | 30.3% | 9.6%(+20.7)#53 | 11.1%(+19.2)#3,073 |
| 54. | Pinconning | 30.1% | 9.6%(+20.5)#54 | 11.1%(+19.0)#3,089 |
| 55. | Lake Linden | 30.0% | 9.6%(+20.4)#55 | 11.1%(+18.9)#3,105 |
| 56. | Montgomery | 30.0% | 9.6%(+20.4)#56 | 11.1%(+18.9)#3,125 |
| 57. | Hart | 29.2% | 9.6%(+19.5)#57 | 11.1%(+18.1)#3,265 |
| 58. | Mcbain | 28.8% | 9.6%(+19.1)#58 | 11.1%(+17.7)#3,314 |
| 59. | Hartford | 28.2% | 9.6%(+18.6)#59 | 11.1%(+17.2)#3,423 |
| 60. | Harbor Springs | 27.9% | 9.6%(+18.3)#60 | 11.1%(+16.8)#3,483 |
| 61. | Imlay City | 27.8% | 9.6%(+18.2)#61 | 11.1%(+16.8)#3,488 |
| 62. | Lincoln | 27.8% | 9.6%(+18.2)#62 | 11.1%(+16.7)#3,510 |
| 63. | Charlevoix | 27.6% | 9.6%(+18.0)#63 | 11.1%(+16.6)#3,521 |
| 64. | Byron | 27.6% | 9.6%(+18.0)#64 | 11.1%(+16.5)#3,534 |
| 65. | Painesdale | 27.3% | 9.6%(+17.7)#65 | 11.1%(+16.2)#3,596 |
| 66. | Wixom | 27.0% | 9.6%(+17.4)#66 | 11.1%(+15.9)#3,665 |
| 67. | Grand Haven | 26.9% | 9.6%(+17.3)#67 | 11.1%(+15.8)#3,683 |
| 68. | Melvindale | 26.8% | 9.6%(+17.2)#68 | 11.1%(+15.8)#3,700 |
| 69. | Mackinaw City | 26.2% | 9.6%(+16.6)#69 | 11.1%(+15.2)#3,823 |
| 70. | Oak Park | 26.0% | 9.6%(+16.4)#70 | 11.1%(+15.0)#3,866 |
| 71. | Croswell | 25.8% | 9.6%(+16.2)#71 | 11.1%(+14.7)#3,913 |
| 72. | Scottville | 25.6% | 9.6%(+16.0)#72 | 11.1%(+14.6)#3,957 |
| 73. | Powers | 25.6% | 9.6%(+16.0)#73 | 11.1%(+14.5)#3,969 |
| 74. | Hesperia | 25.3% | 9.6%(+15.7)#74 | 11.1%(+14.2)#4,016 |
| 75. | Grayling | 25.2% | 9.6%(+15.5)#75 | 11.1%(+14.1)#4,042 |
| 76. | Plainwell | 25.0% | 9.6%(+15.4)#76 | 11.1%(+13.9)#4,055 |
| 77. | Baraga | 25.0% | 9.6%(+15.4)#77 | 11.1%(+13.9)#4,062 |
| 78. | Pellston | 25.0% | 9.6%(+15.4)#78 | 11.1%(+13.9)#4,081 |
| 79. | Wolverine | 25.0% | 9.6%(+15.4)#79 | 11.1%(+13.9)#4,142 |
| 80. | Pierson | 25.0% | 9.6%(+15.4)#80 | 11.1%(+13.9)#4,164 |
| 81. | Gwinn | 24.8% | 9.6%(+15.2)#81 | 11.1%(+13.8)#4,217 |
| 82. | Grant | 24.7% | 9.6%(+15.0)#82 | 11.1%(+13.6)#4,243 |
| 83. | Baldwin | 23.9% | 9.6%(+14.3)#83 | 11.1%(+12.8)#4,387 |
| 84. | Hamtramck | 23.9% | 9.6%(+14.3)#84 | 11.1%(+12.8)#4,397 |
| 85. | Hersey | 23.8% | 9.6%(+14.2)#85 | 11.1%(+12.7)#4,424 |
| 86. | Shorewood Tower Hills Harbert | 23.7% | 9.6%(+14.1)#86 | 11.1%(+12.7)#4,448 |
| 87. | Beechwood | 23.6% | 9.6%(+13.9)#87 | 11.1%(+12.5)#4,494 |
| 88. | Madison Heights | 23.3% | 9.6%(+13.7)#88 | 11.1%(+12.2)#4,565 |
| 89. | Harvey | 23.3% | 9.6%(+13.7)#89 | 11.1%(+12.2)#4,566 |
| 90. | Deckerville | 23.1% | 9.6%(+13.5)#90 | 11.1%(+12.0)#4,610 |
| 91. | Mecosta | 23.1% | 9.6%(+13.5)#91 | 11.1%(+12.0)#4,617 |
| 92. | Walled Lake | 22.7% | 9.6%(+13.1)#92 | 11.1%(+11.6)#4,742 |
| 93. | Marlette | 22.7% | 9.6%(+13.0)#93 | 11.1%(+11.6)#4,745 |
| 94. | Belleville | 22.4% | 9.6%(+12.8)#94 | 11.1%(+11.4)#4,820 |
| 95. | Breedsville | 22.2% | 9.6%(+12.6)#95 | 11.1%(+11.2)#4,890 |
| 96. | Bangor | 22.1% | 9.6%(+12.5)#96 | 11.1%(+11.0)#4,949 |
| 97. | St Johns | 22.0% | 9.6%(+12.4)#97 | 11.1%(+11.0)#4,957 |
| 98. | New Lothrop | 22.0% | 9.6%(+12.3)#98 | 11.1%(+10.9)#4,979 |
| 99. | Laurium | 21.8% | 9.6%(+12.2)#99 | 11.1%(+10.8)#5,015 |
| 100. | Spring Lake | 21.8% | 9.6%(+12.2)#100 | 11.1%(+10.7)#5,027 |
Common Questions
What are the Top 10 Cities with the Highest Poverty Level Among Seniors Over the Age of 75 in Michigan?
Top 10 Cities with the Highest Poverty Level Among Seniors Over the Age of 75 in Michigan are:
#1
100.0%
#2
75.0%
#3
63.0%
#4
60.5%
#5
60.0%
#6
59.3%
#7
52.3%
#8
51.4%
#9
50.7%
#10
50.0%
What city has the Highest Poverty Level Among Seniors Over the Age of 75 in Michigan?
Hardwood Acres has the Highest Poverty Level Among Seniors Over the Age of 75 in Michigan with 100.0%.
What is the Poverty Level Among Seniors Over the Age of 75 in the State of Michigan?
Poverty Level Among Seniors Over the Age of 75 in Michigan is 9.6%.
What is the Poverty Level Among Seniors Over the Age of 75 in the United States?
Poverty Level Among Seniors Over the Age of 75 in the United States is 11.1%.