Cities with the Highest Poverty Level Among Seniors Over the Age of 75 in Oregon
RELATED REPORTS & OPTIONS
Highest Poverty | Seniors 75+
Oregon
Compare Cities
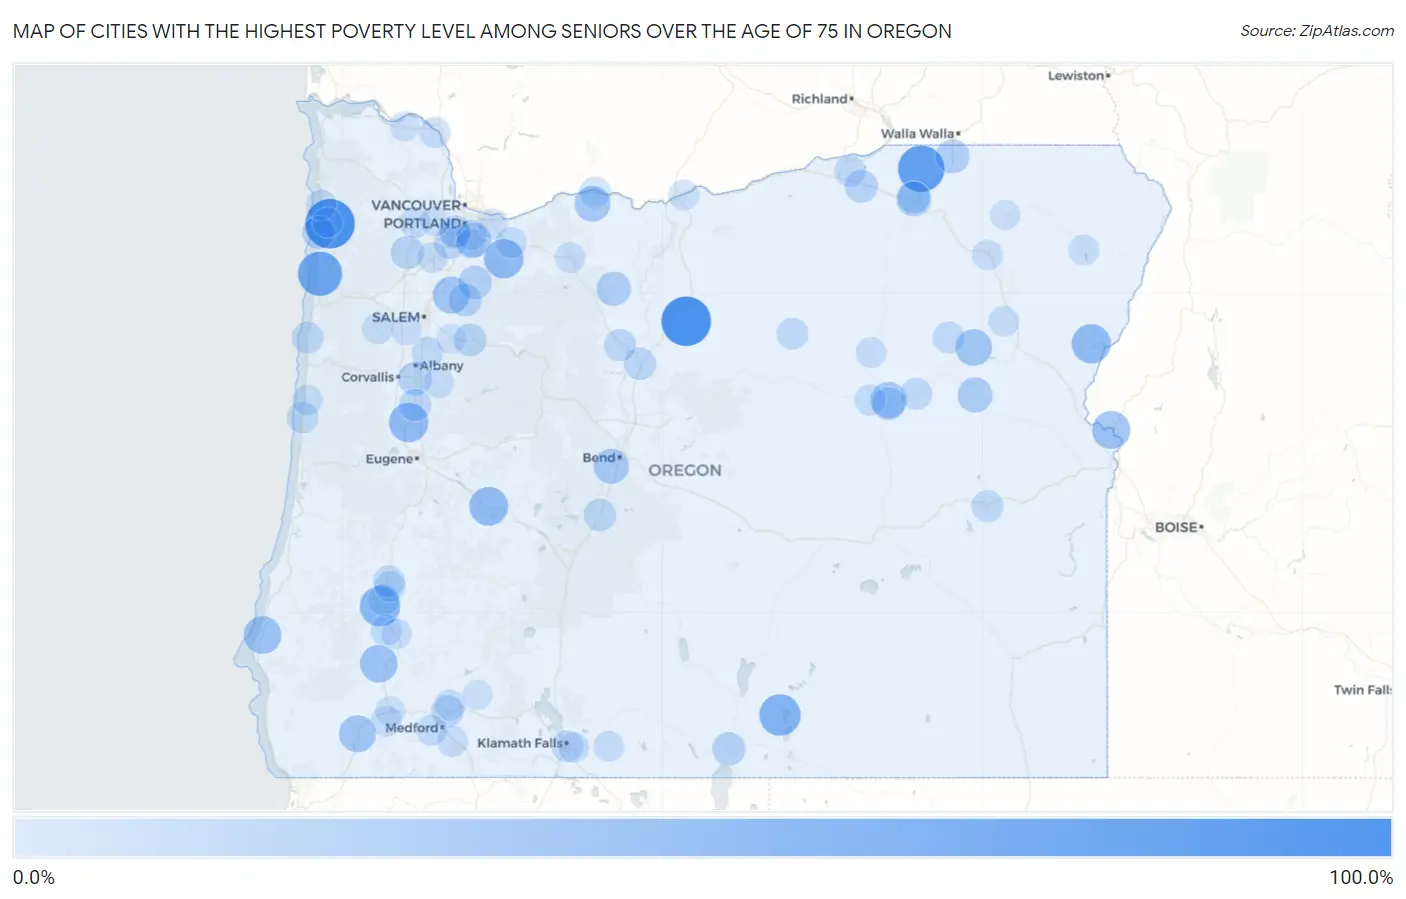
Map of Cities with the Highest Poverty Level Among Seniors Over the Age of 75 in Oregon
0.0%
100.0%
Cities with the Highest Poverty Level Among Seniors Over the Age of 75 in Oregon
| City | Senior Poverty | vs State | vs National | |
| 1. | Idaville | 100.0% | 9.6%(+90.4)#1 | 11.1%(+88.9)#199 |
| 2. | Antelope | 100.0% | 9.6%(+90.4)#2 | 11.1%(+88.9)#289 |
| 3. | Helix | 85.7% | 9.6%(+76.1)#3 | 11.1%(+74.6)#444 |
| 4. | Pacific City | 75.4% | 9.6%(+65.9)#4 | 11.1%(+64.4)#547 |
| 5. | Plush | 62.5% | 9.6%(+52.9)#5 | 11.1%(+51.4)#776 |
| 6. | Dillard | 58.1% | 9.6%(+48.6)#6 | 11.1%(+47.1)#912 |
| 7. | Harrisburg | 53.3% | 9.6%(+43.7)#7 | 11.1%(+42.2)#1,089 |
| 8. | Estacada | 52.9% | 9.6%(+43.4)#8 | 11.1%(+41.9)#1,099 |
| 9. | Richland | 52.4% | 9.6%(+42.8)#9 | 11.1%(+41.3)#1,112 |
| 10. | Oakridge | 50.6% | 9.6%(+41.0)#10 | 11.1%(+39.5)#1,167 |
| 11. | Bly | 50.0% | 9.6%(+40.4)#11 | 11.1%(+38.9)#1,268 |
| 12. | Annex | 46.7% | 9.6%(+37.1)#12 | 11.1%(+35.6)#1,456 |
| 13. | Langlois | 45.3% | 9.6%(+35.7)#13 | 11.1%(+34.2)#1,542 |
| 14. | Glendale | 44.8% | 9.6%(+35.2)#14 | 11.1%(+33.8)#1,562 |
| 15. | River Point | 43.5% | 9.6%(+33.9)#15 | 11.1%(+32.4)#1,648 |
| 16. | Mount Angel | 42.3% | 9.6%(+32.7)#16 | 11.1%(+31.3)#1,737 |
| 17. | Selma | 42.0% | 9.6%(+32.4)#17 | 11.1%(+30.9)#1,763 |
| 18. | Sumpter | 40.5% | 9.6%(+31.0)#18 | 11.1%(+29.5)#1,867 |
| 19. | John Day | 38.6% | 9.6%(+29.0)#19 | 11.1%(+27.5)#2,063 |
| 20. | Odell | 36.8% | 9.6%(+27.2)#20 | 11.1%(+25.7)#2,241 |
| 21. | Oatfield | 34.6% | 9.6%(+25.0)#21 | 11.1%(+23.5)#2,456 |
| 22. | Gopher Flats | 34.1% | 9.6%(+24.6)#22 | 11.1%(+23.1)#2,497 |
| 23. | Seventh Mountain | 33.9% | 9.6%(+24.3)#23 | 11.1%(+22.9)#2,520 |
| 24. | Unity | 33.3% | 9.6%(+23.8)#24 | 11.1%(+22.3)#2,726 |
| 25. | Oregon Shores | 32.5% | 9.6%(+23.0)#25 | 11.1%(+21.5)#2,781 |
| 26. | Pine Grove | 31.2% | 9.6%(+21.7)#26 | 11.1%(+20.2)#2,938 |
| 27. | Milton Freewater | 29.7% | 9.6%(+20.1)#27 | 11.1%(+18.6)#3,182 |
| 28. | Falcon Heights | 27.9% | 9.6%(+18.3)#28 | 11.1%(+16.8)#3,477 |
| 29. | Tangent | 27.8% | 9.6%(+18.2)#29 | 11.1%(+16.7)#3,497 |
| 30. | Molalla | 27.7% | 9.6%(+18.1)#30 | 11.1%(+16.6)#3,518 |
| 31. | Saunders Lake | 26.7% | 9.6%(+17.2)#31 | 11.1%(+15.7)#3,710 |
| 32. | Lakeview | 26.5% | 9.6%(+16.9)#32 | 11.1%(+15.4)#3,758 |
| 33. | Yamhill | 25.6% | 9.6%(+16.0)#33 | 11.1%(+14.5)#3,966 |
| 34. | Canyon City | 25.3% | 9.6%(+15.7)#34 | 11.1%(+14.2)#4,019 |
| 35. | Echo | 25.0% | 9.6%(+15.4)#35 | 11.1%(+13.9)#4,102 |
| 36. | Oceanside | 25.0% | 9.6%(+15.4)#36 | 11.1%(+13.9)#4,103 |
| 37. | Scotts Mills | 25.0% | 9.6%(+15.4)#37 | 11.1%(+13.9)#4,108 |
| 38. | Mapleton | 24.2% | 9.6%(+14.6)#38 | 11.1%(+13.1)#4,329 |
| 39. | Mehama | 23.5% | 9.6%(+13.9)#39 | 11.1%(+12.5)#4,506 |
| 40. | Keno | 23.2% | 9.6%(+13.6)#40 | 11.1%(+12.1)#4,589 |
| 41. | Madras | 22.3% | 9.6%(+12.8)#41 | 11.1%(+11.3)#4,835 |
| 42. | La Pine | 22.3% | 9.6%(+12.8)#42 | 11.1%(+11.3)#4,836 |
| 43. | White City | 22.0% | 9.6%(+12.4)#43 | 11.1%(+10.9)#4,965 |
| 44. | Halsey | 22.0% | 9.6%(+12.4)#44 | 11.1%(+10.9)#4,975 |
| 45. | King City | 21.7% | 9.6%(+12.1)#45 | 11.1%(+10.6)#5,062 |
| 46. | Warm Springs | 21.4% | 9.6%(+11.8)#46 | 11.1%(+10.4)#5,120 |
| 47. | Riverside | 21.4% | 9.6%(+11.8)#47 | 11.1%(+10.4)#5,141 |
| 48. | Jasper | 20.5% | 9.6%(+10.9)#48 | 11.1%(+9.39)#5,451 |
| 49. | Depoe Bay | 20.4% | 9.6%(+10.8)#49 | 11.1%(+9.31)#5,468 |
| 50. | Svensen | 20.3% | 9.6%(+10.7)#50 | 11.1%(+9.25)#5,493 |
| 51. | Rocky Point | 20.0% | 9.6%(+10.4)#51 | 11.1%(+8.93)#5,640 |
| 52. | Spray | 20.0% | 9.6%(+10.4)#52 | 11.1%(+8.93)#5,664 |
| 53. | Juntura | 20.0% | 9.6%(+10.4)#53 | 11.1%(+8.93)#5,714 |
| 54. | Granite | 20.0% | 9.6%(+10.4)#54 | 11.1%(+8.93)#5,716 |
| 55. | Roseburg North | 19.9% | 9.6%(+10.3)#55 | 11.1%(+8.82)#5,734 |
| 56. | Klamath Falls | 19.6% | 9.6%(+10.0)#56 | 11.1%(+8.55)#5,814 |
| 57. | Prairie City | 19.5% | 9.6%(+9.90)#57 | 11.1%(+8.41)#5,857 |
| 58. | Garden Home Whitford | 19.3% | 9.6%(+9.72)#58 | 11.1%(+8.23)#5,937 |
| 59. | Jefferson | 19.2% | 9.6%(+9.60)#59 | 11.1%(+8.11)#5,996 |
| 60. | Yachats | 19.0% | 9.6%(+9.39)#60 | 11.1%(+7.91)#6,074 |
| 61. | Green | 18.8% | 9.6%(+9.18)#61 | 11.1%(+7.69)#6,149 |
| 62. | Hood River | 18.4% | 9.6%(+8.80)#62 | 11.1%(+7.31)#6,309 |
| 63. | Hermiston | 18.3% | 9.6%(+8.77)#63 | 11.1%(+7.28)#6,327 |
| 64. | Riddle | 18.0% | 9.6%(+8.42)#64 | 11.1%(+6.93)#6,517 |
| 65. | Forest Grove | 17.5% | 9.6%(+7.96)#65 | 11.1%(+6.47)#6,735 |
| 66. | Sandy | 17.5% | 9.6%(+7.91)#66 | 11.1%(+6.42)#6,751 |
| 67. | Roseburg | 17.4% | 9.6%(+7.79)#67 | 11.1%(+6.31)#6,801 |
| 68. | Mount Vernon | 17.2% | 9.6%(+7.62)#68 | 11.1%(+6.14)#6,875 |
| 69. | Rainier | 16.3% | 9.6%(+6.77)#69 | 11.1%(+5.28)#7,345 |
| 70. | Jacksonville | 16.3% | 9.6%(+6.72)#70 | 11.1%(+5.24)#7,364 |
| 71. | Eagle Point | 16.3% | 9.6%(+6.70)#71 | 11.1%(+5.21)#7,371 |
| 72. | Talent | 16.1% | 9.6%(+6.52)#72 | 11.1%(+5.03)#7,466 |
| 73. | Long Creek | 16.0% | 9.6%(+6.42)#73 | 11.1%(+4.93)#7,533 |
| 74. | Haines | 15.9% | 9.6%(+6.33)#74 | 11.1%(+4.84)#7,577 |
| 75. | Rockaway Beach | 15.8% | 9.6%(+6.26)#75 | 11.1%(+4.77)#7,601 |
| 76. | Falls City | 15.8% | 9.6%(+6.21)#76 | 11.1%(+4.72)#7,623 |
| 77. | Metzger | 15.8% | 9.6%(+6.18)#77 | 11.1%(+4.70)#7,654 |
| 78. | Waldport | 15.2% | 9.6%(+5.65)#78 | 11.1%(+4.16)#7,936 |
| 79. | Newberg | 15.0% | 9.6%(+5.43)#79 | 11.1%(+3.94)#8,045 |
| 80. | Lebanon | 15.0% | 9.6%(+5.43)#80 | 11.1%(+3.94)#8,047 |
| 81. | Bonanza | 14.9% | 9.6%(+5.34)#81 | 11.1%(+3.86)#8,103 |
| 82. | Altamont | 14.8% | 9.6%(+5.26)#82 | 11.1%(+3.77)#8,141 |
| 83. | New Hope | 14.8% | 9.6%(+5.23)#83 | 11.1%(+3.75)#8,160 |
| 84. | Joseph | 14.8% | 9.6%(+5.23)#84 | 11.1%(+3.75)#8,162 |
| 85. | Government Camp | 14.8% | 9.6%(+5.23)#85 | 11.1%(+3.75)#8,178 |
| 86. | Rufus | 14.7% | 9.6%(+5.13)#86 | 11.1%(+3.64)#8,246 |
| 87. | La Grande | 14.7% | 9.6%(+5.12)#87 | 11.1%(+3.63)#8,248 |
| 88. | Independence | 14.6% | 9.6%(+4.99)#88 | 11.1%(+3.50)#8,333 |
| 89. | Canyonville | 14.0% | 9.6%(+4.39)#89 | 11.1%(+2.91)#8,749 |
| 90. | Running Y Ranch | 13.9% | 9.6%(+4.29)#90 | 11.1%(+2.80)#8,808 |
| 91. | Milwaukie | 13.6% | 9.6%(+4.01)#91 | 11.1%(+2.52)#9,006 |
| 92. | Jennings Lodge | 13.2% | 9.6%(+3.66)#92 | 11.1%(+2.17)#9,265 |
| 93. | Grants Pass | 13.2% | 9.6%(+3.63)#93 | 11.1%(+2.14)#9,282 |
| 94. | Elgin | 13.2% | 9.6%(+3.61)#94 | 11.1%(+2.13)#9,302 |
| 95. | Butte Falls | 13.2% | 9.6%(+3.58)#95 | 11.1%(+2.09)#9,330 |
| 96. | Clatskanie | 13.0% | 9.6%(+3.46)#96 | 11.1%(+1.98)#9,394 |
| 97. | Stayton | 12.9% | 9.6%(+3.37)#97 | 11.1%(+1.88)#9,477 |
| 98. | Hillsboro | 12.8% | 9.6%(+3.22)#98 | 11.1%(+1.73)#9,588 |
| 99. | Gresham | 12.7% | 9.6%(+3.12)#99 | 11.1%(+1.63)#9,664 |
| 100. | Bay City | 12.5% | 9.6%(+2.92)#100 | 11.1%(+1.43)#9,787 |
Common Questions
What are the Top 10 Cities with the Highest Poverty Level Among Seniors Over the Age of 75 in Oregon?
Top 10 Cities with the Highest Poverty Level Among Seniors Over the Age of 75 in Oregon are:
#1
100.0%
#2
100.0%
#3
85.7%
#4
75.4%
#5
62.5%
#6
58.1%
#7
53.3%
#8
52.9%
#9
52.4%
#10
50.6%
What city has the Highest Poverty Level Among Seniors Over the Age of 75 in Oregon?
Idaville has the Highest Poverty Level Among Seniors Over the Age of 75 in Oregon with 100.0%.
What is the Poverty Level Among Seniors Over the Age of 75 in the State of Oregon?
Poverty Level Among Seniors Over the Age of 75 in Oregon is 9.6%.
What is the Poverty Level Among Seniors Over the Age of 75 in the United States?
Poverty Level Among Seniors Over the Age of 75 in the United States is 11.1%.