Cities with the Highest Poverty Level Among Seniors Over the Age of 75 in Connecticut
RELATED REPORTS & OPTIONS
Highest Poverty | Seniors 75+
Connecticut
Compare Cities
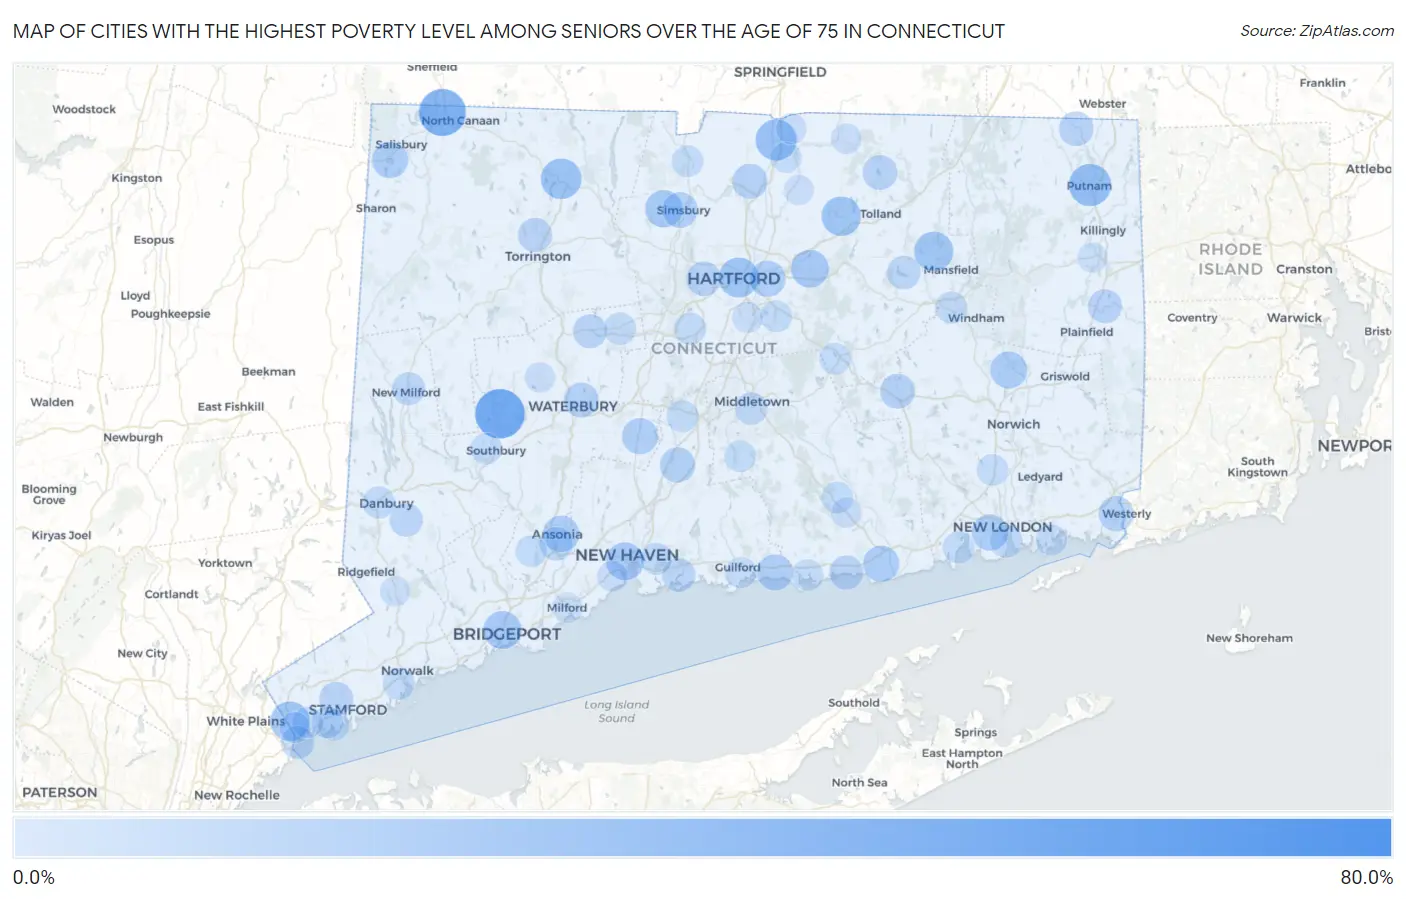
Map of Cities with the Highest Poverty Level Among Seniors Over the Age of 75 in Connecticut
0.0%
80.0%
Cities with the Highest Poverty Level Among Seniors Over the Age of 75 in Connecticut
| City | Senior Poverty | vs State | vs National | |
| 1. | Danielson Borough | 62.4% | 8.8%(+53.6)#1 | 11.1%(+51.3)#779 |
| 2. | Topstone | 56.5% | 8.8%(+47.7)#2 | 11.1%(+45.5)#968 |
| 3. | Indian Field | 50.0% | 8.8%(+41.2)#3 | 11.1%(+38.9)#1,202 |
| 4. | Woodbury Center | 44.4% | 8.8%(+35.6)#4 | 11.1%(+33.4)#1,585 |
| 5. | Taylor Corners | 39.1% | 8.8%(+30.2)#5 | 11.1%(+28.0)#2,022 |
| 6. | Canaan | 39.0% | 8.8%(+30.2)#6 | 11.1%(+27.9)#2,025 |
| 7. | Putnam | 29.1% | 8.8%(+20.3)#7 | 11.1%(+18.1)#3,273 |
| 8. | Thompsonville | 27.3% | 8.8%(+18.5)#8 | 11.1%(+16.2)#3,579 |
| 9. | Winsted | 26.0% | 8.8%(+17.2)#9 | 11.1%(+15.0)#3,867 |
| 10. | Inglenook | 25.8% | 8.8%(+17.0)#10 | 11.1%(+14.7)#3,917 |
| 11. | Hartford | 24.6% | 8.8%(+15.8)#11 | 11.1%(+13.5)#4,256 |
| 12. | Glenville | 23.7% | 8.8%(+14.9)#12 | 11.1%(+12.7)#4,450 |
| 13. | Rockville | 23.4% | 8.8%(+14.6)#13 | 11.1%(+12.4)#4,532 |
| 14. | Storrs | 23.1% | 8.8%(+14.3)#14 | 11.1%(+12.0)#4,603 |
| 15. | Bantam Borough | 21.3% | 8.8%(+12.5)#15 | 11.1%(+10.2)#5,186 |
| 16. | Cornwall Bridge | 20.8% | 8.8%(+12.0)#16 | 11.1%(+9.77)#5,322 |
| 17. | Bridgeport | 20.4% | 8.8%(+11.5)#17 | 11.1%(+9.30)#5,474 |
| 18. | New Haven | 20.3% | 8.8%(+11.4)#18 | 11.1%(+9.20)#5,508 |
| 19. | Manchester | 20.2% | 8.8%(+11.3)#19 | 11.1%(+9.10)#5,531 |
| 20. | West Simsbury | 19.5% | 8.8%(+10.7)#20 | 11.1%(+8.41)#5,860 |
| 21. | Baltic | 18.6% | 8.8%(+9.82)#21 | 11.1%(+7.58)#6,207 |
| 22. | Candlewood Orchards | 18.1% | 8.8%(+9.25)#22 | 11.1%(+7.01)#6,494 |
| 23. | Waterford | 17.5% | 8.8%(+8.69)#23 | 11.1%(+6.45)#6,740 |
| 24. | Lakeville | 17.1% | 8.8%(+8.32)#24 | 11.1%(+6.08)#6,896 |
| 25. | Ansonia | 17.1% | 8.8%(+8.26)#25 | 11.1%(+6.01)#6,930 |
| 26. | Old Saybrook Center | 17.0% | 8.8%(+8.15)#26 | 11.1%(+5.91)#6,983 |
| 27. | Cheshire Village | 16.8% | 8.8%(+7.93)#27 | 11.1%(+5.69)#7,057 |
| 28. | East Hartford | 16.7% | 8.8%(+7.83)#28 | 11.1%(+5.59)#7,235 |
| 29. | Madison Center | 16.6% | 8.8%(+7.79)#29 | 11.1%(+5.54)#7,246 |
| 30. | Simsbury Center | 15.7% | 8.8%(+6.91)#30 | 11.1%(+4.67)#7,660 |
| 31. | Wallingford Center | 15.3% | 8.8%(+6.45)#31 | 11.1%(+4.20)#7,916 |
| 32. | Newtown Borough | 15.2% | 8.8%(+6.39)#32 | 11.1%(+4.15)#7,939 |
| 33. | Pawcatuck | 14.8% | 8.8%(+5.99)#33 | 11.1%(+3.75)#8,152 |
| 34. | Windsor Locks | 14.4% | 8.8%(+5.57)#34 | 11.1%(+3.33)#8,419 |
| 35. | Waterbury | 14.4% | 8.8%(+5.56)#35 | 11.1%(+3.32)#8,424 |
| 36. | Colchester | 14.2% | 8.8%(+5.39)#36 | 11.1%(+3.14)#8,614 |
| 37. | Plattsville | 14.1% | 8.8%(+5.24)#37 | 11.1%(+3.00)#8,698 |
| 38. | Crystal Lake | 13.8% | 8.8%(+5.01)#38 | 11.1%(+2.76)#8,831 |
| 39. | Coleytown | 13.7% | 8.8%(+4.91)#39 | 11.1%(+2.67)#8,885 |
| 40. | Quinebaug | 13.7% | 8.8%(+4.90)#40 | 11.1%(+2.66)#8,891 |
| 41. | West Hartford | 13.7% | 8.8%(+4.88)#41 | 11.1%(+2.64)#8,910 |
| 42. | Torrington | 13.1% | 8.8%(+4.25)#42 | 11.1%(+2.00)#9,381 |
| 43. | Westbrook Center | 12.7% | 8.8%(+3.91)#43 | 11.1%(+1.67)#9,638 |
| 44. | Terryville | 12.5% | 8.8%(+3.72)#44 | 11.1%(+1.47)#9,768 |
| 45. | Moosup | 12.4% | 8.8%(+3.62)#45 | 11.1%(+1.37)#9,948 |
| 46. | Stamford | 12.4% | 8.8%(+3.54)#46 | 11.1%(+1.29)#9,992 |
| 47. | Noroton Heights | 12.3% | 8.8%(+3.52)#47 | 11.1%(+1.28)#10,005 |
| 48. | Greens Farms | 12.1% | 8.8%(+3.29)#48 | 11.1%(+1.04)#10,180 |
| 49. | Oronoque | 12.1% | 8.8%(+3.24)#49 | 11.1%(+0.991)#10,209 |
| 50. | Derby | 11.9% | 8.8%(+3.03)#50 | 11.1%(+0.790)#10,354 |
| 51. | South Coventry | 11.7% | 8.8%(+2.83)#51 | 11.1%(+0.584)#10,526 |
| 52. | Branford Center | 11.3% | 8.8%(+2.52)#52 | 11.1%(+0.272)#10,766 |
| 53. | Bethel | 11.2% | 8.8%(+2.33)#53 | 11.1%(+0.087)#10,862 |
| 54. | Byram | 10.8% | 8.8%(+1.95)#54 | 11.1%(-0.298)#11,285 |
| 55. | New Milford | 10.4% | 8.8%(+1.61)#55 | 11.1%(-0.635)#11,597 |
| 56. | New London | 10.2% | 8.8%(+1.36)#56 | 11.1%(-0.889)#11,825 |
| 57. | Middletown | 9.7% | 8.8%(+0.852)#57 | 11.1%(-1.39)#12,316 |
| 58. | Route 7 Gateway | 9.4% | 8.8%(+0.605)#58 | 11.1%(-1.64)#12,539 |
| 59. | Bristol | 9.3% | 8.8%(+0.478)#59 | 11.1%(-1.77)#12,657 |
| 60. | Westport | 9.1% | 8.8%(+0.268)#60 | 11.1%(-1.98)#12,803 |
| 61. | Sandy Hook | 9.0% | 8.8%(+0.202)#61 | 11.1%(-2.04)#12,945 |
| 62. | Danbury | 8.9% | 8.8%(+0.115)#62 | 11.1%(-2.13)#13,005 |
| 63. | New Britain | 8.9% | 8.8%(+0.031)#63 | 11.1%(-2.21)#13,090 |
| 64. | Naugatuck Borough | 8.6% | 8.8%(-0.211)#64 | 11.1%(-2.46)#13,309 |
| 65. | Litchfield Borough | 8.6% | 8.8%(-0.213)#65 | 11.1%(-2.46)#13,313 |
| 66. | Woodmont Borough | 8.5% | 8.8%(-0.361)#66 | 11.1%(-2.61)#13,457 |
| 67. | Meriden | 8.4% | 8.8%(-0.436)#67 | 11.1%(-2.68)#13,510 |
| 68. | Willimantic | 8.4% | 8.8%(-0.440)#68 | 11.1%(-2.68)#13,513 |
| 69. | Norwalk | 8.4% | 8.8%(-0.465)#69 | 11.1%(-2.71)#13,529 |
| 70. | East Haven | 8.4% | 8.8%(-0.472)#70 | 11.1%(-2.72)#13,535 |
| 71. | Niantic | 8.3% | 8.8%(-0.508)#71 | 11.1%(-2.75)#13,646 |
| 72. | Durham | 8.3% | 8.8%(-0.540)#72 | 11.1%(-2.78)#13,666 |
| 73. | Terramuggus | 8.3% | 8.8%(-0.566)#73 | 11.1%(-2.81)#13,687 |
| 74. | Chester Center | 8.0% | 8.8%(-0.868)#74 | 11.1%(-3.11)#13,981 |
| 75. | Salmon Brook | 7.8% | 8.8%(-0.991)#75 | 11.1%(-3.24)#14,083 |
| 76. | Glastonbury Center | 7.8% | 8.8%(-0.996)#76 | 11.1%(-3.24)#14,086 |
| 77. | Oxoboxo River | 7.8% | 8.8%(-1.06)#77 | 11.1%(-3.30)#14,130 |
| 78. | Heritage Village | 7.7% | 8.8%(-1.15)#78 | 11.1%(-3.40)#14,262 |
| 79. | Clinton | 7.6% | 8.8%(-1.17)#79 | 11.1%(-3.42)#14,274 |
| 80. | Old Greenwich | 7.6% | 8.8%(-1.22)#80 | 11.1%(-3.47)#14,304 |
| 81. | Riverside | 7.5% | 8.8%(-1.30)#81 | 11.1%(-3.55)#14,362 |
| 82. | Shelton | 7.5% | 8.8%(-1.32)#82 | 11.1%(-3.56)#14,373 |
| 83. | Guilford Center | 7.0% | 8.8%(-1.82)#83 | 11.1%(-4.06)#14,870 |
| 84. | Greenwich | 6.9% | 8.8%(-1.88)#84 | 11.1%(-4.13)#14,931 |
| 85. | Stepney | 6.9% | 8.8%(-1.94)#85 | 11.1%(-4.18)#15,011 |
| 86. | Noank | 6.7% | 8.8%(-2.16)#86 | 11.1%(-4.40)#15,197 |
| 87. | Southwood Acres | 6.7% | 8.8%(-2.17)#87 | 11.1%(-4.41)#15,266 |
| 88. | Pemberwick | 6.6% | 8.8%(-2.23)#88 | 11.1%(-4.47)#15,302 |
| 89. | Wethersfield | 6.1% | 8.8%(-2.77)#89 | 11.1%(-5.01)#15,896 |
| 90. | Somers | 6.0% | 8.8%(-2.79)#90 | 11.1%(-5.03)#15,913 |
| 91. | West Haven | 6.0% | 8.8%(-2.83)#91 | 11.1%(-5.07)#15,960 |
| 92. | Sherwood Manor | 5.7% | 8.8%(-3.07)#92 | 11.1%(-5.32)#16,225 |
| 93. | Deep River Center | 5.7% | 8.8%(-3.16)#93 | 11.1%(-5.41)#16,313 |
| 94. | Watertown | 5.6% | 8.8%(-3.27)#94 | 11.1%(-5.51)#16,405 |
| 95. | Ball Pond | 5.6% | 8.8%(-3.27)#95 | 11.1%(-5.51)#16,409 |
| 96. | Staples | 5.5% | 8.8%(-3.28)#96 | 11.1%(-5.53)#16,476 |
| 97. | Milford City Balance | 5.4% | 8.8%(-3.41)#97 | 11.1%(-5.66)#16,586 |
| 98. | East Brooklyn | 5.3% | 8.8%(-3.56)#98 | 11.1%(-5.80)#16,715 |
| 99. | Broad Brook | 5.1% | 8.8%(-3.74)#99 | 11.1%(-5.99)#16,911 |
| 100. | Georgetown | 5.0% | 8.8%(-3.82)#100 | 11.1%(-6.07)#16,983 |
1
2Common Questions
What are the Top 10 Cities with the Highest Poverty Level Among Seniors Over the Age of 75 in Connecticut?
Top 10 Cities with the Highest Poverty Level Among Seniors Over the Age of 75 in Connecticut are:
#1
44.4%
#2
39.0%
#3
29.1%
#4
27.3%
#5
26.0%
#6
24.6%
#7
23.7%
#8
23.4%
#9
23.1%
#10
20.4%
What city has the Highest Poverty Level Among Seniors Over the Age of 75 in Connecticut?
Woodbury Center has the Highest Poverty Level Among Seniors Over the Age of 75 in Connecticut with 44.4%.
What is the Poverty Level Among Seniors Over the Age of 75 in the State of Connecticut?
Poverty Level Among Seniors Over the Age of 75 in Connecticut is 8.8%.
What is the Poverty Level Among Seniors Over the Age of 75 in the United States?
Poverty Level Among Seniors Over the Age of 75 in the United States is 11.1%.