Cities with the Highest Poverty Level Among Seniors Over the Age of 75 in Mississippi
RELATED REPORTS & OPTIONS
Highest Poverty | Seniors 75+
Mississippi
Compare Cities
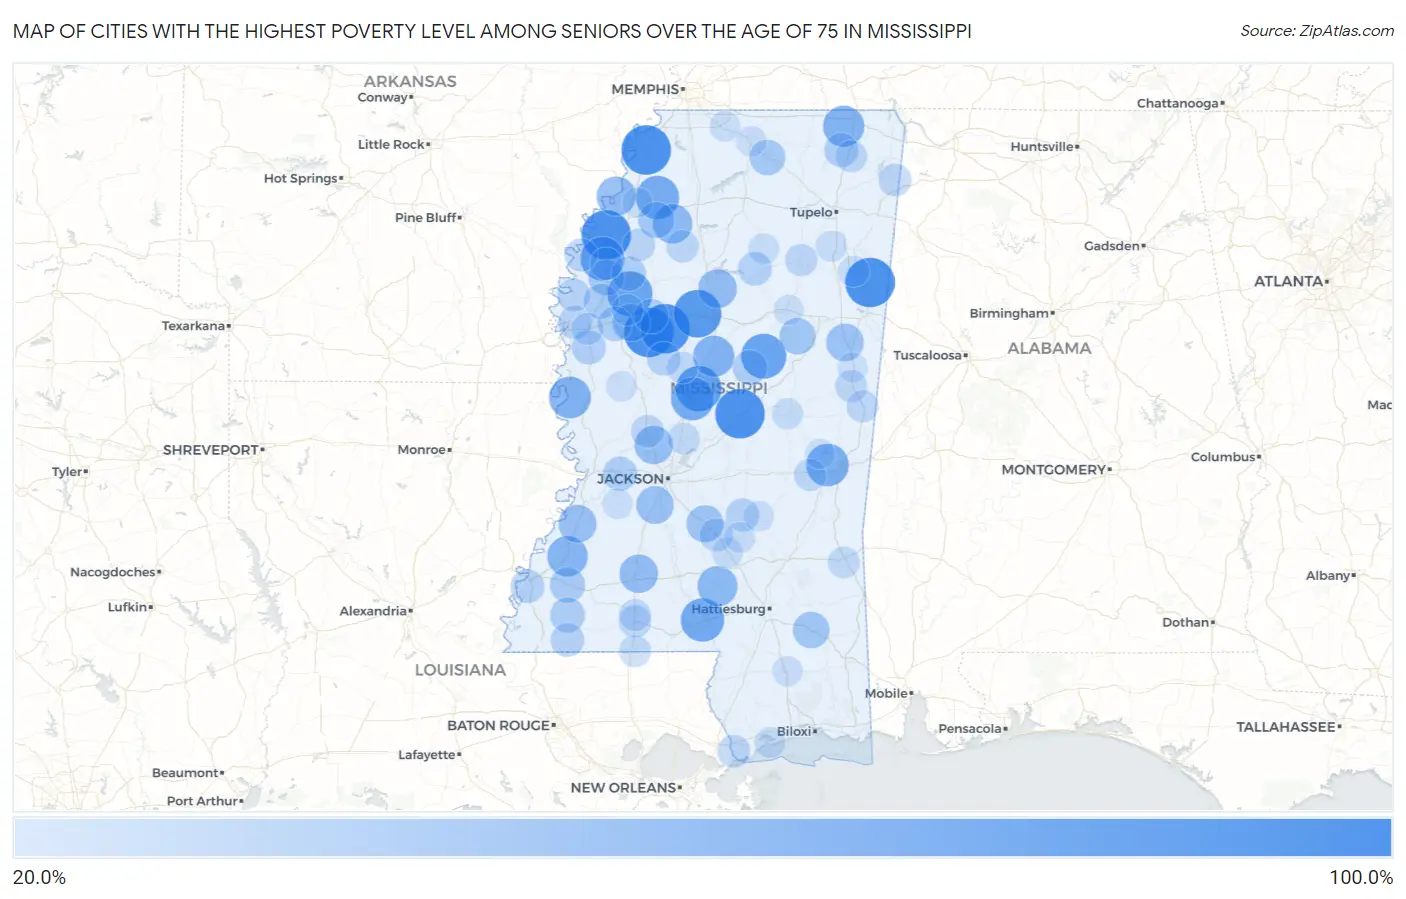
Map of Cities with the Highest Poverty Level Among Seniors Over the Age of 75 in Mississippi
0.0%
100.0%
Cities with the Highest Poverty Level Among Seniors Over the Age of 75 in Mississippi
| City | Senior Poverty | vs State | vs National | |
| 1. | North Tunica | 100.0% | 14.6%(+85.4)#1 | 11.1%(+88.9)#32 |
| 2. | Redwater | 100.0% | 14.6%(+85.4)#2 | 11.1%(+88.9)#78 |
| 3. | Hermanville | 100.0% | 14.6%(+85.4)#3 | 11.1%(+88.9)#82 |
| 4. | Harperville | 100.0% | 14.6%(+85.4)#4 | 11.1%(+88.9)#116 |
| 5. | De Soto | 100.0% | 14.6%(+85.4)#5 | 11.1%(+88.9)#140 |
| 6. | Alligator | 100.0% | 14.6%(+85.4)#6 | 11.1%(+88.9)#155 |
| 7. | Hamilton | 100.0% | 14.6%(+85.4)#7 | 11.1%(+88.9)#157 |
| 8. | Morgan City | 100.0% | 14.6%(+85.4)#8 | 11.1%(+88.9)#186 |
| 9. | Sidon | 100.0% | 14.6%(+85.4)#9 | 11.1%(+88.9)#192 |
| 10. | Fernwood | 100.0% | 14.6%(+85.4)#10 | 11.1%(+88.9)#228 |
| 11. | Winterville | 100.0% | 14.6%(+85.4)#11 | 11.1%(+88.9)#244 |
| 12. | North Carrollton | 92.7% | 14.6%(+78.1)#12 | 11.1%(+81.6)#412 |
| 13. | Goodman | 84.2% | 14.6%(+69.6)#13 | 11.1%(+73.1)#457 |
| 14. | Doddsville | 81.8% | 14.6%(+67.2)#14 | 11.1%(+70.8)#479 |
| 15. | Mccool | 81.8% | 14.6%(+67.2)#15 | 11.1%(+70.8)#481 |
| 16. | Winstonville | 77.8% | 14.6%(+63.2)#16 | 11.1%(+66.7)#520 |
| 17. | Foxworth | 75.6% | 14.6%(+61.0)#17 | 11.1%(+64.5)#544 |
| 18. | Darling | 75.0% | 14.6%(+60.4)#18 | 11.1%(+63.9)#562 |
| 19. | Pickens | 73.5% | 14.6%(+59.0)#19 | 11.1%(+62.5)#583 |
| 20. | Nellieburg | 72.0% | 14.6%(+57.4)#20 | 11.1%(+60.9)#600 |
| 21. | Mayersville | 68.4% | 14.6%(+53.8)#21 | 11.1%(+57.4)#645 |
| 22. | West | 66.7% | 14.6%(+52.1)#22 | 11.1%(+55.6)#686 |
| 23. | Kossuth | 66.7% | 14.6%(+52.1)#23 | 11.1%(+55.6)#690 |
| 24. | Fayette | 63.9% | 14.6%(+49.3)#24 | 11.1%(+52.8)#736 |
| 25. | Bassfield | 61.5% | 14.6%(+47.0)#25 | 11.1%(+50.5)#803 |
| 26. | Stewart | 61.1% | 14.6%(+46.5)#26 | 11.1%(+50.0)#818 |
| 27. | Crowder | 60.0% | 14.6%(+45.4)#27 | 11.1%(+48.9)#836 |
| 28. | Friars Point | 58.8% | 14.6%(+44.3)#28 | 11.1%(+47.8)#889 |
| 29. | Elliott | 56.7% | 14.6%(+42.1)#29 | 11.1%(+45.6)#964 |
| 30. | Brookhaven | 55.9% | 14.6%(+41.3)#30 | 11.1%(+44.8)#991 |
| 31. | Flora | 55.5% | 14.6%(+40.9)#31 | 11.1%(+44.4)#1,013 |
| 32. | Port Gibson | 53.5% | 14.6%(+38.9)#32 | 11.1%(+42.4)#1,079 |
| 33. | Terry | 52.4% | 14.6%(+37.8)#33 | 11.1%(+41.3)#1,109 |
| 34. | Crawford | 51.9% | 14.6%(+37.4)#34 | 11.1%(+40.9)#1,125 |
| 35. | Moorhead | 51.8% | 14.6%(+37.2)#35 | 11.1%(+40.7)#1,127 |
| 36. | Mendenhall | 50.0% | 14.6%(+35.4)#36 | 11.1%(+38.9)#1,183 |
| 37. | Beaumont | 48.0% | 14.6%(+33.4)#37 | 11.1%(+36.9)#1,375 |
| 38. | Dennis | 47.6% | 14.6%(+33.0)#38 | 11.1%(+36.6)#1,400 |
| 39. | Sturgis | 47.1% | 14.6%(+32.5)#39 | 11.1%(+36.0)#1,435 |
| 40. | Lambert | 46.4% | 14.6%(+31.8)#40 | 11.1%(+35.3)#1,475 |
| 41. | Renova | 44.8% | 14.6%(+30.3)#41 | 11.1%(+33.8)#1,561 |
| 42. | Potts Camp | 44.4% | 14.6%(+29.9)#42 | 11.1%(+33.4)#1,594 |
| 43. | Biggersville | 43.8% | 14.6%(+29.2)#43 | 11.1%(+32.7)#1,632 |
| 44. | Roxie | 42.9% | 14.6%(+28.3)#44 | 11.1%(+31.8)#1,685 |
| 45. | Shaw | 41.8% | 14.6%(+27.2)#45 | 11.1%(+30.7)#1,777 |
| 46. | Crosby | 41.2% | 14.6%(+26.6)#46 | 11.1%(+30.1)#1,831 |
| 47. | Itta Bena | 40.6% | 14.6%(+26.0)#47 | 11.1%(+29.5)#1,864 |
| 48. | Indianola | 40.5% | 14.6%(+25.9)#48 | 11.1%(+29.4)#1,872 |
| 49. | Drew | 40.2% | 14.6%(+25.6)#49 | 11.1%(+29.1)#1,887 |
| 50. | Ethel | 40.0% | 14.6%(+25.4)#50 | 11.1%(+28.9)#1,917 |
| 51. | Bovina | 39.6% | 14.6%(+25.1)#51 | 11.1%(+28.6)#1,983 |
| 52. | Edwards | 39.5% | 14.6%(+25.0)#52 | 11.1%(+28.5)#1,988 |
| 53. | Arcola | 38.5% | 14.6%(+23.9)#53 | 11.1%(+27.4)#2,081 |
| 54. | Jumpertown | 38.1% | 14.6%(+23.5)#54 | 11.1%(+27.0)#2,111 |
| 55. | Big Creek | 37.5% | 14.6%(+22.9)#55 | 11.1%(+26.4)#2,180 |
| 56. | Tchula | 37.0% | 14.6%(+22.4)#56 | 11.1%(+25.9)#2,226 |
| 57. | Cloverdale | 36.7% | 14.6%(+22.1)#57 | 11.1%(+25.6)#2,247 |
| 58. | Centreville | 36.6% | 14.6%(+22.1)#58 | 11.1%(+25.6)#2,255 |
| 59. | Raleigh | 36.0% | 14.6%(+21.4)#59 | 11.1%(+24.9)#2,313 |
| 60. | Metcalfe | 35.0% | 14.6%(+20.4)#60 | 11.1%(+23.9)#2,409 |
| 61. | Benoit | 35.0% | 14.6%(+20.4)#61 | 11.1%(+23.9)#2,413 |
| 62. | Magee | 34.9% | 14.6%(+20.3)#62 | 11.1%(+23.8)#2,424 |
| 63. | Gunnison | 34.3% | 14.6%(+19.7)#63 | 11.1%(+23.2)#2,487 |
| 64. | Pearlington | 33.8% | 14.6%(+19.2)#64 | 11.1%(+22.7)#2,528 |
| 65. | Tutwiler | 33.3% | 14.6%(+18.8)#65 | 11.1%(+22.3)#2,563 |
| 66. | Bentonia | 33.3% | 14.6%(+18.8)#66 | 11.1%(+22.3)#2,623 |
| 67. | Golden | 33.3% | 14.6%(+18.8)#67 | 11.1%(+22.3)#2,654 |
| 68. | Mound Bayou | 32.5% | 14.6%(+17.9)#68 | 11.1%(+21.4)#2,784 |
| 69. | Mccomb | 32.3% | 14.6%(+17.7)#69 | 11.1%(+21.3)#2,804 |
| 70. | Charleston | 32.1% | 14.6%(+17.6)#70 | 11.1%(+21.1)#2,823 |
| 71. | Houston | 31.6% | 14.6%(+17.0)#71 | 11.1%(+20.5)#2,887 |
| 72. | Shuqualak | 31.2% | 14.6%(+16.7)#72 | 11.1%(+20.2)#2,934 |
| 73. | Scooba | 30.8% | 14.6%(+16.2)#73 | 11.1%(+19.7)#2,989 |
| 74. | Chunky | 30.8% | 14.6%(+16.2)#74 | 11.1%(+19.7)#2,996 |
| 75. | Booneville | 30.4% | 14.6%(+15.9)#75 | 11.1%(+19.4)#3,043 |
| 76. | Leland | 30.4% | 14.6%(+15.8)#76 | 11.1%(+19.3)#3,055 |
| 77. | Bond | 30.0% | 14.6%(+15.4)#77 | 11.1%(+18.9)#3,133 |
| 78. | Waynesboro | 29.8% | 14.6%(+15.2)#78 | 11.1%(+18.7)#3,169 |
| 79. | Osyka | 29.7% | 14.6%(+15.2)#79 | 11.1%(+18.7)#3,179 |
| 80. | Canton | 29.6% | 14.6%(+15.0)#80 | 11.1%(+18.5)#3,204 |
| 81. | Summit | 29.5% | 14.6%(+15.0)#81 | 11.1%(+18.5)#3,205 |
| 82. | Lexington | 29.2% | 14.6%(+14.6)#82 | 11.1%(+18.1)#3,267 |
| 83. | Sunflower | 28.6% | 14.6%(+14.0)#83 | 11.1%(+17.5)#3,337 |
| 84. | Philadelphia | 27.5% | 14.6%(+13.0)#84 | 11.1%(+16.5)#3,541 |
| 85. | Aberdeen | 26.9% | 14.6%(+12.3)#85 | 11.1%(+15.8)#3,689 |
| 86. | Henderson Point | 26.7% | 14.6%(+12.1)#86 | 11.1%(+15.6)#3,731 |
| 87. | Mount Olive | 26.5% | 14.6%(+12.0)#87 | 11.1%(+15.5)#3,750 |
| 88. | Bruce | 26.3% | 14.6%(+11.8)#88 | 11.1%(+15.3)#3,785 |
| 89. | Okolona | 26.3% | 14.6%(+11.7)#89 | 11.1%(+15.2)#3,789 |
| 90. | Mize | 26.0% | 14.6%(+11.4)#90 | 11.1%(+14.9)#3,871 |
| 91. | Byhalia | 25.4% | 14.6%(+10.8)#91 | 11.1%(+14.3)#4,003 |
| 92. | Holly Springs | 25.0% | 14.6%(+10.4)#92 | 11.1%(+13.9)#4,050 |
| 93. | Utica | 25.0% | 14.6%(+10.4)#93 | 11.1%(+13.9)#4,077 |
| 94. | Louise | 25.0% | 14.6%(+10.4)#94 | 11.1%(+13.9)#4,163 |
| 95. | Sylvarena | 25.0% | 14.6%(+10.4)#95 | 11.1%(+13.9)#4,180 |
| 96. | Wiggins | 24.3% | 14.6%(+9.71)#96 | 11.1%(+13.2)#4,305 |
| 97. | Mathiston | 23.9% | 14.6%(+9.37)#97 | 11.1%(+12.9)#4,380 |
| 98. | Macon | 23.4% | 14.6%(+8.80)#98 | 11.1%(+12.3)#4,548 |
| 99. | Jonestown | 23.3% | 14.6%(+8.76)#99 | 11.1%(+12.3)#4,557 |
| 100. | Collinsville | 23.2% | 14.6%(+8.64)#100 | 11.1%(+12.1)#4,577 |
Common Questions
What are the Top 10 Cities with the Highest Poverty Level Among Seniors Over the Age of 75 in Mississippi?
Top 10 Cities with the Highest Poverty Level Among Seniors Over the Age of 75 in Mississippi are:
#1
100.0%
#2
100.0%
#3
100.0%
#4
100.0%
#5
100.0%
#6
100.0%
#7
92.7%
#8
84.2%
#9
81.8%
#10
81.8%
What city has the Highest Poverty Level Among Seniors Over the Age of 75 in Mississippi?
North Tunica has the Highest Poverty Level Among Seniors Over the Age of 75 in Mississippi with 100.0%.
What is the Poverty Level Among Seniors Over the Age of 75 in the State of Mississippi?
Poverty Level Among Seniors Over the Age of 75 in Mississippi is 14.6%.
What is the Poverty Level Among Seniors Over the Age of 75 in the United States?
Poverty Level Among Seniors Over the Age of 75 in the United States is 11.1%.