Cities with the Highest Poverty Level Among Seniors Over the Age of 75 in North Carolina
RELATED REPORTS & OPTIONS
Highest Poverty | Seniors 75+
North Carolina
Compare Cities
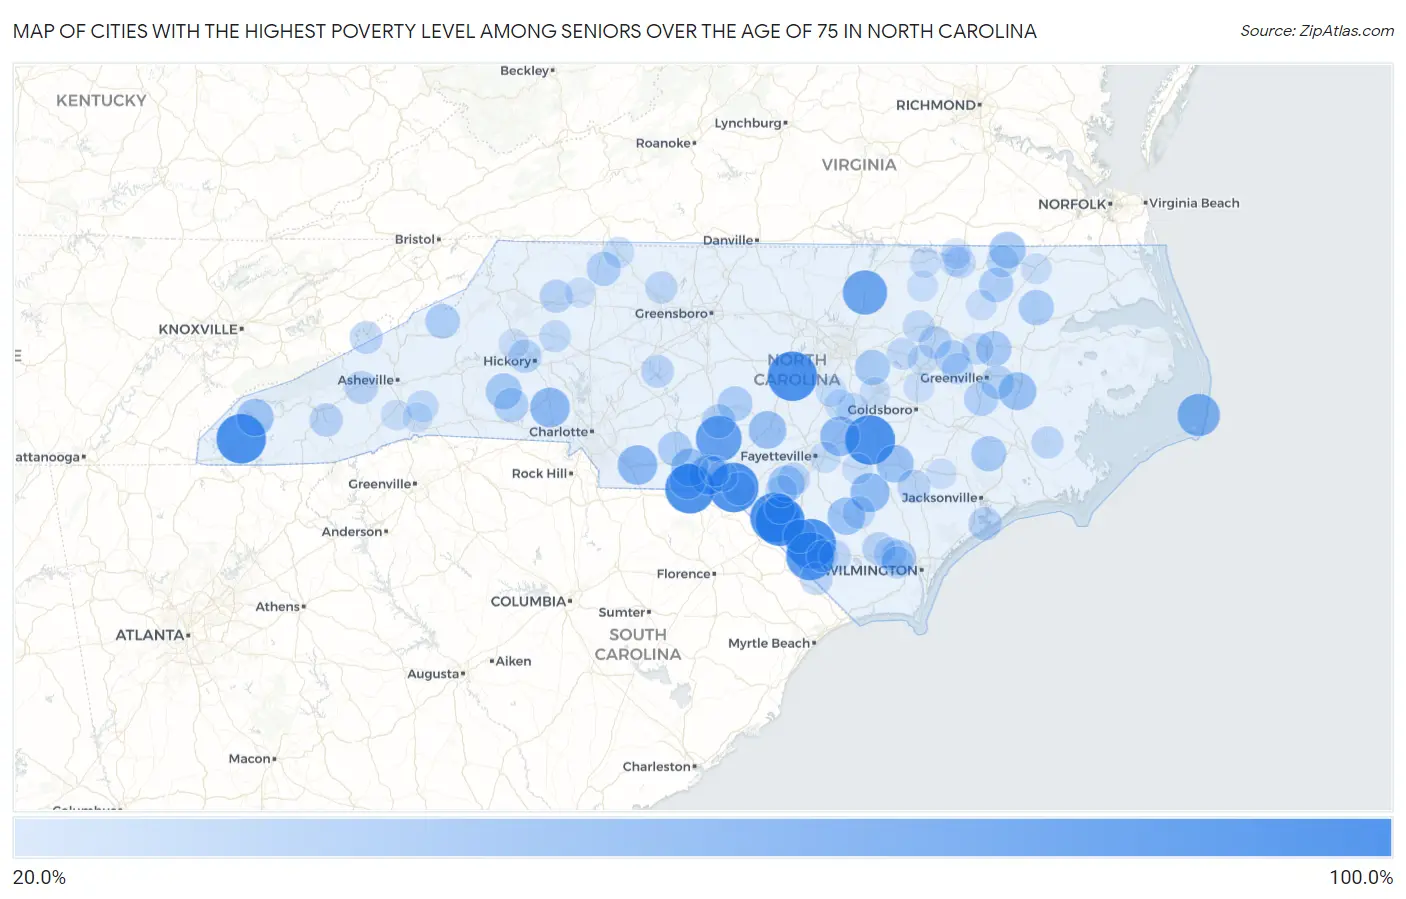
Map of Cities with the Highest Poverty Level Among Seniors Over the Age of 75 in North Carolina
0.0%
100.0%
Cities with the Highest Poverty Level Among Seniors Over the Age of 75 in North Carolina
| City | Senior Poverty | vs State | vs National | |
| 1. | Moncure | 100.0% | 11.2%(+88.8)#1 | 11.1%(+88.9)#47 |
| 2. | Old Hundred | 100.0% | 11.2%(+88.8)#2 | 11.1%(+88.9)#124 |
| 3. | Evergreen | 100.0% | 11.2%(+88.8)#3 | 11.1%(+88.9)#131 |
| 4. | Marble | 100.0% | 11.2%(+88.8)#4 | 11.1%(+88.9)#134 |
| 5. | Vann Crossroads | 100.0% | 11.2%(+88.8)#5 | 11.1%(+88.9)#146 |
| 6. | Elrod | 100.0% | 11.2%(+88.8)#6 | 11.1%(+88.9)#148 |
| 7. | Mcfarlan | 100.0% | 11.2%(+88.8)#7 | 11.1%(+88.9)#239 |
| 8. | Long Creek | 100.0% | 11.2%(+88.8)#8 | 11.1%(+88.9)#275 |
| 9. | Raynham | 100.0% | 11.2%(+88.8)#9 | 11.1%(+88.9)#351 |
| 10. | Cerro Gordo | 93.2% | 11.2%(+82.0)#10 | 11.1%(+82.2)#410 |
| 11. | Norman | 85.7% | 11.2%(+74.5)#11 | 11.1%(+74.6)#445 |
| 12. | Kittrell | 80.0% | 11.2%(+68.8)#12 | 11.1%(+68.9)#496 |
| 13. | Nebo | 75.7% | 11.2%(+64.5)#13 | 11.1%(+64.6)#543 |
| 14. | Avon | 72.4% | 11.2%(+61.2)#14 | 11.1%(+61.3)#596 |
| 15. | Cordova | 62.2% | 11.2%(+51.0)#15 | 11.1%(+51.1)#788 |
| 16. | High Shoals | 62.1% | 11.2%(+50.9)#16 | 11.1%(+51.0)#791 |
| 17. | Wingate | 62.0% | 11.2%(+50.8)#17 | 11.1%(+50.9)#792 |
| 18. | Falcon | 61.5% | 11.2%(+50.3)#18 | 11.1%(+50.5)#806 |
| 19. | Garland | 60.0% | 11.2%(+48.8)#19 | 11.1%(+48.9)#835 |
| 20. | Vass | 54.7% | 11.2%(+43.5)#20 | 11.1%(+43.7)#1,035 |
| 21. | Lilesville | 54.5% | 11.2%(+43.3)#21 | 11.1%(+43.5)#1,038 |
| 22. | Chocowinity | 54.4% | 11.2%(+43.2)#22 | 11.1%(+43.4)#1,050 |
| 23. | Turkey | 53.8% | 11.2%(+42.6)#23 | 11.1%(+42.8)#1,069 |
| 24. | Elizabethtown | 53.8% | 11.2%(+42.6)#24 | 11.1%(+42.7)#1,072 |
| 25. | Robbinsville | 53.1% | 11.2%(+41.9)#25 | 11.1%(+42.1)#1,094 |
| 26. | Dudley | 52.9% | 11.2%(+41.7)#26 | 11.1%(+41.8)#1,103 |
| 27. | Shannon | 50.0% | 11.2%(+38.8)#27 | 11.1%(+38.9)#1,231 |
| 28. | Severn | 50.0% | 11.2%(+38.8)#28 | 11.1%(+38.9)#1,249 |
| 29. | Morven | 48.4% | 11.2%(+37.2)#29 | 11.1%(+37.3)#1,354 |
| 30. | Barnardsville | 48.3% | 11.2%(+37.1)#30 | 11.1%(+37.2)#1,359 |
| 31. | Casar | 48.1% | 11.2%(+36.9)#31 | 11.1%(+37.1)#1,365 |
| 32. | Parmele | 46.7% | 11.2%(+35.5)#32 | 11.1%(+35.6)#1,460 |
| 33. | Askewville | 45.7% | 11.2%(+34.5)#33 | 11.1%(+34.6)#1,513 |
| 34. | Trenton | 45.5% | 11.2%(+34.3)#34 | 11.1%(+34.4)#1,534 |
| 35. | Archer Lodge | 45.2% | 11.2%(+34.0)#35 | 11.1%(+34.2)#1,544 |
| 36. | Northwest | 44.6% | 11.2%(+33.4)#36 | 11.1%(+33.6)#1,575 |
| 37. | Robbins | 44.4% | 11.2%(+33.2)#37 | 11.1%(+33.4)#1,583 |
| 38. | Bakersville | 43.0% | 11.2%(+31.8)#38 | 11.1%(+32.0)#1,670 |
| 39. | Rich Square | 42.9% | 11.2%(+31.7)#39 | 11.1%(+31.8)#1,688 |
| 40. | Macclesfield | 42.9% | 11.2%(+31.7)#40 | 11.1%(+31.8)#1,694 |
| 41. | Ansonville | 42.6% | 11.2%(+31.4)#41 | 11.1%(+31.5)#1,724 |
| 42. | Lawndale | 42.1% | 11.2%(+30.9)#42 | 11.1%(+31.0)#1,750 |
| 43. | Ayden | 41.8% | 11.2%(+30.6)#43 | 11.1%(+30.8)#1,775 |
| 44. | Dobson | 41.3% | 11.2%(+30.1)#44 | 11.1%(+30.3)#1,816 |
| 45. | Candor | 41.2% | 11.2%(+30.0)#45 | 11.1%(+30.1)#1,825 |
| 46. | Simpson | 40.0% | 11.2%(+28.8)#46 | 11.1%(+28.9)#1,915 |
| 47. | Orrum | 40.0% | 11.2%(+28.8)#47 | 11.1%(+28.9)#1,959 |
| 48. | Rhodhiss | 38.9% | 11.2%(+27.7)#48 | 11.1%(+27.8)#2,032 |
| 49. | Cullowhee | 38.7% | 11.2%(+27.5)#49 | 11.1%(+27.6)#2,049 |
| 50. | Sneads Ferry | 38.5% | 11.2%(+27.3)#50 | 11.1%(+27.4)#2,065 |
| 51. | Chowan Beach | 38.5% | 11.2%(+27.3)#51 | 11.1%(+27.4)#2,076 |
| 52. | Fairplains | 38.2% | 11.2%(+27.0)#52 | 11.1%(+27.1)#2,106 |
| 53. | Rose Hill | 38.1% | 11.2%(+26.9)#53 | 11.1%(+27.0)#2,108 |
| 54. | East Arcadia | 38.1% | 11.2%(+26.9)#54 | 11.1%(+27.0)#2,112 |
| 55. | West Canton | 38.1% | 11.2%(+26.9)#55 | 11.1%(+27.0)#2,120 |
| 56. | Laurel Hill | 37.8% | 11.2%(+26.6)#56 | 11.1%(+26.7)#2,144 |
| 57. | Sharpsburg | 37.6% | 11.2%(+26.4)#57 | 11.1%(+26.6)#2,154 |
| 58. | Southmont | 36.8% | 11.2%(+25.6)#58 | 11.1%(+25.8)#2,236 |
| 59. | Tabor City | 36.8% | 11.2%(+25.6)#59 | 11.1%(+25.7)#2,244 |
| 60. | Hot Springs | 36.7% | 11.2%(+25.5)#60 | 11.1%(+25.6)#2,248 |
| 61. | Lumber Bridge | 36.4% | 11.2%(+25.2)#61 | 11.1%(+25.3)#2,295 |
| 62. | Riegelwood | 36.0% | 11.2%(+24.8)#62 | 11.1%(+24.9)#2,314 |
| 63. | White Lake | 35.7% | 11.2%(+24.5)#63 | 11.1%(+24.6)#2,331 |
| 64. | Whiteville | 35.1% | 11.2%(+23.9)#64 | 11.1%(+24.1)#2,404 |
| 65. | Germanton | 34.8% | 11.2%(+23.6)#65 | 11.1%(+23.8)#2,432 |
| 66. | Grantsboro | 34.8% | 11.2%(+23.6)#66 | 11.1%(+23.7)#2,438 |
| 67. | Sandy Creek | 34.8% | 11.2%(+23.6)#67 | 11.1%(+23.7)#2,442 |
| 68. | Conway | 34.6% | 11.2%(+23.4)#68 | 11.1%(+23.5)#2,453 |
| 69. | Red Springs | 34.0% | 11.2%(+22.8)#69 | 11.1%(+22.9)#2,509 |
| 70. | Chadbourn | 33.8% | 11.2%(+22.6)#70 | 11.1%(+22.7)#2,532 |
| 71. | Nashville | 33.3% | 11.2%(+22.1)#71 | 11.1%(+22.3)#2,562 |
| 72. | Conetoe | 33.3% | 11.2%(+22.1)#72 | 11.1%(+22.3)#2,593 |
| 73. | Bailey | 33.3% | 11.2%(+22.1)#73 | 11.1%(+22.3)#2,610 |
| 74. | Benson | 33.2% | 11.2%(+22.0)#74 | 11.1%(+22.1)#2,736 |
| 75. | Edneyville | 33.1% | 11.2%(+21.9)#75 | 11.1%(+22.1)#2,740 |
| 76. | Taylorsville | 32.8% | 11.2%(+21.6)#76 | 11.1%(+21.7)#2,764 |
| 77. | Weldon | 32.6% | 11.2%(+21.4)#77 | 11.1%(+21.6)#2,773 |
| 78. | Fountain | 32.4% | 11.2%(+21.2)#78 | 11.1%(+21.4)#2,791 |
| 79. | Coats | 30.8% | 11.2%(+19.6)#79 | 11.1%(+19.7)#2,983 |
| 80. | Mount Airy | 30.6% | 11.2%(+19.4)#80 | 11.1%(+19.6)#3,018 |
| 81. | Vander | 30.4% | 11.2%(+19.2)#81 | 11.1%(+19.3)#3,058 |
| 82. | Angier | 30.3% | 11.2%(+19.1)#82 | 11.1%(+19.2)#3,063 |
| 83. | Roseboro | 29.8% | 11.2%(+18.6)#83 | 11.1%(+18.7)#3,170 |
| 84. | Hollister | 29.4% | 11.2%(+18.2)#84 | 11.1%(+18.3)#3,224 |
| 85. | Dobbins Heights | 29.4% | 11.2%(+18.2)#85 | 11.1%(+18.3)#3,229 |
| 86. | Smithfield | 29.4% | 11.2%(+18.2)#86 | 11.1%(+18.3)#3,241 |
| 87. | Scotland Neck | 29.3% | 11.2%(+18.1)#87 | 11.1%(+18.3)#3,248 |
| 88. | Winton | 29.3% | 11.2%(+18.1)#88 | 11.1%(+18.2)#3,255 |
| 89. | Littleton | 29.3% | 11.2%(+18.1)#89 | 11.1%(+18.2)#3,256 |
| 90. | Horse Shoe | 29.1% | 11.2%(+17.9)#90 | 11.1%(+18.1)#3,272 |
| 91. | Roanoke Rapids | 29.1% | 11.2%(+17.9)#91 | 11.1%(+18.0)#3,282 |
| 92. | Wilson | 28.6% | 11.2%(+17.4)#92 | 11.1%(+17.5)#3,327 |
| 93. | Beulaville | 28.6% | 11.2%(+17.4)#93 | 11.1%(+17.5)#3,334 |
| 94. | Fremont | 28.2% | 11.2%(+17.0)#94 | 11.1%(+17.2)#3,424 |
| 95. | Cajah S Mountain | 28.2% | 11.2%(+17.0)#95 | 11.1%(+17.1)#3,436 |
| 96. | Gaston | 28.1% | 11.2%(+16.9)#96 | 11.1%(+17.1)#3,440 |
| 97. | Rockingham | 28.1% | 11.2%(+16.9)#97 | 11.1%(+17.0)#3,442 |
| 98. | Ronda | 27.8% | 11.2%(+16.6)#98 | 11.1%(+16.7)#3,501 |
| 99. | Pembroke | 27.4% | 11.2%(+16.2)#99 | 11.1%(+16.3)#3,576 |
| 100. | Dana | 27.0% | 11.2%(+15.8)#100 | 11.1%(+15.9)#3,661 |
Common Questions
What are the Top 10 Cities with the Highest Poverty Level Among Seniors Over the Age of 75 in North Carolina?
Top 10 Cities with the Highest Poverty Level Among Seniors Over the Age of 75 in North Carolina are:
#1
100.0%
#2
100.0%
#3
100.0%
#4
100.0%
#5
100.0%
#6
100.0%
#7
100.0%
#8
100.0%
#9
93.2%
#10
85.7%
What city has the Highest Poverty Level Among Seniors Over the Age of 75 in North Carolina?
Moncure has the Highest Poverty Level Among Seniors Over the Age of 75 in North Carolina with 100.0%.
What is the Poverty Level Among Seniors Over the Age of 75 in the State of North Carolina?
Poverty Level Among Seniors Over the Age of 75 in North Carolina is 11.2%.
What is the Poverty Level Among Seniors Over the Age of 75 in the United States?
Poverty Level Among Seniors Over the Age of 75 in the United States is 11.1%.