Cities with the Highest Poverty Level Among Seniors Over the Age of 75 in Indiana
RELATED REPORTS & OPTIONS
Highest Poverty | Seniors 75+
Indiana
Compare Cities
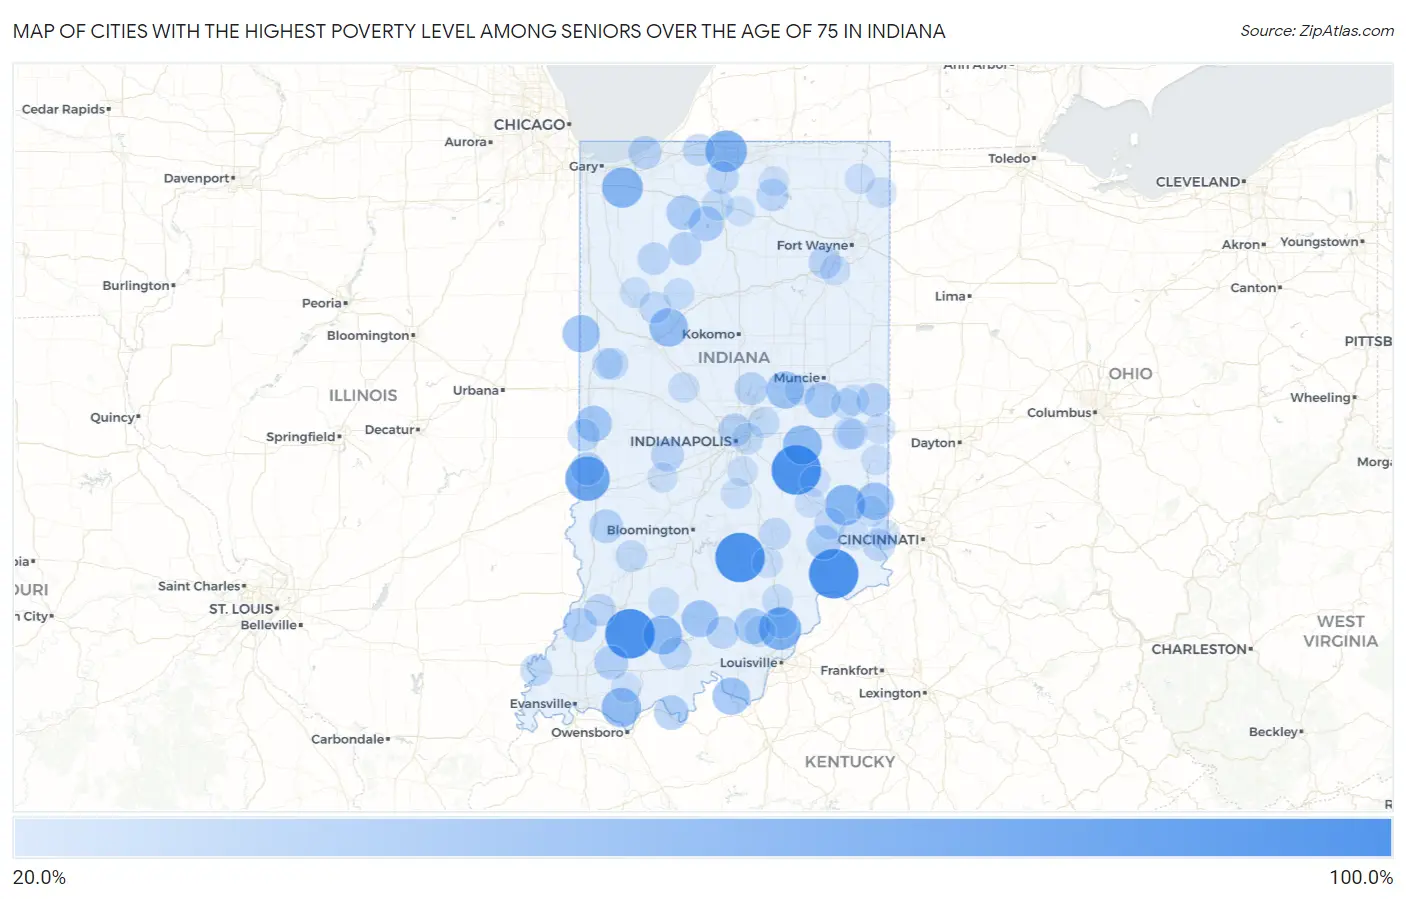
Map of Cities with the Highest Poverty Level Among Seniors Over the Age of 75 in Indiana
0.0%
100.0%
Cities with the Highest Poverty Level Among Seniors Over the Age of 75 in Indiana
| City | Senior Poverty | vs State | vs National | |
| 1. | St. Wendel | 100.0% | 9.0%(+91.0)#1 | 11.1%(+88.9)#40 |
| 2. | Thayer | 100.0% | 9.0%(+91.0)#2 | 11.1%(+88.9)#57 |
| 3. | Manilla | 100.0% | 9.0%(+91.0)#3 | 11.1%(+88.9)#100 |
| 4. | Otwell | 100.0% | 9.0%(+91.0)#4 | 11.1%(+88.9)#105 |
| 5. | Forest | 100.0% | 9.0%(+91.0)#5 | 11.1%(+88.9)#143 |
| 6. | Freetown | 100.0% | 9.0%(+91.0)#6 | 11.1%(+88.9)#154 |
| 7. | Adams | 100.0% | 9.0%(+91.0)#7 | 11.1%(+88.9)#183 |
| 8. | Royerton | 100.0% | 9.0%(+91.0)#8 | 11.1%(+88.9)#193 |
| 9. | Canaan | 100.0% | 9.0%(+91.0)#9 | 11.1%(+88.9)#222 |
| 10. | Holiday Woods | 100.0% | 9.0%(+91.0)#10 | 11.1%(+88.9)#226 |
| 11. | Bippus | 100.0% | 9.0%(+91.0)#11 | 11.1%(+88.9)#251 |
| 12. | Hobbs | 100.0% | 9.0%(+91.0)#12 | 11.1%(+88.9)#258 |
| 13. | Penntown | 100.0% | 9.0%(+91.0)#13 | 11.1%(+88.9)#276 |
| 14. | Paris Crossing | 100.0% | 9.0%(+91.0)#14 | 11.1%(+88.9)#377 |
| 15. | Eugene | 80.0% | 9.0%(+71.0)#15 | 11.1%(+68.9)#490 |
| 16. | St Mary Of The Woods | 78.7% | 9.0%(+69.6)#16 | 11.1%(+67.6)#507 |
| 17. | Paxton | 75.0% | 9.0%(+66.0)#17 | 11.1%(+63.9)#555 |
| 18. | Memphis | 69.8% | 9.0%(+60.8)#18 | 11.1%(+58.7)#625 |
| 19. | Notre Dame | 67.0% | 9.0%(+58.0)#19 | 11.1%(+56.0)#659 |
| 20. | Shorewood Forest | 63.0% | 9.0%(+54.0)#20 | 11.1%(+51.9)#758 |
| 21. | Oldenburg | 61.7% | 9.0%(+52.7)#21 | 11.1%(+50.7)#796 |
| 22. | Cass | 58.3% | 9.0%(+49.3)#22 | 11.1%(+47.3)#907 |
| 23. | Carthage | 57.1% | 9.0%(+48.1)#23 | 11.1%(+46.1)#938 |
| 24. | Richland | 57.1% | 9.0%(+48.1)#24 | 11.1%(+46.1)#940 |
| 25. | Dubois | 56.2% | 9.0%(+47.2)#25 | 11.1%(+45.2)#976 |
| 26. | Americus | 54.2% | 9.0%(+45.2)#26 | 11.1%(+43.1)#1,056 |
| 27. | Ambia | 50.0% | 9.0%(+41.0)#27 | 11.1%(+38.9)#1,234 |
| 28. | Cedar Grove | 50.0% | 9.0%(+41.0)#28 | 11.1%(+38.9)#1,241 |
| 29. | Mauckport | 50.0% | 9.0%(+41.0)#29 | 11.1%(+38.9)#1,301 |
| 30. | River Forest | 50.0% | 9.0%(+41.0)#30 | 11.1%(+38.9)#1,313 |
| 31. | Paoli | 47.8% | 9.0%(+38.8)#31 | 11.1%(+36.8)#1,388 |
| 32. | Newport | 44.8% | 9.0%(+35.8)#32 | 11.1%(+33.8)#1,565 |
| 33. | Grantsburg | 44.1% | 9.0%(+35.1)#33 | 11.1%(+33.1)#1,607 |
| 34. | Willow Branch | 43.8% | 9.0%(+34.7)#34 | 11.1%(+32.7)#1,633 |
| 35. | New Pekin | 43.1% | 9.0%(+34.1)#35 | 11.1%(+32.1)#1,666 |
| 36. | Springport | 42.9% | 9.0%(+33.9)#36 | 11.1%(+31.8)#1,704 |
| 37. | Culver | 39.3% | 9.0%(+30.3)#37 | 11.1%(+28.2)#2,001 |
| 38. | Knox | 39.0% | 9.0%(+30.0)#38 | 11.1%(+28.0)#2,024 |
| 39. | Holton | 38.9% | 9.0%(+29.9)#39 | 11.1%(+27.8)#2,034 |
| 40. | Cannelton | 38.6% | 9.0%(+29.6)#40 | 11.1%(+27.5)#2,061 |
| 41. | Decker | 36.4% | 9.0%(+27.4)#41 | 11.1%(+25.3)#2,286 |
| 42. | Spurgeon | 36.4% | 9.0%(+27.4)#42 | 11.1%(+25.3)#2,287 |
| 43. | Hymera | 35.3% | 9.0%(+26.3)#43 | 11.1%(+24.2)#2,377 |
| 44. | Lynn | 34.5% | 9.0%(+25.5)#44 | 11.1%(+23.4)#2,462 |
| 45. | New Goshen | 34.5% | 9.0%(+25.5)#45 | 11.1%(+23.4)#2,466 |
| 46. | Winamac | 33.8% | 9.0%(+24.8)#46 | 11.1%(+22.7)#2,533 |
| 47. | Town Of Pines | 33.3% | 9.0%(+24.3)#47 | 11.1%(+22.3)#2,596 |
| 48. | Cicero | 32.9% | 9.0%(+23.9)#48 | 11.1%(+21.9)#2,754 |
| 49. | Rocky Ripple | 32.6% | 9.0%(+23.6)#49 | 11.1%(+21.5)#2,775 |
| 50. | Fillmore | 32.1% | 9.0%(+23.1)#50 | 11.1%(+21.1)#2,826 |
| 51. | Roanoke | 31.9% | 9.0%(+22.9)#51 | 11.1%(+20.8)#2,852 |
| 52. | Hardinsburg | 30.8% | 9.0%(+21.8)#52 | 11.1%(+19.7)#3,000 |
| 53. | Francesville | 30.7% | 9.0%(+21.7)#53 | 11.1%(+19.6)#3,015 |
| 54. | Milford | 30.6% | 9.0%(+21.6)#54 | 11.1%(+19.5)#3,028 |
| 55. | Lakeville | 30.4% | 9.0%(+21.4)#55 | 11.1%(+19.4)#3,047 |
| 56. | Dana | 30.2% | 9.0%(+21.2)#56 | 11.1%(+19.2)#3,078 |
| 57. | Birdseye | 30.0% | 9.0%(+21.0)#57 | 11.1%(+18.9)#3,124 |
| 58. | Fairview | 29.7% | 9.0%(+20.7)#58 | 11.1%(+18.7)#3,180 |
| 59. | Cambridge City | 29.7% | 9.0%(+20.7)#59 | 11.1%(+18.6)#3,188 |
| 60. | Aurora | 29.6% | 9.0%(+20.6)#60 | 11.1%(+18.5)#3,201 |
| 61. | Monroe City | 29.4% | 9.0%(+20.4)#61 | 11.1%(+18.3)#3,223 |
| 62. | New Carlisle | 28.8% | 9.0%(+19.8)#62 | 11.1%(+17.7)#3,312 |
| 63. | Griffin | 28.6% | 9.0%(+19.6)#63 | 11.1%(+17.5)#3,375 |
| 64. | Henryville | 28.4% | 9.0%(+19.4)#64 | 11.1%(+17.3)#3,404 |
| 65. | Lyons | 28.1% | 9.0%(+19.1)#65 | 11.1%(+17.0)#3,446 |
| 66. | Chalmers | 28.0% | 9.0%(+19.0)#66 | 11.1%(+16.9)#3,463 |
| 67. | Elizabethtown | 27.8% | 9.0%(+18.8)#67 | 11.1%(+16.7)#3,506 |
| 68. | Attica | 27.7% | 9.0%(+18.7)#68 | 11.1%(+16.6)#3,519 |
| 69. | Napoleon | 27.3% | 9.0%(+18.3)#69 | 11.1%(+16.2)#3,600 |
| 70. | Plymouth | 27.0% | 9.0%(+18.0)#70 | 11.1%(+15.9)#3,664 |
| 71. | Warren Park | 26.4% | 9.0%(+17.4)#71 | 11.1%(+15.4)#3,768 |
| 72. | Mccordsville | 26.3% | 9.0%(+17.2)#72 | 11.1%(+15.2)#3,818 |
| 73. | Williamsport | 26.1% | 9.0%(+17.1)#73 | 11.1%(+15.0)#3,860 |
| 74. | Borden | 25.5% | 9.0%(+16.5)#74 | 11.1%(+14.4)#3,988 |
| 75. | Scottsburg | 25.1% | 9.0%(+16.1)#75 | 11.1%(+14.1)#4,043 |
| 76. | Idaville | 25.0% | 9.0%(+16.0)#76 | 11.1%(+13.9)#4,118 |
| 77. | Modoc | 25.0% | 9.0%(+16.0)#77 | 11.1%(+13.9)#4,138 |
| 78. | Shoals | 24.8% | 9.0%(+15.7)#78 | 11.1%(+13.7)#4,234 |
| 79. | Trafalgar | 24.1% | 9.0%(+15.1)#79 | 11.1%(+13.0)#4,358 |
| 80. | Chesterfield | 23.9% | 9.0%(+14.9)#80 | 11.1%(+12.8)#4,394 |
| 81. | Greendale | 23.9% | 9.0%(+14.9)#81 | 11.1%(+12.8)#4,398 |
| 82. | Thorntown | 23.8% | 9.0%(+14.8)#82 | 11.1%(+12.7)#4,414 |
| 83. | St Leon | 23.8% | 9.0%(+14.8)#83 | 11.1%(+12.7)#4,415 |
| 84. | Losantville | 23.8% | 9.0%(+14.8)#84 | 11.1%(+12.7)#4,429 |
| 85. | Butler | 23.6% | 9.0%(+14.6)#85 | 11.1%(+12.6)#4,481 |
| 86. | Seymour | 23.6% | 9.0%(+14.6)#86 | 11.1%(+12.5)#4,491 |
| 87. | Wolcott | 23.2% | 9.0%(+14.2)#87 | 11.1%(+12.1)#4,587 |
| 88. | Spring Grove | 23.1% | 9.0%(+14.1)#88 | 11.1%(+12.0)#4,621 |
| 89. | Liberty | 22.9% | 9.0%(+13.9)#89 | 11.1%(+11.8)#4,690 |
| 90. | Ashley | 22.9% | 9.0%(+13.9)#90 | 11.1%(+11.8)#4,693 |
| 91. | East Germantown | 22.7% | 9.0%(+13.7)#91 | 11.1%(+11.7)#4,737 |
| 92. | Milroy | 22.6% | 9.0%(+13.6)#92 | 11.1%(+11.6)#4,750 |
| 93. | Greensburg | 22.3% | 9.0%(+13.3)#93 | 11.1%(+11.3)#4,838 |
| 94. | Cloverdale | 22.2% | 9.0%(+13.2)#94 | 11.1%(+11.2)#4,858 |
| 95. | Zanesville | 22.2% | 9.0%(+13.2)#95 | 11.1%(+11.2)#4,876 |
| 96. | Tennyson | 22.2% | 9.0%(+13.2)#96 | 11.1%(+11.2)#4,913 |
| 97. | New Whiteland | 22.1% | 9.0%(+13.1)#97 | 11.1%(+11.0)#4,942 |
| 98. | Milan | 21.8% | 9.0%(+12.8)#98 | 11.1%(+10.7)#5,035 |
| 99. | Bourbon | 21.4% | 9.0%(+12.4)#99 | 11.1%(+10.4)#5,122 |
| 100. | New Paris | 21.2% | 9.0%(+12.2)#100 | 11.1%(+10.1)#5,212 |
Common Questions
What are the Top 10 Cities with the Highest Poverty Level Among Seniors Over the Age of 75 in Indiana?
Top 10 Cities with the Highest Poverty Level Among Seniors Over the Age of 75 in Indiana are:
#1
100.0%
#2
100.0%
#3
100.0%
#4
100.0%
#5
78.7%
#6
69.8%
#7
67.0%
#8
63.0%
#9
61.7%
#10
57.1%
What city has the Highest Poverty Level Among Seniors Over the Age of 75 in Indiana?
Manilla has the Highest Poverty Level Among Seniors Over the Age of 75 in Indiana with 100.0%.
What is the Poverty Level Among Seniors Over the Age of 75 in the State of Indiana?
Poverty Level Among Seniors Over the Age of 75 in Indiana is 9.0%.
What is the Poverty Level Among Seniors Over the Age of 75 in the United States?
Poverty Level Among Seniors Over the Age of 75 in the United States is 11.1%.