Cities with the Highest Poverty Level Among Seniors Over the Age of 75 in Texas
RELATED REPORTS & OPTIONS
Highest Poverty | Seniors 75+
Texas
Compare Cities
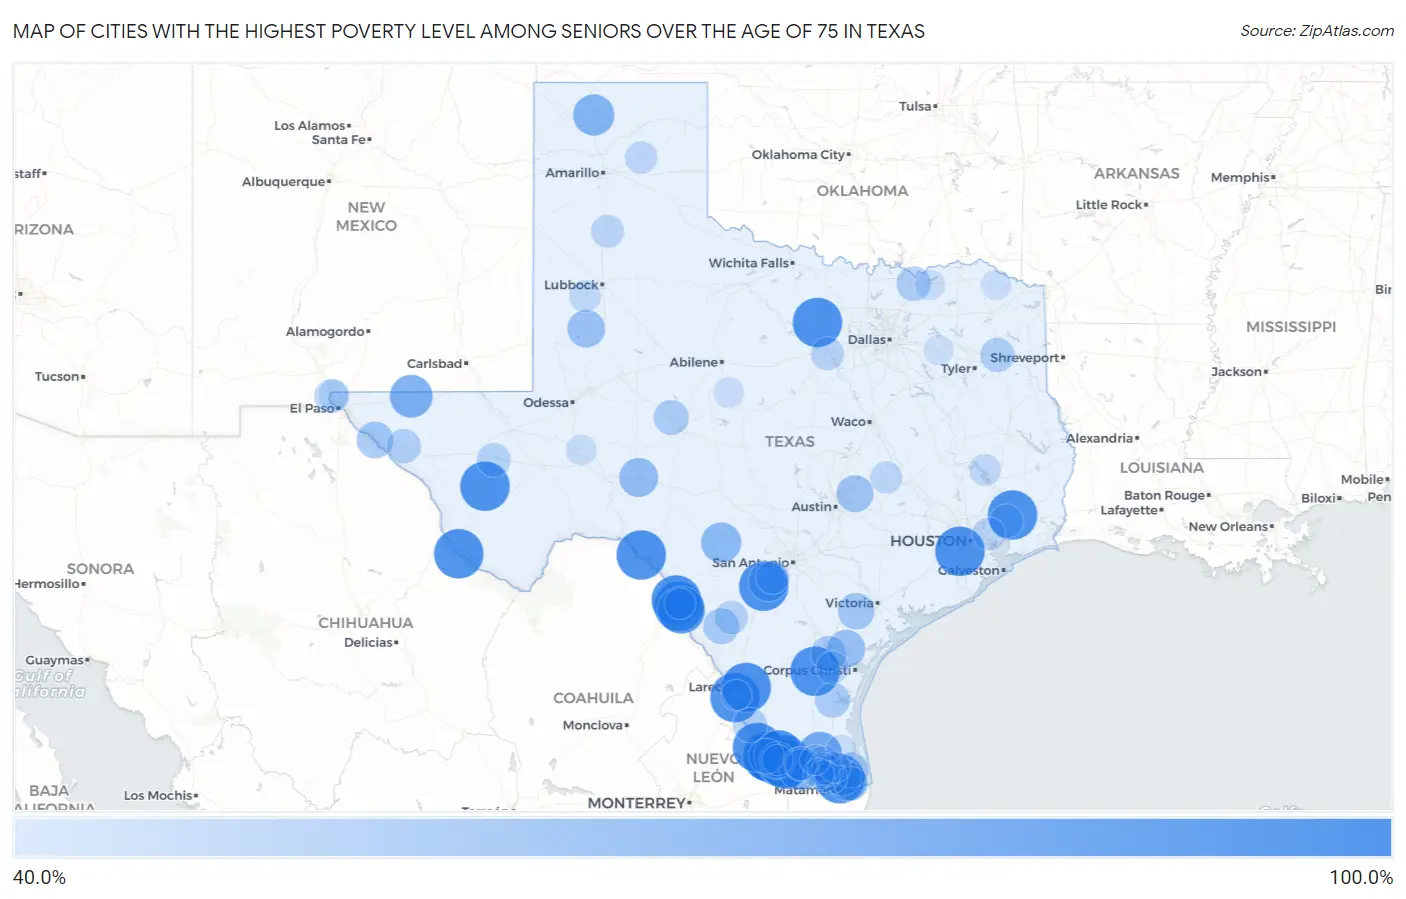
Map of Cities with the Highest Poverty Level Among Seniors Over the Age of 75 in Texas
0.0%
100.0%
Cities with the Highest Poverty Level Among Seniors Over the Age of 75 in Texas
| City | Senior Poverty | vs State | vs National | |
| 1. | Presidio | 100.0% | 12.7%(+87.3)#1 | 11.1%(+88.9)#2 |
| 2. | La Paloma | 100.0% | 12.7%(+87.3)#2 | 11.1%(+88.9)#4 |
| 3. | El Cenizo | 100.0% | 12.7%(+87.3)#3 | 11.1%(+88.9)#6 |
| 4. | Fifth Street | 100.0% | 12.7%(+87.3)#4 | 11.1%(+88.9)#14 |
| 5. | Mikes | 100.0% | 12.7%(+87.3)#5 | 11.1%(+88.9)#19 |
| 6. | Seco Mines | 100.0% | 12.7%(+87.3)#6 | 11.1%(+88.9)#20 |
| 7. | Rancho Alegre | 100.0% | 12.7%(+87.3)#7 | 11.1%(+88.9)#25 |
| 8. | Mi Ranchito Estate | 100.0% | 12.7%(+87.3)#8 | 11.1%(+88.9)#28 |
| 9. | Fort Davis | 100.0% | 12.7%(+87.3)#9 | 11.1%(+88.9)#33 |
| 10. | Pueblo Nuevo | 100.0% | 12.7%(+87.3)#10 | 11.1%(+88.9)#72 |
| 11. | Garza Salinas Ii | 100.0% | 12.7%(+87.3)#11 | 11.1%(+88.9)#79 |
| 12. | Hull | 100.0% | 12.7%(+87.3)#12 | 11.1%(+88.9)#120 |
| 13. | Lockett | 100.0% | 12.7%(+87.3)#13 | 11.1%(+88.9)#126 |
| 14. | Camargito | 100.0% | 12.7%(+87.3)#14 | 11.1%(+88.9)#149 |
| 15. | Perrin | 100.0% | 12.7%(+87.3)#15 | 11.1%(+88.9)#166 |
| 16. | Chaparrito | 100.0% | 12.7%(+87.3)#16 | 11.1%(+88.9)#176 |
| 17. | Los Alvarez | 100.0% | 12.7%(+87.3)#17 | 11.1%(+88.9)#188 |
| 18. | La Victoria | 100.0% | 12.7%(+87.3)#18 | 11.1%(+88.9)#209 |
| 19. | El Quiote | 100.0% | 12.7%(+87.3)#19 | 11.1%(+88.9)#234 |
| 20. | San Juan | 100.0% | 12.7%(+87.3)#20 | 11.1%(+88.9)#254 |
| 21. | Moore | 100.0% | 12.7%(+87.3)#21 | 11.1%(+88.9)#256 |
| 22. | Box Canyon | 100.0% | 12.7%(+87.3)#22 | 11.1%(+88.9)#270 |
| 23. | Radar Base | 100.0% | 12.7%(+87.3)#23 | 11.1%(+88.9)#283 |
| 24. | Manuel Garcia | 100.0% | 12.7%(+87.3)#24 | 11.1%(+88.9)#310 |
| 25. | Loma Linda East Cdp Jim Wells County | 100.0% | 12.7%(+87.3)#25 | 11.1%(+88.9)#359 |
| 26. | Falconaire | 100.0% | 12.7%(+87.3)#26 | 11.1%(+88.9)#380 |
| 27. | Clay | 100.0% | 12.7%(+87.3)#27 | 11.1%(+88.9)#381 |
| 28. | Rafael Pena | 100.0% | 12.7%(+87.3)#28 | 11.1%(+88.9)#387 |
| 29. | Martinez | 100.0% | 12.7%(+87.3)#29 | 11.1%(+88.9)#388 |
| 30. | Las Quintas Fronterizas | 93.9% | 12.7%(+81.2)#30 | 11.1%(+82.8)#408 |
| 31. | Hargill | 84.6% | 12.7%(+71.9)#31 | 11.1%(+73.5)#454 |
| 32. | Dell City | 81.8% | 12.7%(+69.1)#32 | 11.1%(+70.8)#480 |
| 33. | Palmview South | 81.6% | 12.7%(+68.9)#33 | 11.1%(+70.5)#482 |
| 34. | Cactus | 77.8% | 12.7%(+65.1)#34 | 11.1%(+66.7)#518 |
| 35. | Leakey | 75.0% | 12.7%(+62.3)#35 | 11.1%(+63.9)#550 |
| 36. | Priddy | 75.0% | 12.7%(+62.3)#36 | 11.1%(+63.9)#564 |
| 37. | Devine | 74.9% | 12.7%(+62.3)#37 | 11.1%(+63.9)#573 |
| 38. | Center Point | 73.8% | 12.7%(+61.2)#38 | 11.1%(+62.8)#580 |
| 39. | Olmito | 72.2% | 12.7%(+59.6)#39 | 11.1%(+61.2)#597 |
| 40. | Ozona | 71.8% | 12.7%(+59.1)#40 | 11.1%(+60.7)#602 |
| 41. | Grangerland | 69.7% | 12.7%(+57.0)#41 | 11.1%(+58.6)#627 |
| 42. | St Paul | 69.2% | 12.7%(+56.6)#42 | 11.1%(+58.2)#631 |
| 43. | Welch | 68.8% | 12.7%(+56.1)#43 | 11.1%(+57.7)#642 |
| 44. | Indian Hills | 66.7% | 12.7%(+54.0)#44 | 11.1%(+55.6)#663 |
| 45. | Coupland | 66.7% | 12.7%(+54.0)#45 | 11.1%(+55.6)#670 |
| 46. | Fort Hancock | 65.8% | 12.7%(+53.1)#46 | 11.1%(+54.7)#715 |
| 47. | Goliad | 65.6% | 12.7%(+52.9)#47 | 11.1%(+54.5)#717 |
| 48. | Palmer | 65.1% | 12.7%(+52.4)#48 | 11.1%(+54.0)#721 |
| 49. | Las Lomas | 64.8% | 12.7%(+52.1)#49 | 11.1%(+53.7)#724 |
| 50. | Asherton | 63.7% | 12.7%(+51.1)#50 | 11.1%(+52.7)#739 |
| 51. | Sandia | 63.0% | 12.7%(+50.3)#51 | 11.1%(+51.9)#760 |
| 52. | Sheridan | 62.5% | 12.7%(+49.8)#52 | 11.1%(+51.4)#772 |
| 53. | Edcouch | 62.4% | 12.7%(+49.7)#53 | 11.1%(+51.3)#781 |
| 54. | Riviera | 61.9% | 12.7%(+49.2)#54 | 11.1%(+50.8)#794 |
| 55. | Carlsbad | 61.8% | 12.7%(+49.1)#55 | 11.1%(+50.7)#795 |
| 56. | Escobares | 61.6% | 12.7%(+49.0)#56 | 11.1%(+50.6)#798 |
| 57. | La Tina Ranch | 61.5% | 12.7%(+48.9)#57 | 11.1%(+50.5)#801 |
| 58. | Savoy | 60.9% | 12.7%(+48.2)#58 | 11.1%(+49.8)#823 |
| 59. | Zapata | 60.3% | 12.7%(+47.6)#59 | 11.1%(+49.2)#830 |
| 60. | Sierra Blanca | 60.0% | 12.7%(+47.3)#60 | 11.1%(+48.9)#839 |
| 61. | Warren City | 60.0% | 12.7%(+47.3)#61 | 11.1%(+48.9)#843 |
| 62. | La Homa | 59.6% | 12.7%(+47.0)#62 | 11.1%(+48.6)#873 |
| 63. | Balmorhea | 58.8% | 12.7%(+46.2)#63 | 11.1%(+47.8)#891 |
| 64. | Canutillo | 58.6% | 12.7%(+45.9)#64 | 11.1%(+47.5)#894 |
| 65. | Cameron Park | 58.2% | 12.7%(+45.5)#65 | 11.1%(+47.1)#909 |
| 66. | Ames | 58.2% | 12.7%(+45.5)#66 | 11.1%(+47.1)#910 |
| 67. | Rice Tracts | 58.0% | 12.7%(+45.3)#67 | 11.1%(+46.9)#919 |
| 68. | Big Wells | 57.9% | 12.7%(+45.2)#68 | 11.1%(+46.8)#923 |
| 69. | Horseshoe Bend | 57.0% | 12.7%(+44.3)#69 | 11.1%(+45.9)#958 |
| 70. | Kress | 56.2% | 12.7%(+43.6)#70 | 11.1%(+45.2)#974 |
| 71. | Nada | 56.0% | 12.7%(+43.3)#71 | 11.1%(+44.9)#988 |
| 72. | Natalia | 55.9% | 12.7%(+43.2)#72 | 11.1%(+44.8)#990 |
| 73. | Barrett | 55.5% | 12.7%(+42.8)#73 | 11.1%(+44.4)#1,012 |
| 74. | Banquete | 55.3% | 12.7%(+42.6)#74 | 11.1%(+44.2)#1,021 |
| 75. | South Frydek | 55.2% | 12.7%(+42.5)#75 | 11.1%(+44.1)#1,024 |
| 76. | White Deer | 55.1% | 12.7%(+42.4)#76 | 11.1%(+44.0)#1,025 |
| 77. | East Columbia | 54.8% | 12.7%(+42.2)#77 | 11.1%(+43.8)#1,033 |
| 78. | Milano | 54.2% | 12.7%(+41.5)#78 | 11.1%(+43.1)#1,055 |
| 79. | Bluetown | 54.1% | 12.7%(+41.4)#79 | 11.1%(+43.0)#1,059 |
| 80. | Mila Doce | 53.9% | 12.7%(+41.3)#80 | 11.1%(+42.9)#1,064 |
| 81. | Onalaska | 53.6% | 12.7%(+40.9)#81 | 11.1%(+42.5)#1,076 |
| 82. | Ropesville | 53.3% | 12.7%(+40.7)#82 | 11.1%(+42.3)#1,086 |
| 83. | Progreso | 53.2% | 12.7%(+40.5)#83 | 11.1%(+42.1)#1,090 |
| 84. | Westway | 52.1% | 12.7%(+39.4)#84 | 11.1%(+41.0)#1,120 |
| 85. | Heidelberg | 51.4% | 12.7%(+38.8)#85 | 11.1%(+40.4)#1,139 |
| 86. | West Sharyland | 51.4% | 12.7%(+38.7)#86 | 11.1%(+40.3)#1,144 |
| 87. | Elm Creek | 50.7% | 12.7%(+38.1)#87 | 11.1%(+39.7)#1,163 |
| 88. | Mccamey | 50.6% | 12.7%(+37.9)#88 | 11.1%(+39.6)#1,166 |
| 89. | Primera | 50.3% | 12.7%(+37.7)#89 | 11.1%(+39.3)#1,176 |
| 90. | Rio Bravo | 50.0% | 12.7%(+37.3)#90 | 11.1%(+38.9)#1,179 |
| 91. | Scissors | 50.0% | 12.7%(+37.3)#91 | 11.1%(+38.9)#1,181 |
| 92. | San Perlita | 50.0% | 12.7%(+37.3)#92 | 11.1%(+38.9)#1,191 |
| 93. | Dodd City | 50.0% | 12.7%(+37.3)#93 | 11.1%(+38.9)#1,201 |
| 94. | Santa Rosa | 50.0% | 12.7%(+37.3)#94 | 11.1%(+38.9)#1,209 |
| 95. | Annona | 50.0% | 12.7%(+37.3)#95 | 11.1%(+38.9)#1,232 |
| 96. | Wildorado | 50.0% | 12.7%(+37.3)#96 | 11.1%(+38.9)#1,244 |
| 97. | Novice | 50.0% | 12.7%(+37.3)#97 | 11.1%(+38.9)#1,293 |
| 98. | Salineno North | 50.0% | 12.7%(+37.3)#98 | 11.1%(+38.9)#1,295 |
| 99. | Doolittle | 49.4% | 12.7%(+36.8)#99 | 11.1%(+38.4)#1,318 |
| 100. | Myrtle Springs | 49.2% | 12.7%(+36.5)#100 | 11.1%(+38.2)#1,324 |
Common Questions
What are the Top 10 Cities with the Highest Poverty Level Among Seniors Over the Age of 75 in Texas?
Top 10 Cities with the Highest Poverty Level Among Seniors Over the Age of 75 in Texas are:
#1
100.0%
#2
100.0%
#3
100.0%
#4
100.0%
#5
100.0%
#6
100.0%
#7
100.0%
#8
100.0%
#9
100.0%
#10
100.0%
What city has the Highest Poverty Level Among Seniors Over the Age of 75 in Texas?
Presidio has the Highest Poverty Level Among Seniors Over the Age of 75 in Texas with 100.0%.
What is the Poverty Level Among Seniors Over the Age of 75 in the State of Texas?
Poverty Level Among Seniors Over the Age of 75 in Texas is 12.7%.
What is the Poverty Level Among Seniors Over the Age of 75 in the United States?
Poverty Level Among Seniors Over the Age of 75 in the United States is 11.1%.