Cities with the Highest Poverty Level Among Seniors Over the Age of 75 in New York
RELATED REPORTS & OPTIONS
Highest Poverty | Seniors 75+
New York
Compare Cities
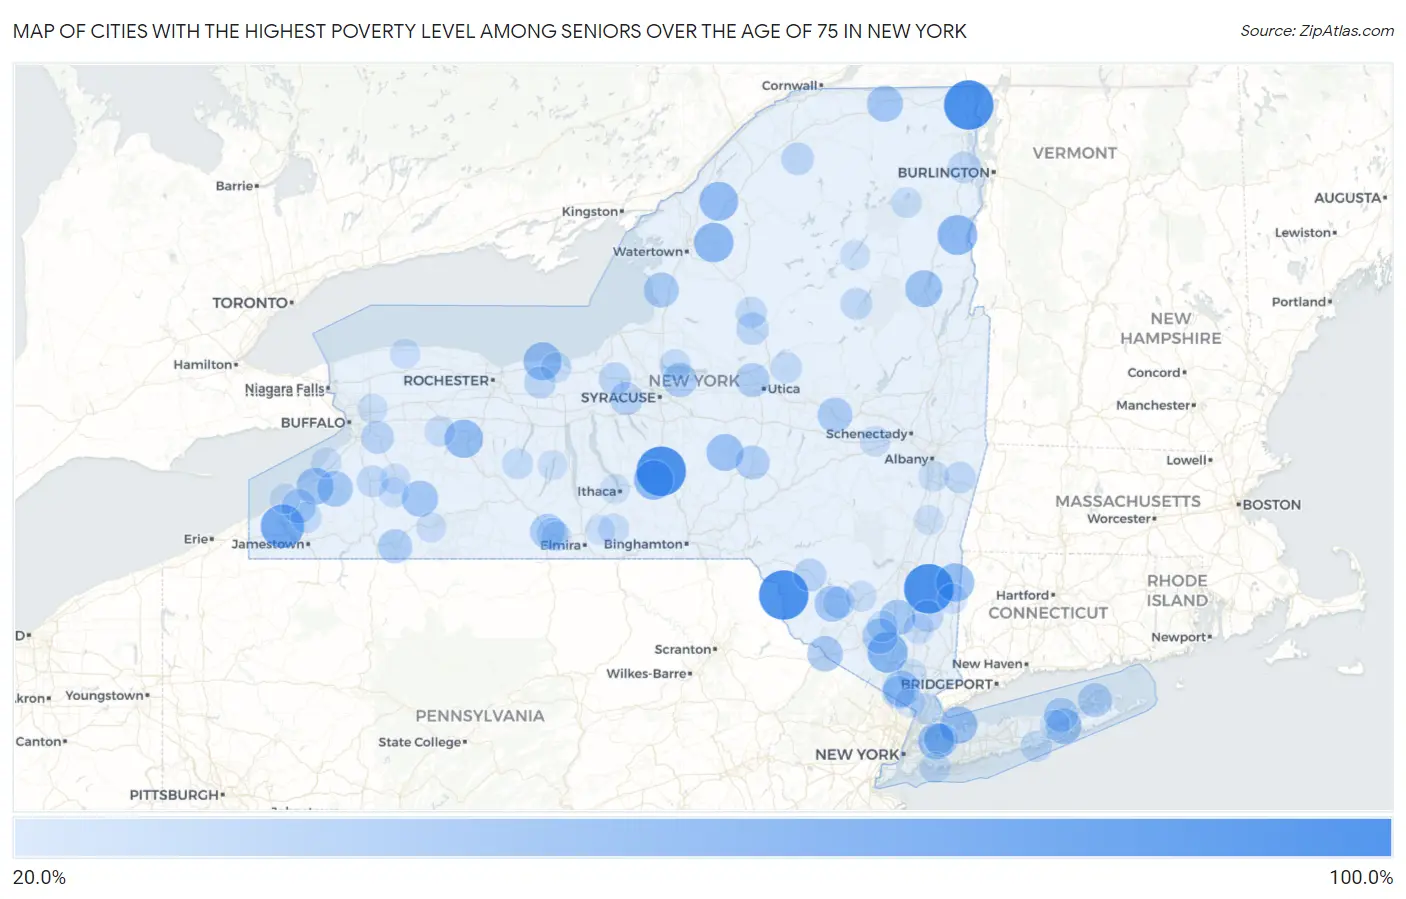
Map of Cities with the Highest Poverty Level Among Seniors Over the Age of 75 in New York
0.0%
100.0%
Cities with the Highest Poverty Level Among Seniors Over the Age of 75 in New York
| City | Senior Poverty | vs State | vs National | |
| 1. | Nazareth College | 100.0% | 13.6%(+86.4)#1 | 11.1%(+88.9)#23 |
| 2. | Chazy | 100.0% | 13.6%(+86.4)#2 | 11.1%(+88.9)#83 |
| 3. | Salt Point | 100.0% | 13.6%(+86.4)#3 | 11.1%(+88.9)#127 |
| 4. | Callicoon | 100.0% | 13.6%(+86.4)#4 | 11.1%(+88.9)#162 |
| 5. | Blodgett Mills | 100.0% | 13.6%(+86.4)#5 | 11.1%(+88.9)#163 |
| 6. | Chautauqua | 75.8% | 13.6%(+62.2)#6 | 11.1%(+64.7)#542 |
| 7. | Mountain Lodge Park | 63.2% | 13.6%(+49.6)#7 | 11.1%(+52.1)#752 |
| 8. | Witherbee | 61.1% | 13.6%(+47.5)#8 | 11.1%(+50.0)#816 |
| 9. | Deferiet | 60.0% | 13.6%(+46.4)#9 | 11.1%(+48.9)#845 |
| 10. | Virgil | 60.0% | 13.6%(+46.4)#10 | 11.1%(+48.9)#849 |
| 11. | Oxbow | 57.1% | 13.6%(+43.5)#11 | 11.1%(+46.1)#953 |
| 12. | Amenia | 56.0% | 13.6%(+42.4)#12 | 11.1%(+44.9)#986 |
| 13. | Cuylerville | 55.6% | 13.6%(+42.0)#13 | 11.1%(+44.5)#1,001 |
| 14. | Pultneyville | 54.4% | 13.6%(+40.8)#14 | 11.1%(+43.3)#1,052 |
| 15. | Rosendale | 51.7% | 13.6%(+38.1)#15 | 11.1%(+40.7)#1,128 |
| 16. | Brewster Heights | 51.6% | 13.6%(+38.0)#16 | 11.1%(+40.5)#1,134 |
| 17. | Akwesasne | 51.5% | 13.6%(+37.9)#17 | 11.1%(+40.4)#1,138 |
| 18. | Centre Island | 51.1% | 13.6%(+37.5)#18 | 11.1%(+40.0)#1,156 |
| 19. | Forestville | 50.0% | 13.6%(+36.4)#19 | 11.1%(+38.9)#1,194 |
| 20. | Smyrna | 50.0% | 13.6%(+36.4)#20 | 11.1%(+38.9)#1,246 |
| 21. | Garrattsville | 50.0% | 13.6%(+36.4)#21 | 11.1%(+38.9)#1,259 |
| 22. | Pottersville | 50.0% | 13.6%(+36.4)#22 | 11.1%(+38.9)#1,261 |
| 23. | Great Neck Gardens | 47.9% | 13.6%(+34.3)#23 | 11.1%(+36.9)#1,383 |
| 24. | Rushford | 47.1% | 13.6%(+33.5)#24 | 11.1%(+36.0)#1,431 |
| 25. | New Square | 46.9% | 13.6%(+33.3)#25 | 11.1%(+35.8)#1,439 |
| 26. | Burke | 46.7% | 13.6%(+33.1)#26 | 11.1%(+35.6)#1,461 |
| 27. | South Fallsburg | 46.1% | 13.6%(+32.5)#27 | 11.1%(+35.0)#1,493 |
| 28. | Flanders | 45.6% | 13.6%(+32.0)#28 | 11.1%(+34.5)#1,517 |
| 29. | Plattekill | 45.2% | 13.6%(+31.6)#29 | 11.1%(+34.1)#1,545 |
| 30. | Perrysburg | 45.2% | 13.6%(+31.6)#30 | 11.1%(+34.1)#1,547 |
| 31. | Port Jervis | 44.1% | 13.6%(+30.5)#31 | 11.1%(+33.1)#1,605 |
| 32. | Maybrook | 43.6% | 13.6%(+30.0)#32 | 11.1%(+32.6)#1,635 |
| 33. | Ellisburg | 42.9% | 13.6%(+29.3)#33 | 11.1%(+31.8)#1,702 |
| 34. | Coopers Plains | 41.9% | 13.6%(+28.3)#34 | 11.1%(+30.8)#1,774 |
| 35. | Nelliston | 41.8% | 13.6%(+28.2)#35 | 11.1%(+30.7)#1,779 |
| 36. | Cassadaga | 40.0% | 13.6%(+26.4)#36 | 11.1%(+28.9)#1,908 |
| 37. | Northville | 39.7% | 13.6%(+26.1)#37 | 11.1%(+28.7)#1,975 |
| 38. | St Bonaventure | 39.6% | 13.6%(+26.0)#38 | 11.1%(+28.6)#1,978 |
| 39. | Bridgeport | 39.6% | 13.6%(+26.0)#39 | 11.1%(+28.6)#1,980 |
| 40. | Oriskany | 39.2% | 13.6%(+25.6)#40 | 11.1%(+28.1)#2,006 |
| 41. | Shelter Island Heights | 39.2% | 13.6%(+25.6)#41 | 11.1%(+28.1)#2,007 |
| 42. | New Berlin | 38.5% | 13.6%(+24.9)#42 | 11.1%(+27.4)#2,071 |
| 43. | Fairview Cdp Westchester County | 37.9% | 13.6%(+24.3)#43 | 11.1%(+26.9)#2,128 |
| 44. | Cadyville | 37.9% | 13.6%(+24.3)#44 | 11.1%(+26.9)#2,130 |
| 45. | Unadilla Forks | 37.5% | 13.6%(+23.9)#45 | 11.1%(+26.4)#2,177 |
| 46. | Flower Hill | 36.9% | 13.6%(+23.3)#46 | 11.1%(+25.8)#2,229 |
| 47. | Spring Valley | 35.5% | 13.6%(+21.9)#47 | 11.1%(+24.5)#2,361 |
| 48. | Elbridge | 35.3% | 13.6%(+21.7)#48 | 11.1%(+24.2)#2,375 |
| 49. | Milton Cdp Ulster County | 35.2% | 13.6%(+21.7)#49 | 11.1%(+24.2)#2,392 |
| 50. | Livingston Manor | 34.4% | 13.6%(+20.8)#50 | 11.1%(+23.3)#2,471 |
| 51. | Billington Heights | 34.4% | 13.6%(+20.8)#51 | 11.1%(+23.3)#2,480 |
| 52. | Fairview Cdp Dutchess County | 34.0% | 13.6%(+20.4)#52 | 11.1%(+22.9)#2,514 |
| 53. | Colton | 33.3% | 13.6%(+19.7)#53 | 11.1%(+22.3)#2,632 |
| 54. | Meridian | 33.3% | 13.6%(+19.7)#54 | 11.1%(+22.3)#2,658 |
| 55. | Boonville | 33.0% | 13.6%(+19.4)#55 | 11.1%(+22.0)#2,747 |
| 56. | Hillside Lake | 31.0% | 13.6%(+17.4)#56 | 11.1%(+19.9)#2,968 |
| 57. | Woodridge | 30.9% | 13.6%(+17.3)#57 | 11.1%(+19.8)#2,974 |
| 58. | Marion | 30.9% | 13.6%(+17.3)#58 | 11.1%(+19.8)#2,979 |
| 59. | Speculator | 30.6% | 13.6%(+17.0)#59 | 11.1%(+19.5)#3,023 |
| 60. | Keeseville | 30.5% | 13.6%(+16.9)#60 | 11.1%(+19.5)#3,034 |
| 61. | Painted Post | 30.3% | 13.6%(+16.7)#61 | 11.1%(+19.2)#3,064 |
| 62. | East Nassau | 30.0% | 13.6%(+16.4)#62 | 11.1%(+18.9)#3,117 |
| 63. | Springville | 29.7% | 13.6%(+16.1)#63 | 11.1%(+18.6)#3,187 |
| 64. | Port Leyden | 29.4% | 13.6%(+15.8)#64 | 11.1%(+18.3)#3,230 |
| 65. | Mastic Beach | 28.9% | 13.6%(+15.3)#65 | 11.1%(+17.8)#3,302 |
| 66. | Walden | 28.7% | 13.6%(+15.1)#66 | 11.1%(+17.6)#3,322 |
| 67. | Cold Brook | 28.6% | 13.6%(+15.0)#67 | 11.1%(+17.5)#3,365 |
| 68. | Mount Vision | 28.6% | 13.6%(+15.0)#68 | 11.1%(+17.5)#3,376 |
| 69. | Hartsdale | 28.5% | 13.6%(+14.9)#69 | 11.1%(+17.5)#3,391 |
| 70. | Constantia | 28.3% | 13.6%(+14.7)#70 | 11.1%(+17.2)#3,412 |
| 71. | Sinclairville | 27.9% | 13.6%(+14.3)#71 | 11.1%(+16.8)#3,479 |
| 72. | Naples | 27.4% | 13.6%(+13.8)#72 | 11.1%(+16.4)#3,560 |
| 73. | Cedarhurst | 27.2% | 13.6%(+13.6)#73 | 11.1%(+16.1)#3,628 |
| 74. | Plandome Manor | 26.7% | 13.6%(+13.1)#74 | 11.1%(+15.6)#3,718 |
| 75. | Wyoming | 26.7% | 13.6%(+13.1)#75 | 11.1%(+15.6)#3,725 |
| 76. | Lake Placid | 26.2% | 13.6%(+12.6)#76 | 11.1%(+15.2)#3,821 |
| 77. | Napanoch | 26.2% | 13.6%(+12.6)#77 | 11.1%(+15.1)#3,826 |
| 78. | Ruby | 26.2% | 13.6%(+12.6)#78 | 11.1%(+15.1)#3,830 |
| 79. | Castleton On Hudson | 26.2% | 13.6%(+12.6)#79 | 11.1%(+15.1)#3,841 |
| 80. | Van Etten | 26.1% | 13.6%(+12.5)#80 | 11.1%(+15.0)#3,855 |
| 81. | Esperance | 25.8% | 13.6%(+12.2)#81 | 11.1%(+14.7)#3,926 |
| 82. | Sodus | 25.7% | 13.6%(+12.2)#82 | 11.1%(+14.7)#3,934 |
| 83. | Merritt Park | 25.7% | 13.6%(+12.1)#83 | 11.1%(+14.6)#3,937 |
| 84. | Dover Plains | 25.5% | 13.6%(+12.0)#84 | 11.1%(+14.5)#3,976 |
| 85. | Yorkshire | 25.5% | 13.6%(+11.9)#85 | 11.1%(+14.4)#3,993 |
| 86. | Brocton | 25.2% | 13.6%(+11.6)#86 | 11.1%(+14.1)#4,035 |
| 87. | Lake Erie Beach | 25.1% | 13.6%(+11.5)#87 | 11.1%(+14.0)#4,048 |
| 88. | Orangeburg | 25.0% | 13.6%(+11.4)#88 | 11.1%(+13.9)#4,053 |
| 89. | Riverside | 25.0% | 13.6%(+11.4)#89 | 11.1%(+13.9)#4,059 |
| 90. | Lime Lake | 24.7% | 13.6%(+11.1)#90 | 11.1%(+13.6)#4,239 |
| 91. | Friendship | 24.6% | 13.6%(+11.0)#91 | 11.1%(+13.5)#4,254 |
| 92. | Lyndonville | 24.5% | 13.6%(+10.9)#92 | 11.1%(+13.4)#4,270 |
| 93. | Montrose | 24.4% | 13.6%(+10.8)#93 | 11.1%(+13.4)#4,280 |
| 94. | Long Lake | 24.3% | 13.6%(+10.7)#94 | 11.1%(+13.3)#4,299 |
| 95. | Erin | 24.3% | 13.6%(+10.7)#95 | 11.1%(+13.3)#4,301 |
| 96. | Hudson | 24.2% | 13.6%(+10.6)#96 | 11.1%(+13.1)#4,323 |
| 97. | Corning | 24.1% | 13.6%(+10.5)#97 | 11.1%(+13.1)#4,338 |
| 98. | Northwest Ithaca | 24.1% | 13.6%(+10.5)#98 | 11.1%(+13.0)#4,352 |
| 99. | Keuka Park | 23.9% | 13.6%(+10.3)#99 | 11.1%(+12.8)#4,386 |
| 100. | Harris Hill | 23.8% | 13.6%(+10.2)#100 | 11.1%(+12.8)#4,406 |
Common Questions
What are the Top 10 Cities with the Highest Poverty Level Among Seniors Over the Age of 75 in New York?
Top 10 Cities with the Highest Poverty Level Among Seniors Over the Age of 75 in New York are:
#1
100.0%
#2
100.0%
#3
100.0%
#4
100.0%
#5
75.8%
#6
63.2%
#7
61.1%
#8
60.0%
#9
60.0%
#10
57.1%
What city has the Highest Poverty Level Among Seniors Over the Age of 75 in New York?
Chazy has the Highest Poverty Level Among Seniors Over the Age of 75 in New York with 100.0%.
What is the Poverty Level Among Seniors Over the Age of 75 in the State of New York?
Poverty Level Among Seniors Over the Age of 75 in New York is 13.6%.
What is the Poverty Level Among Seniors Over the Age of 75 in the United States?
Poverty Level Among Seniors Over the Age of 75 in the United States is 11.1%.