Cities with the Highest Poverty Level Among Seniors Over the Age of 75 in Kansas
RELATED REPORTS & OPTIONS
Highest Poverty | Seniors 75+
Kansas
Compare Cities
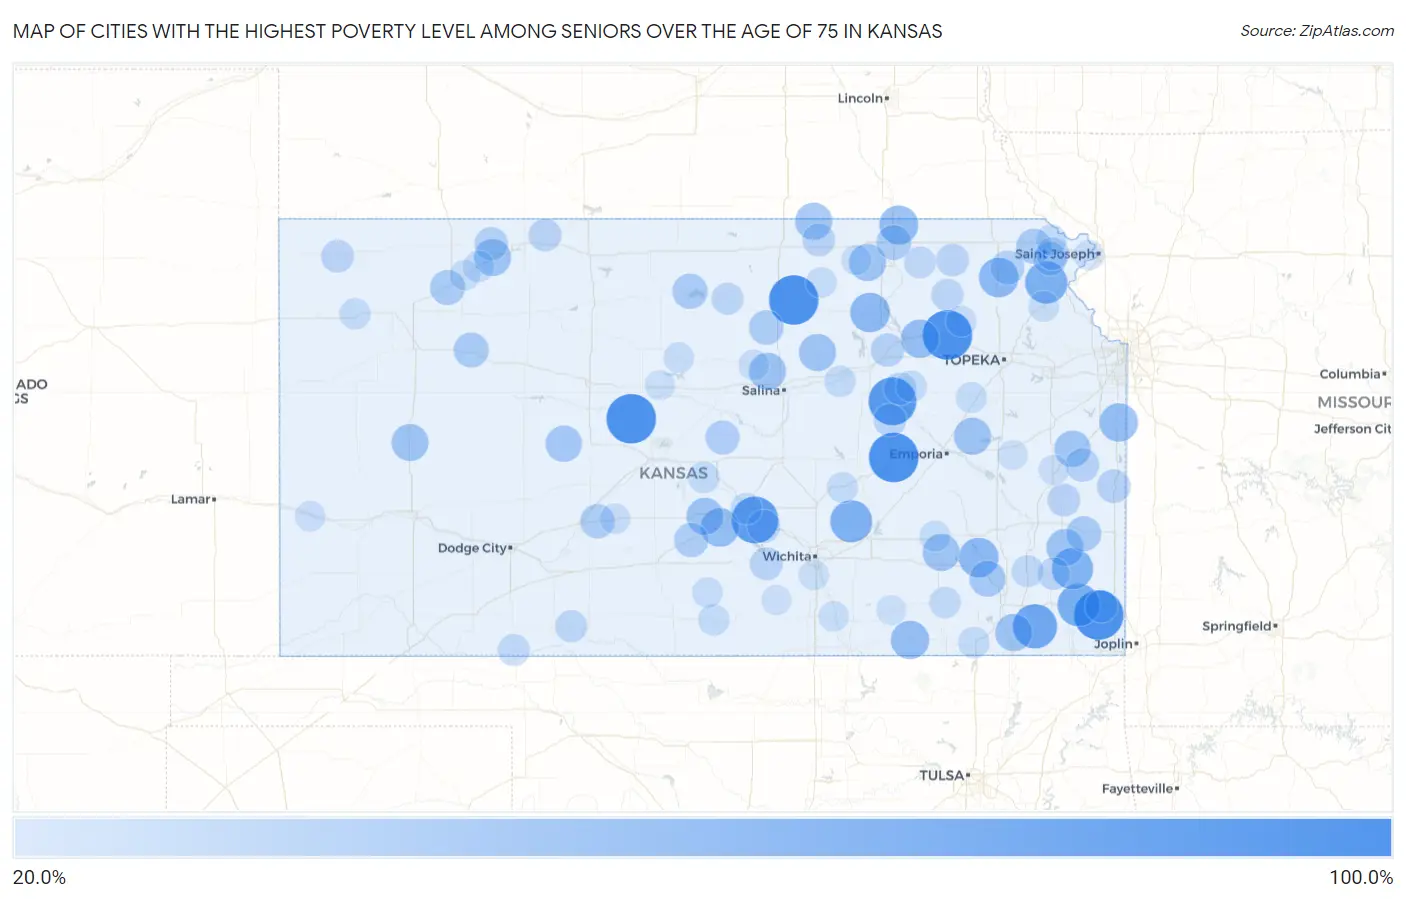
Map of Cities with the Highest Poverty Level Among Seniors Over the Age of 75 in Kansas
0.0%
100.0%
Cities with the Highest Poverty Level Among Seniors Over the Age of 75 in Kansas
| City | Senior Poverty | vs State | vs National | |
| 1. | Belvue | 100.0% | 9.7%(+90.3)#1 | 11.1%(+88.9)#185 |
| 2. | Aurora | 100.0% | 9.7%(+90.3)#2 | 11.1%(+88.9)#295 |
| 3. | Elmdale | 100.0% | 9.7%(+90.3)#3 | 11.1%(+88.9)#326 |
| 4. | Roseland | 100.0% | 9.7%(+90.3)#4 | 11.1%(+88.9)#346 |
| 5. | Silverdale | 100.0% | 9.7%(+90.3)#5 | 11.1%(+88.9)#357 |
| 6. | Galatia | 100.0% | 9.7%(+90.3)#6 | 11.1%(+88.9)#379 |
| 7. | Parkerville | 92.9% | 9.7%(+83.2)#7 | 11.1%(+81.8)#411 |
| 8. | Yoder | 88.9% | 9.7%(+79.2)#8 | 11.1%(+77.8)#429 |
| 9. | Mound Valley | 78.4% | 9.7%(+68.7)#9 | 11.1%(+67.3)#514 |
| 10. | Mccune | 71.4% | 9.7%(+61.7)#10 | 11.1%(+60.4)#607 |
| 11. | Lancaster | 70.6% | 9.7%(+60.9)#11 | 11.1%(+59.5)#614 |
| 12. | Potwin | 69.5% | 9.7%(+59.8)#12 | 11.1%(+58.5)#629 |
| 13. | Walnut | 66.7% | 9.7%(+57.0)#13 | 11.1%(+55.6)#684 |
| 14. | Leonardville | 60.0% | 9.7%(+50.3)#14 | 11.1%(+48.9)#837 |
| 15. | Netawaka | 60.0% | 9.7%(+50.3)#15 | 11.1%(+48.9)#855 |
| 16. | Coyville | 60.0% | 9.7%(+50.3)#16 | 11.1%(+48.9)#864 |
| 17. | Oketo | 57.1% | 9.7%(+47.4)#17 | 11.1%(+46.1)#952 |
| 18. | Arlington | 55.6% | 9.7%(+45.9)#18 | 11.1%(+44.5)#998 |
| 19. | Louisburg | 55.2% | 9.7%(+45.5)#19 | 11.1%(+44.2)#1,023 |
| 20. | Cedar Vale | 55.0% | 9.7%(+45.3)#20 | 11.1%(+43.9)#1,027 |
| 21. | St George | 54.5% | 9.7%(+44.8)#21 | 11.1%(+43.5)#1,037 |
| 22. | Reading | 50.0% | 9.7%(+40.3)#22 | 11.1%(+38.9)#1,254 |
| 23. | Barnes | 50.0% | 9.7%(+40.3)#23 | 11.1%(+38.9)#1,260 |
| 24. | Liberty | 50.0% | 9.7%(+40.3)#24 | 11.1%(+38.9)#1,266 |
| 25. | Plevna | 50.0% | 9.7%(+40.3)#25 | 11.1%(+38.9)#1,273 |
| 26. | Savonburg | 50.0% | 9.7%(+40.3)#26 | 11.1%(+38.9)#1,279 |
| 27. | Clayton | 50.0% | 9.7%(+40.3)#27 | 11.1%(+38.9)#1,296 |
| 28. | Culver | 50.0% | 9.7%(+40.3)#28 | 11.1%(+38.9)#1,298 |
| 29. | Manchester | 50.0% | 9.7%(+40.3)#29 | 11.1%(+38.9)#1,300 |
| 30. | Mahaska | 50.0% | 9.7%(+40.3)#30 | 11.1%(+38.9)#1,305 |
| 31. | Climax | 50.0% | 9.7%(+40.3)#31 | 11.1%(+38.9)#1,306 |
| 32. | Scott City | 49.6% | 9.7%(+39.9)#32 | 11.1%(+38.5)#1,315 |
| 33. | Lane | 47.1% | 9.7%(+37.4)#33 | 11.1%(+36.0)#1,434 |
| 34. | Alexander | 46.7% | 9.7%(+37.0)#34 | 11.1%(+35.6)#1,466 |
| 35. | Fredonia | 45.5% | 9.7%(+35.8)#35 | 11.1%(+34.4)#1,522 |
| 36. | Cawker City | 42.6% | 9.7%(+32.9)#36 | 11.1%(+31.5)#1,725 |
| 37. | Uniontown | 41.7% | 9.7%(+32.0)#37 | 11.1%(+30.6)#1,789 |
| 38. | Selden | 41.7% | 9.7%(+32.0)#38 | 11.1%(+30.6)#1,791 |
| 39. | Robinson | 41.7% | 9.7%(+32.0)#39 | 11.1%(+30.6)#1,796 |
| 40. | Park | 41.7% | 9.7%(+32.0)#40 | 11.1%(+30.6)#1,801 |
| 41. | Marysville | 41.3% | 9.7%(+31.6)#41 | 11.1%(+30.2)#1,821 |
| 42. | Delphos | 40.5% | 9.7%(+30.8)#42 | 11.1%(+29.4)#1,871 |
| 43. | Lewis | 39.4% | 9.7%(+29.7)#43 | 11.1%(+28.3)#1,996 |
| 44. | Turon | 39.3% | 9.7%(+29.6)#44 | 11.1%(+28.2)#2,004 |
| 45. | Geneseo | 38.5% | 9.7%(+28.8)#45 | 11.1%(+27.4)#2,080 |
| 46. | Kickapoo Tribal Center | 37.5% | 9.7%(+27.8)#46 | 11.1%(+26.4)#2,183 |
| 47. | Pleasanton | 36.0% | 9.7%(+26.3)#47 | 11.1%(+24.9)#2,310 |
| 48. | Parker | 35.7% | 9.7%(+26.0)#48 | 11.1%(+24.6)#2,337 |
| 49. | Norcatur | 35.7% | 9.7%(+26.0)#49 | 11.1%(+24.6)#2,341 |
| 50. | Denton | 35.7% | 9.7%(+26.0)#50 | 11.1%(+24.6)#2,345 |
| 51. | Ogden | 35.3% | 9.7%(+25.6)#51 | 11.1%(+24.2)#2,374 |
| 52. | Haven | 34.8% | 9.7%(+25.1)#52 | 11.1%(+23.8)#2,430 |
| 53. | Cheney | 33.6% | 9.7%(+23.9)#53 | 11.1%(+22.5)#2,547 |
| 54. | Bird City | 33.3% | 9.7%(+23.6)#54 | 11.1%(+22.3)#2,604 |
| 55. | Centralia | 33.3% | 9.7%(+23.6)#55 | 11.1%(+22.3)#2,612 |
| 56. | Almena | 33.3% | 9.7%(+23.6)#56 | 11.1%(+22.3)#2,619 |
| 57. | Wilsey | 33.3% | 9.7%(+23.6)#57 | 11.1%(+22.3)#2,681 |
| 58. | Haddam | 33.3% | 9.7%(+23.6)#58 | 11.1%(+22.3)#2,689 |
| 59. | Kincaid | 33.3% | 9.7%(+23.6)#59 | 11.1%(+22.3)#2,713 |
| 60. | Severance | 33.3% | 9.7%(+23.6)#60 | 11.1%(+22.3)#2,721 |
| 61. | Cherokee | 32.3% | 9.7%(+22.6)#61 | 11.1%(+21.2)#2,813 |
| 62. | Dwight | 31.8% | 9.7%(+22.1)#62 | 11.1%(+20.8)#2,865 |
| 63. | Onaga | 31.5% | 9.7%(+21.8)#63 | 11.1%(+20.4)#2,906 |
| 64. | Erie | 30.9% | 9.7%(+21.2)#64 | 11.1%(+19.8)#2,976 |
| 65. | Beloit | 30.3% | 9.7%(+20.6)#65 | 11.1%(+19.3)#3,059 |
| 66. | Protection | 30.2% | 9.7%(+20.5)#66 | 11.1%(+19.1)#3,083 |
| 67. | Earlton | 30.0% | 9.7%(+20.3)#67 | 11.1%(+18.9)#3,143 |
| 68. | Englewood | 30.0% | 9.7%(+20.3)#68 | 11.1%(+18.9)#3,147 |
| 69. | Frankfort | 29.5% | 9.7%(+19.8)#69 | 11.1%(+18.5)#3,206 |
| 70. | Alden | 28.6% | 9.7%(+18.9)#70 | 11.1%(+17.5)#3,373 |
| 71. | Elk Falls | 28.6% | 9.7%(+18.9)#71 | 11.1%(+17.5)#3,379 |
| 72. | Havana | 28.6% | 9.7%(+18.9)#72 | 11.1%(+17.5)#3,383 |
| 73. | South Hutchinson | 28.3% | 9.7%(+18.6)#73 | 11.1%(+17.2)#3,416 |
| 74. | Enterprise | 27.6% | 9.7%(+17.9)#74 | 11.1%(+16.5)#3,531 |
| 75. | Brewster | 27.6% | 9.7%(+17.9)#75 | 11.1%(+16.5)#3,536 |
| 76. | Attica | 27.5% | 9.7%(+17.8)#76 | 11.1%(+16.4)#3,550 |
| 77. | Alta Vista | 27.3% | 9.7%(+17.6)#77 | 11.1%(+16.2)#3,591 |
| 78. | Jennings | 27.3% | 9.7%(+17.6)#78 | 11.1%(+16.2)#3,615 |
| 79. | Eureka | 26.6% | 9.7%(+16.9)#79 | 11.1%(+15.5)#3,745 |
| 80. | Highland | 26.4% | 9.7%(+16.7)#80 | 11.1%(+15.3)#3,775 |
| 81. | Peabody | 26.3% | 9.7%(+16.6)#81 | 11.1%(+15.2)#3,792 |
| 82. | Harveyville | 26.3% | 9.7%(+16.6)#82 | 11.1%(+15.2)#3,811 |
| 83. | Clifton | 25.7% | 9.7%(+16.0)#83 | 11.1%(+14.6)#3,943 |
| 84. | Nortonville | 25.6% | 9.7%(+15.9)#84 | 11.1%(+14.5)#3,967 |
| 85. | Lucas | 25.0% | 9.7%(+15.3)#85 | 11.1%(+13.9)#4,107 |
| 86. | Tescott | 25.0% | 9.7%(+15.3)#86 | 11.1%(+13.9)#4,124 |
| 87. | Emmett | 25.0% | 9.7%(+15.3)#87 | 11.1%(+13.9)#4,147 |
| 88. | Zenda | 25.0% | 9.7%(+15.3)#88 | 11.1%(+13.9)#4,187 |
| 89. | Dresden | 25.0% | 9.7%(+15.3)#89 | 11.1%(+13.9)#4,190 |
| 90. | Belpre | 25.0% | 9.7%(+15.3)#90 | 11.1%(+13.9)#4,196 |
| 91. | Syracuse | 24.8% | 9.7%(+15.1)#91 | 11.1%(+13.8)#4,218 |
| 92. | Garnett | 24.5% | 9.7%(+14.8)#92 | 11.1%(+13.4)#4,268 |
| 93. | Wathena | 24.3% | 9.7%(+14.6)#93 | 11.1%(+13.2)#4,309 |
| 94. | Haysville | 24.1% | 9.7%(+14.4)#94 | 11.1%(+13.0)#4,356 |
| 95. | Oxford | 23.9% | 9.7%(+14.2)#95 | 11.1%(+12.8)#4,392 |
| 96. | Greenleaf | 23.8% | 9.7%(+14.1)#96 | 11.1%(+12.7)#4,427 |
| 97. | Conway Springs | 23.7% | 9.7%(+14.0)#97 | 11.1%(+12.6)#4,479 |
| 98. | Waverly | 23.5% | 9.7%(+13.8)#98 | 11.1%(+12.5)#4,507 |
| 99. | Cambridge | 23.5% | 9.7%(+13.8)#99 | 11.1%(+12.5)#4,518 |
| 100. | Bunker Hill | 23.1% | 9.7%(+13.4)#100 | 11.1%(+12.0)#4,641 |
Common Questions
What are the Top 10 Cities with the Highest Poverty Level Among Seniors Over the Age of 75 in Kansas?
Top 10 Cities with the Highest Poverty Level Among Seniors Over the Age of 75 in Kansas are:
#1
100.0%
#2
100.0%
#3
100.0%
#4
100.0%
#5
100.0%
#6
92.9%
#7
88.9%
#8
78.4%
#9
71.4%
#10
70.6%
What city has the Highest Poverty Level Among Seniors Over the Age of 75 in Kansas?
Belvue has the Highest Poverty Level Among Seniors Over the Age of 75 in Kansas with 100.0%.
What is the Poverty Level Among Seniors Over the Age of 75 in the State of Kansas?
Poverty Level Among Seniors Over the Age of 75 in Kansas is 9.7%.
What is the Poverty Level Among Seniors Over the Age of 75 in the United States?
Poverty Level Among Seniors Over the Age of 75 in the United States is 11.1%.