Cities with the Highest Poverty Level Among Seniors Over the Age of 75 in Virginia
RELATED REPORTS & OPTIONS
Highest Poverty | Seniors 75+
Virginia
Compare Cities
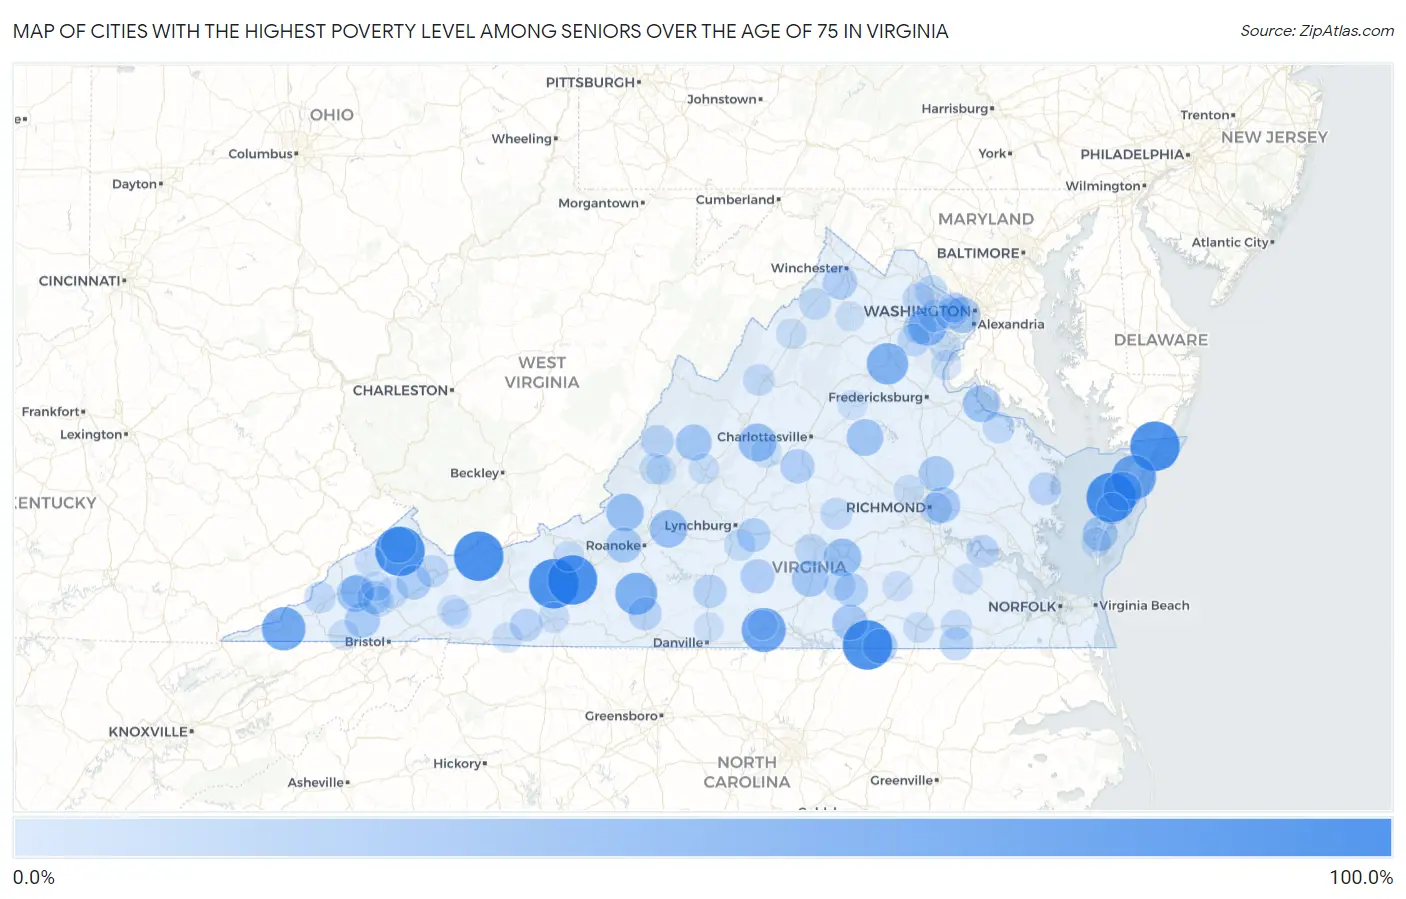
Map of Cities with the Highest Poverty Level Among Seniors Over the Age of 75 in Virginia
0.0%
100.0%
Cities with the Highest Poverty Level Among Seniors Over the Age of 75 in Virginia
| City | Senior Poverty | vs State | vs National | |
| 1. | Springville | 100.0% | 9.2%(+90.8)#1 | 11.1%(+88.9)#29 |
| 2. | Barboursville | 100.0% | 9.2%(+90.8)#2 | 11.1%(+88.9)#52 |
| 3. | Horntown | 100.0% | 9.2%(+90.8)#3 | 11.1%(+88.9)#85 |
| 4. | Draper | 100.0% | 9.2%(+90.8)#4 | 11.1%(+88.9)#86 |
| 5. | Boston | 100.0% | 9.2%(+90.8)#5 | 11.1%(+88.9)#91 |
| 6. | Vansant | 100.0% | 9.2%(+90.8)#6 | 11.1%(+88.9)#159 |
| 7. | Falls Mills | 100.0% | 9.2%(+90.8)#7 | 11.1%(+88.9)#223 |
| 8. | Ebony | 100.0% | 9.2%(+90.8)#8 | 11.1%(+88.9)#225 |
| 9. | Willis Wharf | 100.0% | 9.2%(+90.8)#9 | 11.1%(+88.9)#261 |
| 10. | Snowville | 100.0% | 9.2%(+90.8)#10 | 11.1%(+88.9)#272 |
| 11. | Pastoria | 79.0% | 9.2%(+69.8)#11 | 11.1%(+68.0)#504 |
| 12. | Riverdale | 77.1% | 9.2%(+67.9)#12 | 11.1%(+66.0)#527 |
| 13. | Jonesville | 74.7% | 9.2%(+65.5)#13 | 11.1%(+63.6)#574 |
| 14. | Ferrum | 68.0% | 9.2%(+58.8)#14 | 11.1%(+56.9)#649 |
| 15. | Remington | 65.5% | 9.2%(+56.3)#15 | 11.1%(+54.5)#719 |
| 16. | Fairfield | 56.1% | 9.2%(+46.9)#16 | 11.1%(+45.1)#980 |
| 17. | Melfa | 54.5% | 9.2%(+45.3)#17 | 11.1%(+43.5)#1,040 |
| 18. | Yorkshire | 53.8% | 9.2%(+44.6)#18 | 11.1%(+42.8)#1,065 |
| 19. | Sherando | 51.4% | 9.2%(+42.2)#19 | 11.1%(+40.3)#1,147 |
| 20. | Disputanta | 50.0% | 9.2%(+40.8)#20 | 11.1%(+38.9)#1,190 |
| 21. | Burkeville | 50.0% | 9.2%(+40.8)#21 | 11.1%(+38.9)#1,199 |
| 22. | Montvale | 50.0% | 9.2%(+40.8)#22 | 11.1%(+38.9)#1,203 |
| 23. | New Castle | 50.0% | 9.2%(+40.8)#23 | 11.1%(+38.9)#1,236 |
| 24. | Colonial Beach | 46.8% | 9.2%(+37.6)#24 | 11.1%(+35.7)#1,443 |
| 25. | Brandy Station | 46.7% | 9.2%(+37.5)#25 | 11.1%(+35.6)#1,463 |
| 26. | Louisa | 46.3% | 9.2%(+37.1)#26 | 11.1%(+35.2)#1,478 |
| 27. | Riverview | 44.4% | 9.2%(+35.2)#27 | 11.1%(+33.4)#1,588 |
| 28. | Grundy | 44.0% | 9.2%(+34.8)#28 | 11.1%(+32.9)#1,611 |
| 29. | Keysville | 43.8% | 9.2%(+34.6)#29 | 11.1%(+32.7)#1,620 |
| 30. | Seven Corners | 43.4% | 9.2%(+34.2)#30 | 11.1%(+32.3)#1,655 |
| 31. | Goshen | 43.3% | 9.2%(+34.1)#31 | 11.1%(+32.3)#1,657 |
| 32. | South Hill | 41.9% | 9.2%(+32.7)#32 | 11.1%(+30.9)#1,765 |
| 33. | Highland Springs | 41.4% | 9.2%(+32.2)#33 | 11.1%(+30.3)#1,812 |
| 34. | Glenvar | 40.1% | 9.2%(+30.9)#34 | 11.1%(+29.1)#1,889 |
| 35. | Nickelsville | 40.0% | 9.2%(+30.8)#35 | 11.1%(+28.9)#1,919 |
| 36. | Hanover | 40.0% | 9.2%(+30.8)#36 | 11.1%(+28.9)#1,946 |
| 37. | Eastville | 39.5% | 9.2%(+30.3)#37 | 11.1%(+28.4)#1,991 |
| 38. | Gasburg | 37.9% | 9.2%(+28.7)#38 | 11.1%(+26.8)#2,136 |
| 39. | Honaker | 36.6% | 9.2%(+27.4)#39 | 11.1%(+25.6)#2,254 |
| 40. | Stephens City | 36.2% | 9.2%(+27.0)#40 | 11.1%(+25.2)#2,301 |
| 41. | Brookneal | 36.0% | 9.2%(+26.8)#41 | 11.1%(+24.9)#2,311 |
| 42. | Esmont | 35.8% | 9.2%(+26.6)#42 | 11.1%(+24.7)#2,322 |
| 43. | Concord | 34.0% | 9.2%(+24.8)#43 | 11.1%(+23.0)#2,508 |
| 44. | Kenbridge | 33.6% | 9.2%(+24.4)#44 | 11.1%(+22.5)#2,545 |
| 45. | Coeburn | 33.3% | 9.2%(+24.1)#45 | 11.1%(+22.3)#2,569 |
| 46. | St Paul | 33.3% | 9.2%(+24.1)#46 | 11.1%(+22.3)#2,574 |
| 47. | Boykins | 32.1% | 9.2%(+22.9)#47 | 11.1%(+21.1)#2,827 |
| 48. | Oak Level | 32.1% | 9.2%(+22.9)#48 | 11.1%(+21.0)#2,831 |
| 49. | Gretna | 32.1% | 9.2%(+22.9)#49 | 11.1%(+21.0)#2,832 |
| 50. | Bull Run | 31.8% | 9.2%(+22.6)#50 | 11.1%(+20.7)#2,871 |
| 51. | Claremont | 30.0% | 9.2%(+20.8)#51 | 11.1%(+18.9)#3,118 |
| 52. | Fries | 29.8% | 9.2%(+20.6)#52 | 11.1%(+18.8)#3,164 |
| 53. | Hot Springs | 29.8% | 9.2%(+20.6)#53 | 11.1%(+18.7)#3,172 |
| 54. | Irvington | 29.6% | 9.2%(+20.4)#54 | 11.1%(+18.6)#3,194 |
| 55. | Nokesville | 29.3% | 9.2%(+20.1)#55 | 11.1%(+18.2)#3,250 |
| 56. | Fair Lakes | 29.3% | 9.2%(+20.1)#56 | 11.1%(+18.2)#3,252 |
| 57. | Hampden Sydney | 29.2% | 9.2%(+20.0)#57 | 11.1%(+18.1)#3,266 |
| 58. | Richlands | 28.4% | 9.2%(+19.2)#58 | 11.1%(+17.4)#3,400 |
| 59. | Montrose | 28.1% | 9.2%(+18.9)#59 | 11.1%(+17.0)#3,441 |
| 60. | Dulles Town Center | 27.6% | 9.2%(+18.4)#60 | 11.1%(+16.5)#3,527 |
| 61. | Brambleton | 27.5% | 9.2%(+18.3)#61 | 11.1%(+16.4)#3,545 |
| 62. | Exmore | 27.1% | 9.2%(+17.9)#62 | 11.1%(+16.1)#3,633 |
| 63. | Merrifield | 27.1% | 9.2%(+17.9)#63 | 11.1%(+16.0)#3,642 |
| 64. | Cumberland | 26.8% | 9.2%(+17.6)#64 | 11.1%(+15.8)#3,699 |
| 65. | Cleveland | 26.7% | 9.2%(+17.5)#65 | 11.1%(+15.6)#3,728 |
| 66. | Dayton | 26.4% | 9.2%(+17.2)#66 | 11.1%(+15.3)#3,773 |
| 67. | Toms Brook | 26.3% | 9.2%(+17.1)#67 | 11.1%(+15.2)#3,802 |
| 68. | Appalachia | 26.3% | 9.2%(+17.1)#68 | 11.1%(+15.2)#3,819 |
| 69. | Montross | 25.9% | 9.2%(+16.7)#69 | 11.1%(+14.9)#3,894 |
| 70. | Victoria | 25.8% | 9.2%(+16.6)#70 | 11.1%(+14.7)#3,928 |
| 71. | Rustburg | 25.5% | 9.2%(+16.3)#71 | 11.1%(+14.4)#3,985 |
| 72. | Allison Gap | 25.0% | 9.2%(+15.8)#72 | 11.1%(+13.9)#4,091 |
| 73. | Selma | 25.0% | 9.2%(+15.8)#73 | 11.1%(+13.9)#4,105 |
| 74. | Castlewood | 23.9% | 9.2%(+14.7)#74 | 11.1%(+12.8)#4,399 |
| 75. | Emporia | 22.6% | 9.2%(+13.4)#75 | 11.1%(+11.5)#4,763 |
| 76. | Pimmit Hills | 22.6% | 9.2%(+13.4)#76 | 11.1%(+11.5)#4,781 |
| 77. | Short Pump | 22.3% | 9.2%(+13.1)#77 | 11.1%(+11.2)#4,849 |
| 78. | Hillsville | 22.2% | 9.2%(+13.0)#78 | 11.1%(+11.2)#4,856 |
| 79. | Capron | 22.2% | 9.2%(+13.0)#79 | 11.1%(+11.2)#4,917 |
| 80. | Potomac Mills | 22.2% | 9.2%(+13.0)#80 | 11.1%(+11.1)#4,930 |
| 81. | East Lexington | 22.0% | 9.2%(+12.8)#81 | 11.1%(+11.0)#4,958 |
| 82. | Belspring | 22.0% | 9.2%(+12.8)#82 | 11.1%(+10.9)#4,964 |
| 83. | Gate City | 22.0% | 9.2%(+12.8)#83 | 11.1%(+10.9)#4,974 |
| 84. | Nellysford | 21.9% | 9.2%(+12.7)#84 | 11.1%(+10.9)#4,987 |
| 85. | Mount Jackson | 21.6% | 9.2%(+12.4)#85 | 11.1%(+10.5)#5,094 |
| 86. | Waverly | 21.0% | 9.2%(+11.8)#86 | 11.1%(+9.95)#5,264 |
| 87. | Seven Mile Ford | 20.9% | 9.2%(+11.7)#87 | 11.1%(+9.86)#5,285 |
| 88. | Tysons | 20.9% | 9.2%(+11.7)#88 | 11.1%(+9.80)#5,304 |
| 89. | Independence | 20.8% | 9.2%(+11.6)#89 | 11.1%(+9.73)#5,328 |
| 90. | Quantico | 20.7% | 9.2%(+11.5)#90 | 11.1%(+9.62)#5,370 |
| 91. | Clinchco | 20.6% | 9.2%(+11.4)#91 | 11.1%(+9.52)#5,406 |
| 92. | Mckenney | 20.5% | 9.2%(+11.3)#92 | 11.1%(+9.39)#5,452 |
| 93. | Cheriton | 20.4% | 9.2%(+11.2)#93 | 11.1%(+9.32)#5,466 |
| 94. | South Boston | 20.2% | 9.2%(+11.0)#94 | 11.1%(+9.10)#5,530 |
| 95. | Orange | 19.8% | 9.2%(+10.6)#95 | 11.1%(+8.74)#5,757 |
| 96. | Blairs | 19.7% | 9.2%(+10.5)#96 | 11.1%(+8.67)#5,777 |
| 97. | Adwolf | 19.7% | 9.2%(+10.5)#97 | 11.1%(+8.61)#5,793 |
| 98. | Iron Gate | 19.6% | 9.2%(+10.4)#98 | 11.1%(+8.50)#5,833 |
| 99. | Chester Gap | 19.5% | 9.2%(+10.3)#99 | 11.1%(+8.45)#5,848 |
| 100. | Dante | 19.5% | 9.2%(+10.3)#100 | 11.1%(+8.45)#5,849 |
Common Questions
What are the Top 10 Cities with the Highest Poverty Level Among Seniors Over the Age of 75 in Virginia?
Top 10 Cities with the Highest Poverty Level Among Seniors Over the Age of 75 in Virginia are:
#1
100.0%
#2
100.0%
#3
100.0%
#4
100.0%
#5
100.0%
#6
100.0%
#7
100.0%
#8
79.0%
#9
77.1%
#10
74.7%
What city has the Highest Poverty Level Among Seniors Over the Age of 75 in Virginia?
Springville has the Highest Poverty Level Among Seniors Over the Age of 75 in Virginia with 100.0%.
What is the Poverty Level Among Seniors Over the Age of 75 in the State of Virginia?
Poverty Level Among Seniors Over the Age of 75 in Virginia is 9.2%.
What is the Poverty Level Among Seniors Over the Age of 75 in the United States?
Poverty Level Among Seniors Over the Age of 75 in the United States is 11.1%.