Cities with the Highest Poverty Level Among Seniors Over the Age of 75 in Oklahoma
RELATED REPORTS & OPTIONS
Highest Poverty | Seniors 75+
Oklahoma
Compare Cities
Map of Cities with the Highest Poverty Level Among Seniors Over the Age of 75 in Oklahoma
0.0%
100.0%
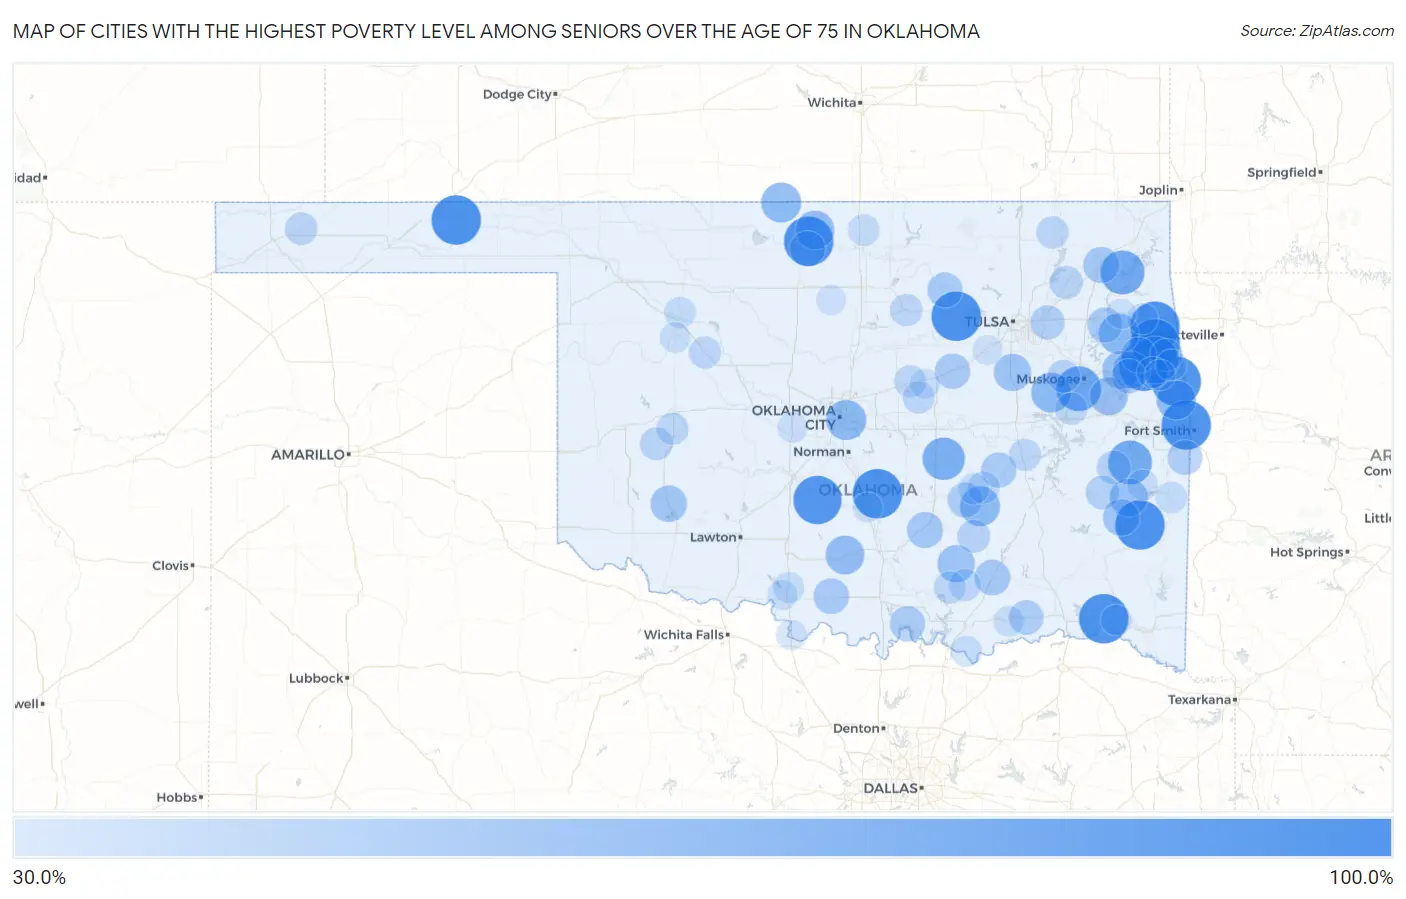
Cities with the Highest Poverty Level Among Seniors Over the Age of 75 in Oklahoma
| City | Senior Poverty | vs State | vs National | |
| 1. | Caney | 100.0% | 9.7% (+90.3)#1 | 11.1% (+88.9)#94 |
| 2. | Turpin | 100.0% | 9.7% (+90.3)#2 | 11.1% (+88.9)#104 |
| 3. | Chewey | 100.0% | 9.7% (+90.3)#3 | 11.1% (+88.9)#112 |
| 4. | Bell | 100.0% | 9.7% (+90.3)#4 | 11.1% (+88.9)#113 |
| 5. | Proctor | 100.0% | 9.7% (+90.3)#5 | 11.1% (+88.9)#182 |
| 6. | Whitesboro | 100.0% | 9.7% (+90.3)#6 | 11.1% (+88.9)#214 |
| 7. | Enterprise | 100.0% | 9.7% (+90.3)#7 | 11.1% (+88.9)#217 |
| 8. | Mcbride | 100.0% | 9.7% (+90.3)#8 | 11.1% (+88.9)#264 |
| 9. | Moffett | 100.0% | 9.7% (+90.3)#9 | 11.1% (+88.9)#312 |
| 10. | Swink | 100.0% | 9.7% (+90.3)#10 | 11.1% (+88.9)#331 |
| 11. | Terlton | 100.0% | 9.7% (+90.3)#11 | 11.1% (+88.9)#332 |
| 12. | Bunch | 100.0% | 9.7% (+90.3)#12 | 11.1% (+88.9)#353 |
| 13. | Rosedale | 100.0% | 9.7% (+90.3)#13 | 11.1% (+88.9)#365 |
| 14. | Jefferson | 100.0% | 9.7% (+90.3)#14 | 11.1% (+88.9)#389 |
| 15. | Bradley | 95.5% | 9.7% (+85.7)#15 | 11.1% (+84.4)#401 |
| 16. | Titanic | 92.3% | 9.7% (+82.6)#16 | 11.1% (+81.2)#414 |
| 17. | Lake Ellsworth Addition | 89.3% | 9.7% (+79.6)#17 | 11.1% (+78.2)#427 |
| 18. | Summit | 83.3% | 9.7% (+73.6)#18 | 11.1% (+72.3)#466 |
| 19. | Grand Lake Towne | 80.6% | 9.7% (+70.8)#19 | 11.1% (+69.5)#485 |
| 20. | Mccurtain | 80.0% | 9.7% (+70.3)#20 | 11.1% (+68.9)#488 |
| 21. | Lima | 75.0% | 9.7% (+65.3)#21 | 11.1% (+63.9)#568 |
| 22. | Peggs | 68.2% | 9.7% (+58.5)#22 | 11.1% (+57.1)#646 |
| 23. | Boynton | 66.7% | 9.7% (+57.0)#23 | 11.1% (+55.6)#689 |
| 24. | Manchester | 66.7% | 9.7% (+57.0)#24 | 11.1% (+55.6)#691 |
| 25. | Gerty | 66.7% | 9.7% (+57.0)#25 | 11.1% (+55.6)#704 |
| 26. | Smith Village | 66.7% | 9.7% (+57.0)#26 | 11.1% (+55.6)#707 |
| 27. | Nicut | 64.3% | 9.7% (+54.6)#27 | 11.1% (+53.2)#729 |
| 28. | Tatums | 62.5% | 9.7% (+52.8)#28 | 11.1% (+51.4)#773 |
| 29. | Medford | 62.3% | 9.7% (+52.6)#29 | 11.1% (+51.2)#783 |
| 30. | Zeb | 60.0% | 9.7% (+50.3)#30 | 11.1% (+48.9)#838 |
| 31. | Le Flore | 60.0% | 9.7% (+50.3)#31 | 11.1% (+48.9)#856 |
| 32. | Sour John | 60.0% | 9.7% (+50.3)#32 | 11.1% (+48.9)#862 |
| 33. | Bromide | 57.7% | 9.7% (+48.0)#33 | 11.1% (+46.6)#929 |
| 34. | Winchester | 57.5% | 9.7% (+47.8)#34 | 11.1% (+46.4)#930 |
| 35. | Keys | 57.4% | 9.7% (+47.7)#35 | 11.1% (+46.3)#935 |
| 36. | Olive | 55.6% | 9.7% (+45.8)#36 | 11.1% (+44.5)#1,010 |
| 37. | Talihina | 55.3% | 9.7% (+45.6)#37 | 11.1% (+44.2)#1,019 |
| 38. | Roosevelt | 54.5% | 9.7% (+44.8)#38 | 11.1% (+43.5)#1,042 |
| 39. | Big Cabin | 53.3% | 9.7% (+43.6)#39 | 11.1% (+42.3)#1,087 |
| 40. | Fitzhugh | 53.0% | 9.7% (+43.3)#40 | 11.1% (+42.0)#1,098 |
| 41. | Tushka | 51.9% | 9.7% (+42.2)#41 | 11.1% (+40.9)#1,124 |
| 42. | Ringling | 51.6% | 9.7% (+41.9)#42 | 11.1% (+40.5)#1,132 |
| 43. | Pond Creek | 51.4% | 9.7% (+41.6)#43 | 11.1% (+40.3)#1,146 |
| 44. | Depew | 51.1% | 9.7% (+41.4)#44 | 11.1% (+40.0)#1,154 |
| 45. | Briggs | 51.0% | 9.7% (+41.3)#45 | 11.1% (+40.0)#1,157 |
| 46. | Shady Grove Cdp Mcintosh County | 50.0% | 9.7% (+40.3)#46 | 11.1% (+38.9)#1,210 |
| 47. | Canadian Shores | 50.0% | 9.7% (+40.3)#47 | 11.1% (+38.9)#1,222 |
| 48. | Cedar Crest | 50.0% | 9.7% (+40.3)#48 | 11.1% (+38.9)#1,227 |
| 49. | Lebanon | 50.0% | 9.7% (+40.3)#49 | 11.1% (+38.9)#1,240 |
| 50. | Lamar | 50.0% | 9.7% (+40.3)#50 | 11.1% (+38.9)#1,242 |
| 51. | Blackburn | 50.0% | 9.7% (+40.3)#51 | 11.1% (+38.9)#1,286 |
| 52. | Allen | 49.4% | 9.7% (+39.7)#52 | 11.1% (+38.3)#1,322 |
| 53. | Rock Island | 49.3% | 9.7% (+39.6)#53 | 11.1% (+38.2)#1,323 |
| 54. | Boswell | 48.3% | 9.7% (+38.6)#54 | 11.1% (+37.3)#1,357 |
| 55. | Pettit | 48.0% | 9.7% (+38.3)#55 | 11.1% (+36.9)#1,376 |
| 56. | Cottonwood | 47.4% | 9.7% (+37.7)#56 | 11.1% (+36.3)#1,419 |
| 57. | Fair Oaks | 46.7% | 9.7% (+37.0)#57 | 11.1% (+35.6)#1,464 |
| 58. | Lequire | 45.5% | 9.7% (+35.7)#58 | 11.1% (+34.4)#1,535 |
| 59. | Panola | 45.5% | 9.7% (+35.7)#59 | 11.1% (+34.4)#1,537 |
| 60. | Foyil | 43.8% | 9.7% (+34.0)#60 | 11.1% (+32.7)#1,622 |
| 61. | Dill City | 42.9% | 9.7% (+33.1)#61 | 11.1% (+31.8)#1,698 |
| 62. | Taft | 42.9% | 9.7% (+33.1)#62 | 11.1% (+31.8)#1,711 |
| 63. | Centrahoma | 42.9% | 9.7% (+33.1)#63 | 11.1% (+31.8)#1,714 |
| 64. | Keyes | 41.7% | 9.7% (+32.0)#64 | 11.1% (+30.6)#1,797 |
| 65. | West Peavine | 41.2% | 9.7% (+31.5)#65 | 11.1% (+30.1)#1,834 |
| 66. | Delaware | 40.7% | 9.7% (+31.0)#66 | 11.1% (+29.7)#1,854 |
| 67. | Glencoe | 40.6% | 9.7% (+30.9)#67 | 11.1% (+29.5)#1,865 |
| 68. | Sunray | 40.3% | 9.7% (+30.5)#68 | 11.1% (+29.2)#1,885 |
| 69. | Chandler | 40.1% | 9.7% (+30.4)#69 | 11.1% (+29.1)#1,890 |
| 70. | Calvin | 40.0% | 9.7% (+30.3)#70 | 11.1% (+28.9)#1,913 |
| 71. | Coleman | 40.0% | 9.7% (+30.3)#71 | 11.1% (+28.9)#1,921 |
| 72. | Milburn | 40.0% | 9.7% (+30.3)#72 | 11.1% (+28.9)#1,926 |
| 73. | Bessie | 40.0% | 9.7% (+30.3)#73 | 11.1% (+28.9)#1,928 |
| 74. | Sparks | 40.0% | 9.7% (+30.3)#74 | 11.1% (+28.9)#1,943 |
| 75. | Rentiesville | 40.0% | 9.7% (+30.3)#75 | 11.1% (+28.9)#1,948 |
| 76. | Hanna | 40.0% | 9.7% (+30.3)#76 | 11.1% (+28.9)#1,953 |
| 77. | Oakwood | 40.0% | 9.7% (+30.3)#77 | 11.1% (+28.9)#1,960 |
| 78. | Dixon | 38.9% | 9.7% (+29.2)#78 | 11.1% (+27.8)#2,041 |
| 79. | Blackwell | 38.3% | 9.7% (+28.6)#79 | 11.1% (+27.3)#2,096 |
| 80. | Heavener | 37.8% | 9.7% (+28.1)#80 | 11.1% (+26.7)#2,142 |
| 81. | Rocky Mountain | 37.5% | 9.7% (+27.8)#81 | 11.1% (+26.4)#2,165 |
| 82. | Atwood | 37.5% | 9.7% (+27.8)#82 | 11.1% (+26.4)#2,186 |
| 83. | Chester | 37.5% | 9.7% (+27.8)#83 | 11.1% (+26.4)#2,191 |
| 84. | Oaks | 36.4% | 9.7% (+26.7)#84 | 11.1% (+25.3)#2,282 |
| 85. | Addington | 36.4% | 9.7% (+26.7)#85 | 11.1% (+25.3)#2,293 |
| 86. | Hendrix | 36.4% | 9.7% (+26.7)#86 | 11.1% (+25.3)#2,296 |
| 87. | Fairfield | 35.7% | 9.7% (+26.0)#87 | 11.1% (+24.6)#2,332 |
| 88. | Taloga | 35.7% | 9.7% (+26.0)#88 | 11.1% (+24.6)#2,340 |
| 89. | Valliant | 35.6% | 9.7% (+25.9)#89 | 11.1% (+24.5)#2,355 |
| 90. | Bennington | 35.3% | 9.7% (+25.6)#90 | 11.1% (+24.2)#2,386 |
| 91. | Fanshawe | 35.1% | 9.7% (+25.4)#91 | 11.1% (+24.1)#2,403 |
| 92. | Lyons Switch | 35.0% | 9.7% (+25.3)#92 | 11.1% (+23.9)#2,412 |
| 93. | Terral | 34.5% | 9.7% (+24.8)#93 | 11.1% (+23.4)#2,467 |
| 94. | Waurika | 34.4% | 9.7% (+24.7)#94 | 11.1% (+23.3)#2,470 |
| 95. | Union City | 34.0% | 9.7% (+24.3)#95 | 11.1% (+23.0)#2,506 |
| 96. | Kellyville | 33.3% | 9.7% (+23.6)#96 | 11.1% (+22.3)#2,577 |
| 97. | Davenport | 33.3% | 9.7% (+23.6)#97 | 11.1% (+22.3)#2,592 |
| 98. | Paoli | 33.3% | 9.7% (+23.6)#98 | 11.1% (+22.3)#2,595 |
| 99. | Covington | 33.3% | 9.7% (+23.6)#99 | 11.1% (+22.3)#2,620 |
| 100. | Rose | 33.3% | 9.7% (+23.6)#100 | 11.1% (+22.3)#2,648 |
Common Questions
What are the Top 10 Cities with the Highest Poverty Level Among Seniors Over the Age of 75 in Oklahoma?
Top 10 Cities with the Highest Poverty Level Among Seniors Over the Age of 75 in Oklahoma are:
What city has the Highest Poverty Level Among Seniors Over the Age of 75 in Oklahoma?
Caney has the Highest Poverty Level Among Seniors Over the Age of 75 in Oklahoma with 100.0%.
What is the Poverty Level Among Seniors Over the Age of 75 in the State of Oklahoma?
Poverty Level Among Seniors Over the Age of 75 in Oklahoma is 9.7%.
What is the Poverty Level Among Seniors Over the Age of 75 in the United States?
Poverty Level Among Seniors Over the Age of 75 in the United States is 11.1%.