Cities with the Highest Poverty Level Among Seniors Over the Age of 75 in Montana
RELATED REPORTS & OPTIONS
Highest Poverty | Seniors 75+
Montana
Compare Cities
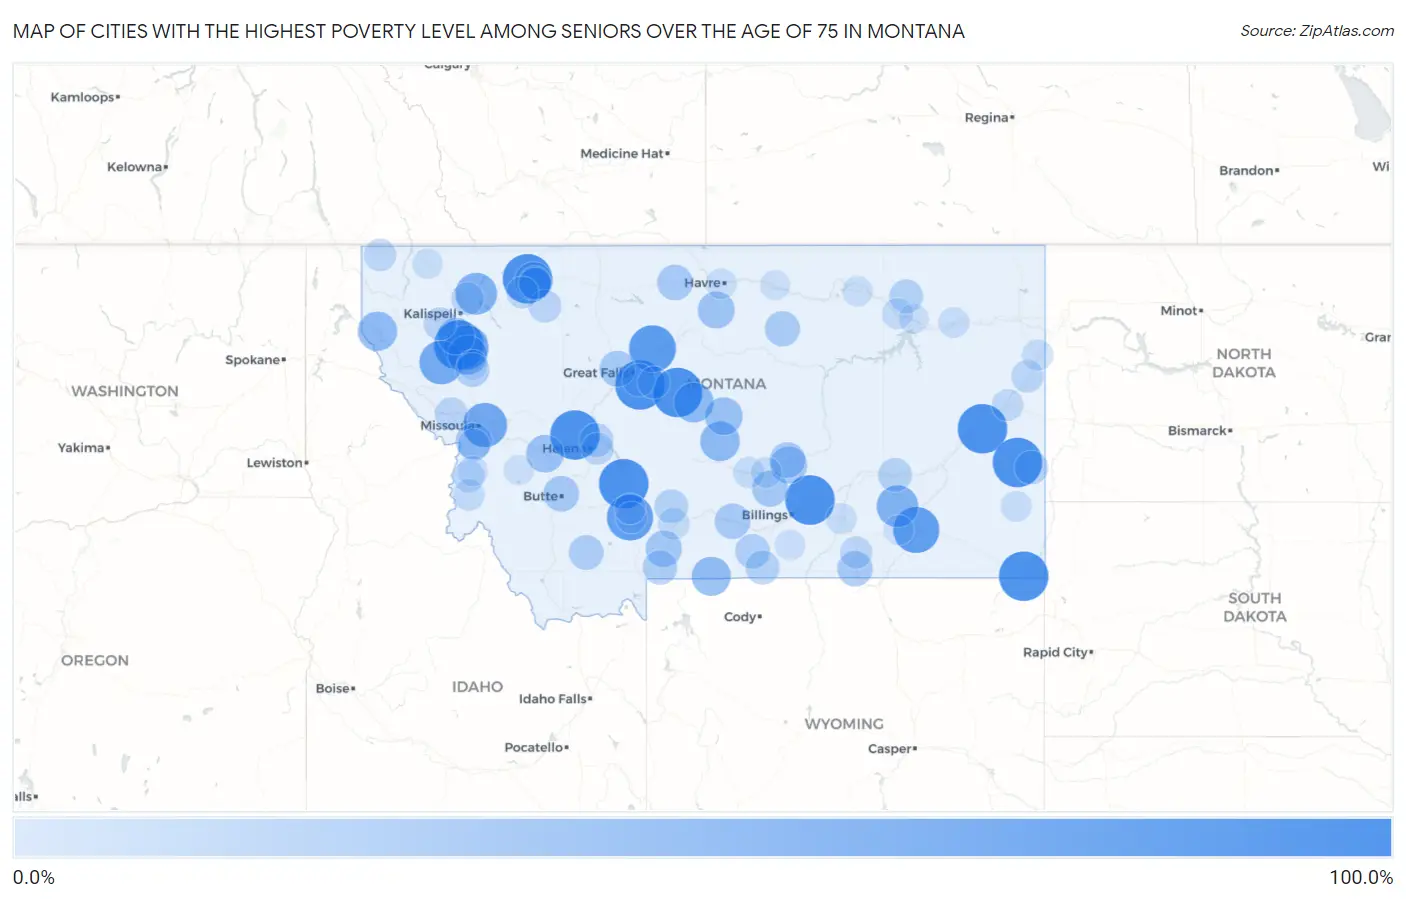
Map of Cities with the Highest Poverty Level Among Seniors Over the Age of 75 in Montana
0.0%
100.0%
Cities with the Highest Poverty Level Among Seniors Over the Age of 75 in Montana
| City | Senior Poverty | vs State | vs National | |
| 1. | Worden | 100.0% | 10.6%(+89.4)#1 | 11.1%(+88.9)#81 |
| 2. | Fallon | 100.0% | 10.6%(+89.4)#2 | 11.1%(+88.9)#108 |
| 3. | Plevna | 100.0% | 10.6%(+89.4)#3 | 11.1%(+88.9)#153 |
| 4. | Starr School | 100.0% | 10.6%(+89.4)#4 | 11.1%(+88.9)#160 |
| 5. | Toston | 100.0% | 10.6%(+89.4)#5 | 11.1%(+88.9)#184 |
| 6. | Elmo | 100.0% | 10.6%(+89.4)#6 | 11.1%(+88.9)#201 |
| 7. | Stockett | 100.0% | 10.6%(+89.4)#7 | 11.1%(+88.9)#213 |
| 8. | Rapelje | 100.0% | 10.6%(+89.4)#8 | 11.1%(+88.9)#260 |
| 9. | Geyser | 100.0% | 10.6%(+89.4)#9 | 11.1%(+88.9)#281 |
| 10. | Turner Colony | 100.0% | 10.6%(+89.4)#10 | 11.1%(+88.9)#297 |
| 11. | Marysville | 100.0% | 10.6%(+89.4)#11 | 11.1%(+88.9)#302 |
| 12. | Canyon Creek | 100.0% | 10.6%(+89.4)#12 | 11.1%(+88.9)#304 |
| 13. | Jeffers | 100.0% | 10.6%(+89.4)#13 | 11.1%(+88.9)#335 |
| 14. | Pinnacle | 100.0% | 10.6%(+89.4)#14 | 11.1%(+88.9)#345 |
| 15. | Hogeland | 100.0% | 10.6%(+89.4)#15 | 11.1%(+88.9)#375 |
| 16. | Alzada | 100.0% | 10.6%(+89.4)#16 | 11.1%(+88.9)#383 |
| 17. | Carter | 88.9% | 10.6%(+78.3)#17 | 11.1%(+77.8)#428 |
| 18. | Ashland | 85.9% | 10.6%(+75.3)#18 | 11.1%(+74.8)#441 |
| 19. | Amsterdam | 85.7% | 10.6%(+75.1)#19 | 11.1%(+74.6)#446 |
| 20. | Lindisfarne | 78.4% | 10.6%(+67.9)#20 | 11.1%(+67.4)#513 |
| 21. | Bonner West Riverside | 77.3% | 10.6%(+66.7)#21 | 11.1%(+66.2)#525 |
| 22. | Camas | 75.0% | 10.6%(+64.4)#22 | 11.1%(+63.9)#571 |
| 23. | Colstrip | 66.7% | 10.6%(+56.1)#23 | 11.1%(+55.6)#665 |
| 24. | Coram | 66.7% | 10.6%(+56.1)#24 | 11.1%(+55.6)#673 |
| 25. | Glacier Colony | 64.2% | 10.6%(+53.6)#25 | 11.1%(+53.1)#733 |
| 26. | Stanford | 59.1% | 10.6%(+48.5)#26 | 11.1%(+48.0)#884 |
| 27. | Judith Gap | 58.1% | 10.6%(+47.6)#27 | 11.1%(+47.1)#913 |
| 28. | Jette | 56.7% | 10.6%(+46.1)#28 | 11.1%(+45.6)#961 |
| 29. | Noxon | 56.2% | 10.6%(+45.7)#29 | 11.1%(+45.2)#978 |
| 30. | Cooke City | 55.6% | 10.6%(+45.0)#30 | 11.1%(+44.5)#1,008 |
| 31. | North Browning | 52.6% | 10.6%(+42.0)#31 | 11.1%(+41.5)#1,108 |
| 32. | Moore | 50.0% | 10.6%(+39.4)#32 | 11.1%(+38.9)#1,226 |
| 33. | Garrison | 50.0% | 10.6%(+39.4)#33 | 11.1%(+38.9)#1,267 |
| 34. | North Harlem Colony | 50.0% | 10.6%(+39.4)#34 | 11.1%(+38.9)#1,302 |
| 35. | St Pierre | 46.7% | 10.6%(+36.1)#35 | 11.1%(+35.6)#1,454 |
| 36. | Lake Mary Ronan | 46.7% | 10.6%(+36.1)#36 | 11.1%(+35.6)#1,465 |
| 37. | Klein | 46.6% | 10.6%(+36.0)#37 | 11.1%(+35.5)#1,469 |
| 38. | Emigrant | 43.8% | 10.6%(+33.2)#38 | 11.1%(+32.7)#1,626 |
| 39. | Carlton | 43.3% | 10.6%(+32.8)#39 | 11.1%(+32.3)#1,656 |
| 40. | Broadview | 42.9% | 10.6%(+32.3)#40 | 11.1%(+31.8)#1,701 |
| 41. | Vaughn | 42.1% | 10.6%(+31.5)#41 | 11.1%(+31.0)#1,747 |
| 42. | Walkerville | 41.5% | 10.6%(+30.9)#42 | 11.1%(+30.4)#1,810 |
| 43. | Rudyard | 41.2% | 10.6%(+30.6)#43 | 11.1%(+30.1)#1,829 |
| 44. | Reed Point | 41.2% | 10.6%(+30.6)#44 | 11.1%(+30.1)#1,832 |
| 45. | Camp Three | 41.2% | 10.6%(+30.6)#45 | 11.1%(+30.1)#1,833 |
| 46. | Wyola | 40.0% | 10.6%(+29.4)#46 | 11.1%(+28.9)#1,927 |
| 47. | New Miami Colony | 40.0% | 10.6%(+29.4)#47 | 11.1%(+28.9)#1,933 |
| 48. | Hays | 39.1% | 10.6%(+28.6)#48 | 11.1%(+28.1)#2,010 |
| 49. | Alder | 37.5% | 10.6%(+26.9)#49 | 11.1%(+26.4)#2,184 |
| 50. | Roberts | 36.4% | 10.6%(+25.8)#50 | 11.1%(+25.3)#2,281 |
| 51. | Corwin Springs | 36.4% | 10.6%(+25.8)#51 | 11.1%(+25.3)#2,288 |
| 52. | Ronan | 34.7% | 10.6%(+24.2)#52 | 11.1%(+23.7)#2,444 |
| 53. | Belfry | 34.4% | 10.6%(+23.8)#53 | 11.1%(+23.3)#2,478 |
| 54. | Helena Valley Northeast | 34.1% | 10.6%(+23.5)#54 | 11.1%(+23.0)#2,504 |
| 55. | St Marie | 33.7% | 10.6%(+23.1)#55 | 11.1%(+22.6)#2,540 |
| 56. | Forsyth | 33.6% | 10.6%(+23.0)#56 | 11.1%(+22.5)#2,548 |
| 57. | Clyde Park | 33.3% | 10.6%(+22.8)#57 | 11.1%(+22.3)#2,627 |
| 58. | Tracy | 33.3% | 10.6%(+22.8)#58 | 11.1%(+22.3)#2,715 |
| 59. | Floweree | 33.3% | 10.6%(+22.8)#59 | 11.1%(+22.3)#2,729 |
| 60. | Baker | 32.9% | 10.6%(+22.4)#60 | 11.1%(+21.9)#2,755 |
| 61. | Alberton | 30.3% | 10.6%(+19.7)#61 | 11.1%(+19.2)#3,068 |
| 62. | Heart Butte | 30.0% | 10.6%(+19.4)#62 | 11.1%(+18.9)#3,114 |
| 63. | Sand Coulee | 30.0% | 10.6%(+19.4)#63 | 11.1%(+18.9)#3,134 |
| 64. | Marion | 29.4% | 10.6%(+18.8)#64 | 11.1%(+18.3)#3,220 |
| 65. | Browning | 29.0% | 10.6%(+18.5)#65 | 11.1%(+18.0)#3,285 |
| 66. | Columbia Falls | 29.0% | 10.6%(+18.4)#66 | 11.1%(+17.9)#3,287 |
| 67. | Yaak | 27.8% | 10.6%(+17.2)#67 | 11.1%(+16.7)#3,505 |
| 68. | Savage | 27.8% | 10.6%(+17.2)#68 | 11.1%(+16.7)#3,507 |
| 69. | Belt | 27.6% | 10.6%(+17.0)#69 | 11.1%(+16.5)#3,535 |
| 70. | Lodge Grass | 27.3% | 10.6%(+16.7)#70 | 11.1%(+16.2)#3,590 |
| 71. | Florence | 27.1% | 10.6%(+16.6)#71 | 11.1%(+16.1)#3,630 |
| 72. | East Helena | 27.1% | 10.6%(+16.5)#72 | 11.1%(+16.0)#3,643 |
| 73. | South Browning | 27.0% | 10.6%(+16.4)#73 | 11.1%(+15.9)#3,666 |
| 74. | East Glacier Park Village | 26.7% | 10.6%(+16.1)#74 | 11.1%(+15.6)#3,730 |
| 75. | Silver Star | 26.7% | 10.6%(+16.1)#75 | 11.1%(+15.6)#3,736 |
| 76. | Hamilton | 25.3% | 10.6%(+14.8)#76 | 11.1%(+14.3)#4,011 |
| 77. | Glendive | 25.3% | 10.6%(+14.7)#77 | 11.1%(+14.2)#4,023 |
| 78. | Darby | 25.0% | 10.6%(+14.4)#78 | 11.1%(+13.9)#4,093 |
| 79. | Acton | 25.0% | 10.6%(+14.4)#79 | 11.1%(+13.9)#4,183 |
| 80. | Livingston | 24.6% | 10.6%(+14.0)#80 | 11.1%(+13.5)#4,252 |
| 81. | Churchill | 23.6% | 10.6%(+13.1)#81 | 11.1%(+12.6)#4,483 |
| 82. | Ryegate | 23.3% | 10.6%(+12.8)#82 | 11.1%(+12.3)#4,563 |
| 83. | Glasgow | 22.8% | 10.6%(+12.3)#83 | 11.1%(+11.8)#4,701 |
| 84. | Sidney | 22.8% | 10.6%(+12.2)#84 | 11.1%(+11.7)#4,717 |
| 85. | Ekalaka | 22.2% | 10.6%(+11.7)#85 | 11.1%(+11.2)#4,883 |
| 86. | Lavina | 22.2% | 10.6%(+11.7)#86 | 11.1%(+11.2)#4,919 |
| 87. | Hardin | 22.1% | 10.6%(+11.6)#87 | 11.1%(+11.1)#4,935 |
| 88. | Manhattan | 21.8% | 10.6%(+11.2)#88 | 11.1%(+10.7)#5,032 |
| 89. | West Havre | 21.7% | 10.6%(+11.2)#89 | 11.1%(+10.7)#5,056 |
| 90. | Wolf Point | 21.7% | 10.6%(+11.1)#90 | 11.1%(+10.6)#5,060 |
| 91. | Corvallis | 20.0% | 10.6%(+9.43)#91 | 11.1%(+8.93)#5,570 |
| 92. | Pryor | 20.0% | 10.6%(+9.43)#92 | 11.1%(+8.93)#5,594 |
| 93. | Fortine | 20.0% | 10.6%(+9.43)#93 | 11.1%(+8.93)#5,623 |
| 94. | Saco | 20.0% | 10.6%(+9.43)#94 | 11.1%(+8.93)#5,676 |
| 95. | Landusky | 20.0% | 10.6%(+9.43)#95 | 11.1%(+8.93)#5,713 |
| 96. | Pablo | 19.5% | 10.6%(+8.96)#96 | 11.1%(+8.46)#5,842 |
| 97. | Harlem | 19.4% | 10.6%(+8.78)#97 | 11.1%(+8.29)#5,908 |
| 98. | Lame Deer | 19.0% | 10.6%(+8.48)#98 | 11.1%(+7.98)#6,030 |
| 99. | Nashua | 19.0% | 10.6%(+8.48)#99 | 11.1%(+7.98)#6,045 |
| 100. | Philipsburg | 18.9% | 10.6%(+8.38)#100 | 11.1%(+7.88)#6,087 |
Common Questions
What are the Top 10 Cities with the Highest Poverty Level Among Seniors Over the Age of 75 in Montana?
Top 10 Cities with the Highest Poverty Level Among Seniors Over the Age of 75 in Montana are:
#1
100.0%
#2
100.0%
#3
100.0%
#4
100.0%
#5
100.0%
#6
100.0%
#7
100.0%
#8
100.0%
#9
100.0%
#10
100.0%
What city has the Highest Poverty Level Among Seniors Over the Age of 75 in Montana?
Worden has the Highest Poverty Level Among Seniors Over the Age of 75 in Montana with 100.0%.
What is the Poverty Level Among Seniors Over the Age of 75 in the State of Montana?
Poverty Level Among Seniors Over the Age of 75 in Montana is 10.6%.
What is the Poverty Level Among Seniors Over the Age of 75 in the United States?
Poverty Level Among Seniors Over the Age of 75 in the United States is 11.1%.