Cities with the Highest Poverty Level Among Seniors Over the Age of 75 in Tennessee
RELATED REPORTS & OPTIONS
Highest Poverty | Seniors 75+
Tennessee
Compare Cities
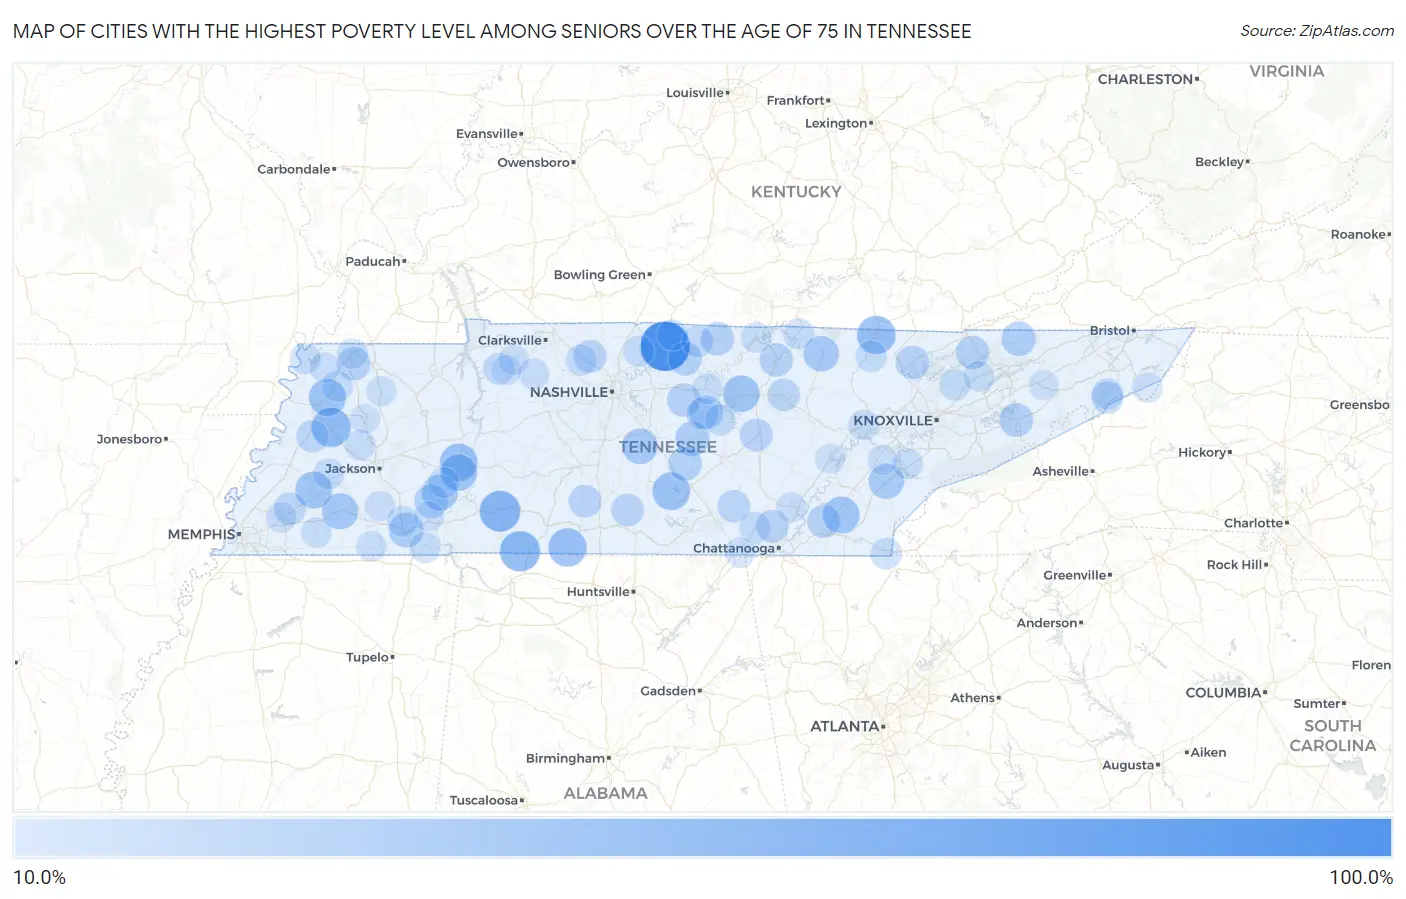
Map of Cities with the Highest Poverty Level Among Seniors Over the Age of 75 in Tennessee
0.0%
100.0%
Cities with the Highest Poverty Level Among Seniors Over the Age of 75 in Tennessee
| City | Senior Poverty | vs State | vs National | |
| 1. | Briceville | 100.0% | 11.1%(+88.9)#1 | 11.1%(+88.9)#121 |
| 2. | Hilham | 100.0% | 11.1%(+88.9)#2 | 11.1%(+88.9)#129 |
| 3. | Bethpage | 100.0% | 11.1%(+88.9)#3 | 11.1%(+88.9)#139 |
| 4. | Morris Chapel | 100.0% | 11.1%(+88.9)#4 | 11.1%(+88.9)#171 |
| 5. | Greenvale | 100.0% | 11.1%(+88.9)#5 | 11.1%(+88.9)#229 |
| 6. | Bogota | 100.0% | 11.1%(+88.9)#6 | 11.1%(+88.9)#284 |
| 7. | Tuckers Crossroads | 100.0% | 11.1%(+88.9)#7 | 11.1%(+88.9)#294 |
| 8. | Coker Creek | 100.0% | 11.1%(+88.9)#8 | 11.1%(+88.9)#334 |
| 9. | Waynesboro | 62.7% | 11.1%(+51.6)#9 | 11.1%(+51.7)#765 |
| 10. | Iron City | 60.9% | 11.1%(+49.7)#10 | 11.1%(+49.8)#824 |
| 11. | Friendship | 56.7% | 11.1%(+45.5)#11 | 11.1%(+45.6)#963 |
| 12. | Hickman | 55.6% | 11.1%(+44.4)#12 | 11.1%(+44.5)#999 |
| 13. | Wildersville | 54.2% | 11.1%(+43.0)#13 | 11.1%(+43.1)#1,057 |
| 14. | Winfield | 53.3% | 11.1%(+42.2)#14 | 11.1%(+42.3)#1,083 |
| 15. | Minor Hill | 52.6% | 11.1%(+41.5)#15 | 11.1%(+41.6)#1,107 |
| 16. | Parsons | 50.6% | 11.1%(+39.4)#16 | 11.1%(+39.5)#1,168 |
| 17. | Normandy | 50.0% | 11.1%(+38.9)#17 | 11.1%(+38.9)#1,271 |
| 18. | Newbern | 48.0% | 11.1%(+36.9)#18 | 11.1%(+37.0)#1,371 |
| 19. | Charleston | 46.5% | 11.1%(+35.4)#19 | 11.1%(+35.4)#1,471 |
| 20. | Stanton | 46.4% | 11.1%(+35.3)#20 | 11.1%(+35.4)#1,473 |
| 21. | Baxter | 46.0% | 11.1%(+34.8)#21 | 11.1%(+34.9)#1,497 |
| 22. | Decaturville | 45.0% | 11.1%(+33.9)#22 | 11.1%(+33.9)#1,554 |
| 23. | Whiteville | 44.4% | 11.1%(+33.3)#23 | 11.1%(+33.4)#1,581 |
| 24. | Sardis | 42.9% | 11.1%(+31.7)#24 | 11.1%(+31.8)#1,691 |
| 25. | Rockvale | 41.8% | 11.1%(+30.7)#25 | 11.1%(+30.8)#1,776 |
| 26. | Jamestown | 41.4% | 11.1%(+30.2)#26 | 11.1%(+30.3)#1,815 |
| 27. | Madisonville | 40.3% | 11.1%(+29.2)#27 | 11.1%(+29.3)#1,880 |
| 28. | Yuma | 40.0% | 11.1%(+28.9)#28 | 11.1%(+28.9)#1,945 |
| 29. | Selmer | 38.3% | 11.1%(+27.2)#29 | 11.1%(+27.3)#2,095 |
| 30. | Finley | 37.7% | 11.1%(+26.6)#30 | 11.1%(+26.7)#2,148 |
| 31. | Woodbury | 37.3% | 11.1%(+26.1)#31 | 11.1%(+26.2)#2,206 |
| 32. | Sneedville | 37.1% | 11.1%(+26.0)#32 | 11.1%(+26.1)#2,214 |
| 33. | Milledgeville | 35.0% | 11.1%(+23.9)#33 | 11.1%(+23.9)#2,418 |
| 34. | Lakewood Park | 34.8% | 11.1%(+23.7)#34 | 11.1%(+23.8)#2,431 |
| 35. | Dowelltown | 34.6% | 11.1%(+23.5)#35 | 11.1%(+23.5)#2,455 |
| 36. | Newport | 34.5% | 11.1%(+23.3)#36 | 11.1%(+23.4)#2,464 |
| 37. | Hartsville Trousdale County | 34.4% | 11.1%(+23.3)#37 | 11.1%(+23.3)#2,474 |
| 38. | Watertown | 33.6% | 11.1%(+22.5)#38 | 11.1%(+22.6)#2,543 |
| 39. | La Follette | 33.3% | 11.1%(+22.2)#39 | 11.1%(+22.3)#2,559 |
| 40. | Red Boiling Springs | 33.3% | 11.1%(+22.2)#40 | 11.1%(+22.3)#2,571 |
| 41. | Rives | 33.3% | 11.1%(+22.2)#41 | 11.1%(+22.3)#2,659 |
| 42. | Livingston | 33.0% | 11.1%(+21.9)#42 | 11.1%(+22.0)#2,745 |
| 43. | New Tazewell | 32.9% | 11.1%(+21.8)#43 | 11.1%(+21.9)#2,756 |
| 44. | Hopewell | 32.4% | 11.1%(+21.2)#44 | 11.1%(+21.3)#2,795 |
| 45. | Lynnville | 31.0% | 11.1%(+19.9)#45 | 11.1%(+20.0)#2,959 |
| 46. | Coopertown | 30.9% | 11.1%(+19.8)#46 | 11.1%(+19.9)#2,971 |
| 47. | Doyle | 30.6% | 11.1%(+19.5)#47 | 11.1%(+19.5)#3,022 |
| 48. | Lone Oak | 30.1% | 11.1%(+18.9)#48 | 11.1%(+19.0)#3,092 |
| 49. | Petersburg | 30.0% | 11.1%(+18.9)#49 | 11.1%(+18.9)#3,113 |
| 50. | Coalmont | 29.8% | 11.1%(+18.7)#50 | 11.1%(+18.8)#3,163 |
| 51. | Monterey | 29.6% | 11.1%(+18.5)#51 | 11.1%(+18.6)#3,190 |
| 52. | Gates | 29.1% | 11.1%(+17.9)#52 | 11.1%(+18.0)#3,280 |
| 53. | Gallaway | 28.6% | 11.1%(+17.4)#53 | 11.1%(+17.5)#3,341 |
| 54. | Banner Hill | 27.8% | 11.1%(+16.6)#54 | 11.1%(+16.7)#3,495 |
| 55. | Liberty | 27.6% | 11.1%(+16.4)#55 | 11.1%(+16.5)#3,537 |
| 56. | Valley Forge | 27.2% | 11.1%(+16.1)#56 | 11.1%(+16.2)#3,620 |
| 57. | Lafayette | 26.9% | 11.1%(+15.8)#57 | 11.1%(+15.8)#3,684 |
| 58. | Tennessee Ridge | 26.1% | 11.1%(+14.9)#58 | 11.1%(+15.0)#3,849 |
| 59. | Huntsville | 25.5% | 11.1%(+14.3)#59 | 11.1%(+14.4)#3,994 |
| 60. | Whitwell | 25.0% | 11.1%(+13.9)#60 | 11.1%(+13.9)#4,065 |
| 61. | Copperhill | 25.0% | 11.1%(+13.9)#61 | 11.1%(+13.9)#4,110 |
| 62. | Cottontown | 25.0% | 11.1%(+13.9)#62 | 11.1%(+13.9)#4,115 |
| 63. | Randolph | 25.0% | 11.1%(+13.9)#63 | 11.1%(+13.9)#4,145 |
| 64. | Erwin | 24.4% | 11.1%(+13.3)#64 | 11.1%(+13.3)#4,282 |
| 65. | Trimble | 24.3% | 11.1%(+13.2)#65 | 11.1%(+13.3)#4,300 |
| 66. | Pleasant View | 24.0% | 11.1%(+12.8)#66 | 11.1%(+12.9)#4,374 |
| 67. | Smithville | 23.6% | 11.1%(+12.5)#67 | 11.1%(+12.5)#4,484 |
| 68. | Byrdstown | 23.6% | 11.1%(+12.5)#68 | 11.1%(+12.5)#4,485 |
| 69. | Michie | 23.6% | 11.1%(+12.5)#69 | 11.1%(+12.5)#4,489 |
| 70. | Tiptonville | 23.5% | 11.1%(+12.4)#70 | 11.1%(+12.5)#4,499 |
| 71. | Bethel Springs | 23.5% | 11.1%(+12.4)#71 | 11.1%(+12.5)#4,504 |
| 72. | Brownsville | 23.5% | 11.1%(+12.4)#72 | 11.1%(+12.4)#4,522 |
| 73. | Luttrell | 23.5% | 11.1%(+12.3)#73 | 11.1%(+12.4)#4,525 |
| 74. | Westmoreland | 23.4% | 11.1%(+12.3)#74 | 11.1%(+12.3)#4,537 |
| 75. | Scotts Hill | 23.4% | 11.1%(+12.2)#75 | 11.1%(+12.3)#4,551 |
| 76. | Gadsden | 23.3% | 11.1%(+12.1)#76 | 11.1%(+12.2)#4,572 |
| 77. | Slayden | 23.1% | 11.1%(+11.9)#77 | 11.1%(+12.0)#4,640 |
| 78. | Harriman | 23.0% | 11.1%(+11.9)#78 | 11.1%(+11.9)#4,654 |
| 79. | Celina | 22.9% | 11.1%(+11.7)#79 | 11.1%(+11.8)#4,691 |
| 80. | Greenback | 22.6% | 11.1%(+11.5)#80 | 11.1%(+11.6)#4,748 |
| 81. | Union City | 22.6% | 11.1%(+11.5)#81 | 11.1%(+11.6)#4,754 |
| 82. | Rutledge | 22.3% | 11.1%(+11.2)#82 | 11.1%(+11.3)#4,840 |
| 83. | Gordonsville | 22.2% | 11.1%(+11.1)#83 | 11.1%(+11.2)#4,861 |
| 84. | Williston | 22.2% | 11.1%(+11.1)#84 | 11.1%(+11.2)#4,877 |
| 85. | Arlington | 21.6% | 11.1%(+10.5)#85 | 11.1%(+10.6)#5,074 |
| 86. | Hornbeak | 21.6% | 11.1%(+10.4)#86 | 11.1%(+10.5)#5,100 |
| 87. | Silerton | 21.4% | 11.1%(+10.3)#87 | 11.1%(+10.4)#5,160 |
| 88. | New Hope | 21.1% | 11.1%(+9.99)#88 | 11.1%(+10.1)#5,228 |
| 89. | Middleton | 21.1% | 11.1%(+9.91)#89 | 11.1%(+9.99)#5,250 |
| 90. | Cumberland City | 21.1% | 11.1%(+9.91)#90 | 11.1%(+9.99)#5,257 |
| 91. | Greenfield | 20.8% | 11.1%(+9.69)#91 | 11.1%(+9.77)#5,311 |
| 92. | Roan Mountain | 20.8% | 11.1%(+9.69)#92 | 11.1%(+9.77)#5,314 |
| 93. | Flat Top Mountain | 20.8% | 11.1%(+9.69)#93 | 11.1%(+9.77)#5,315 |
| 94. | Sullivan Gardens | 20.7% | 11.1%(+9.55)#94 | 11.1%(+9.62)#5,358 |
| 95. | Erin | 20.5% | 11.1%(+9.37)#95 | 11.1%(+9.45)#5,425 |
| 96. | Adamsville | 20.3% | 11.1%(+9.20)#96 | 11.1%(+9.27)#5,482 |
| 97. | Trenton | 20.3% | 11.1%(+9.14)#97 | 11.1%(+9.22)#5,499 |
| 98. | Spring City | 20.2% | 11.1%(+9.06)#98 | 11.1%(+9.14)#5,520 |
| 99. | Mosheim | 20.1% | 11.1%(+9.01)#99 | 11.1%(+9.08)#5,534 |
| 100. | Philadelphia | 20.0% | 11.1%(+8.86)#100 | 11.1%(+8.93)#5,580 |
Common Questions
What are the Top 10 Cities with the Highest Poverty Level Among Seniors Over the Age of 75 in Tennessee?
Top 10 Cities with the Highest Poverty Level Among Seniors Over the Age of 75 in Tennessee are:
#1
100.0%
#2
62.7%
#3
60.9%
#4
56.7%
#5
53.3%
#6
52.6%
#7
50.6%
#8
50.0%
#9
48.0%
#10
46.5%
What city has the Highest Poverty Level Among Seniors Over the Age of 75 in Tennessee?
Bethpage has the Highest Poverty Level Among Seniors Over the Age of 75 in Tennessee with 100.0%.
What is the Poverty Level Among Seniors Over the Age of 75 in the State of Tennessee?
Poverty Level Among Seniors Over the Age of 75 in Tennessee is 11.1%.
What is the Poverty Level Among Seniors Over the Age of 75 in the United States?
Poverty Level Among Seniors Over the Age of 75 in the United States is 11.1%.