Cities with the Highest Poverty Level Among Seniors Over the Age of 75 in Maryland
RELATED REPORTS & OPTIONS
Highest Poverty | Seniors 75+
Maryland
Compare Cities
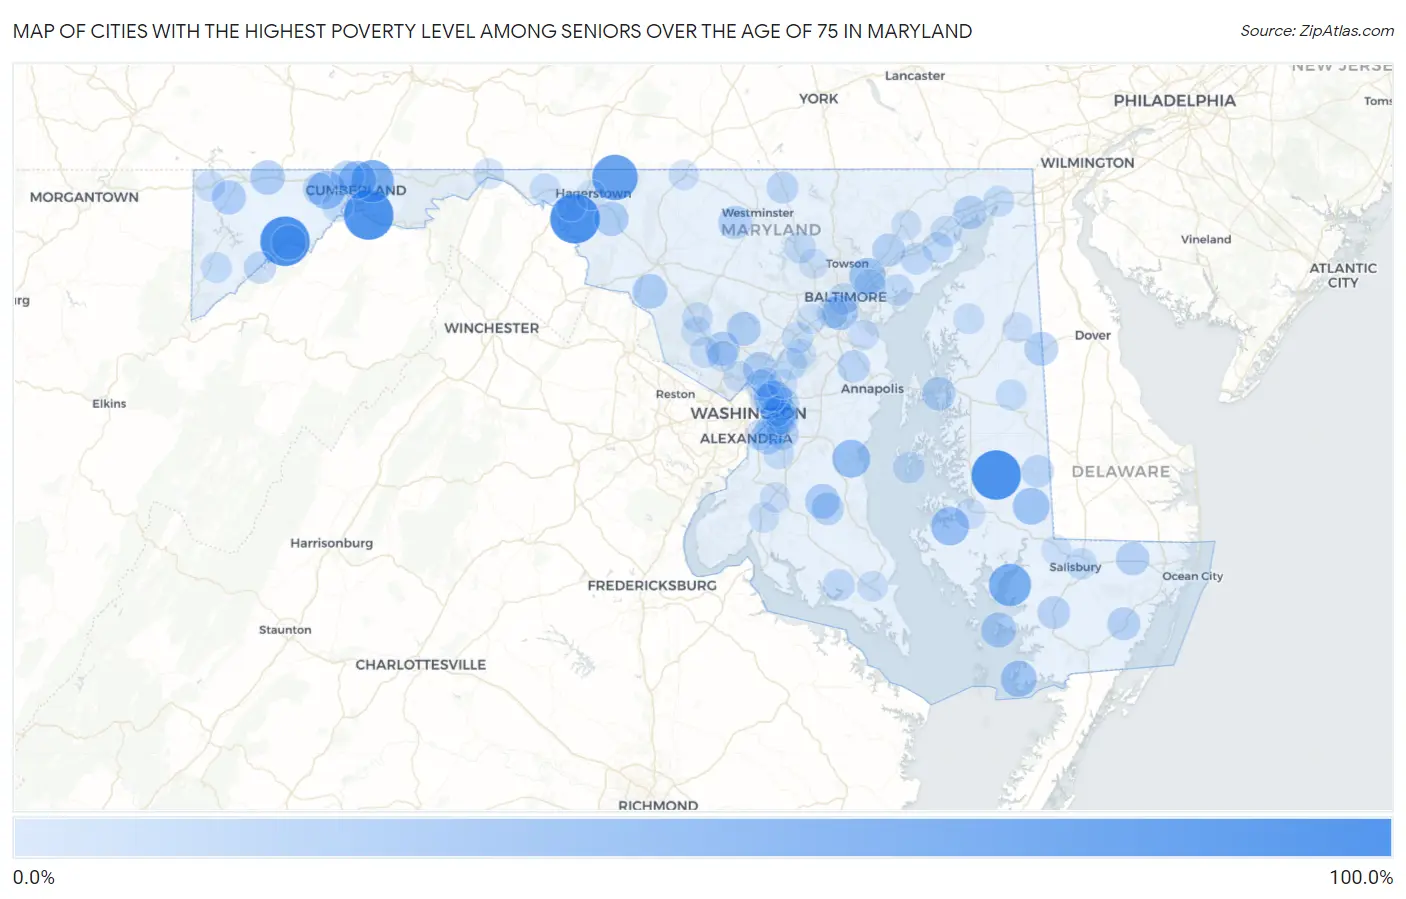
Map of Cities with the Highest Poverty Level Among Seniors Over the Age of 75 in Maryland
0.0%
100.0%
Cities with the Highest Poverty Level Among Seniors Over the Age of 75 in Maryland
| City | Senior Poverty | vs State | vs National | |
| 1. | Downsville | 100.0% | 9.8%(+90.2)#1 | 11.1%(+88.9)#37 |
| 2. | Bloomington | 100.0% | 9.8%(+90.2)#2 | 11.1%(+88.9)#219 |
| 3. | Choptank | 100.0% | 9.8%(+90.2)#3 | 11.1%(+88.9)#262 |
| 4. | Spring Gap | 100.0% | 9.8%(+90.2)#4 | 11.1%(+88.9)#340 |
| 5. | Maryland Park | 82.4% | 9.8%(+72.5)#5 | 11.1%(+71.3)#471 |
| 6. | Leitersburg | 82.3% | 9.8%(+72.5)#6 | 11.1%(+71.2)#472 |
| 7. | Pleasant Grove | 67.6% | 9.8%(+57.8)#7 | 11.1%(+56.6)#651 |
| 8. | Bivalve | 66.7% | 9.8%(+56.9)#8 | 11.1%(+55.6)#698 |
| 9. | Eckhart Mines | 48.5% | 9.8%(+38.7)#9 | 11.1%(+37.4)#1,350 |
| 10. | Church Creek | 48.1% | 9.8%(+38.3)#10 | 11.1%(+37.1)#1,366 |
| 11. | Friendship | 47.4% | 9.8%(+37.6)#11 | 11.1%(+36.3)#1,416 |
| 12. | Bowmans Addition | 45.9% | 9.8%(+36.1)#12 | 11.1%(+34.9)#1,500 |
| 13. | Bladensburg | 43.8% | 9.8%(+34.0)#13 | 11.1%(+32.7)#1,616 |
| 14. | Brookview | 42.9% | 9.8%(+33.1)#14 | 11.1%(+31.8)#1,716 |
| 15. | Overlea | 41.5% | 9.8%(+31.7)#15 | 11.1%(+30.5)#1,808 |
| 16. | Crisfield | 39.9% | 9.8%(+30.1)#16 | 11.1%(+28.8)#1,968 |
| 17. | Baltimore Highlands | 36.2% | 9.8%(+26.4)#17 | 11.1%(+25.1)#2,303 |
| 18. | Deal Island | 35.2% | 9.8%(+25.4)#18 | 11.1%(+24.1)#2,398 |
| 19. | Adamstown | 33.3% | 9.8%(+23.5)#19 | 11.1%(+22.3)#2,564 |
| 20. | Aquasco | 33.3% | 9.8%(+23.5)#20 | 11.1%(+22.3)#2,591 |
| 21. | Luke | 33.3% | 9.8%(+23.5)#21 | 11.1%(+22.3)#2,707 |
| 22. | Grantsville | 32.8% | 9.8%(+23.0)#22 | 11.1%(+21.7)#2,761 |
| 23. | San Mar | 32.5% | 9.8%(+22.7)#23 | 11.1%(+21.4)#2,785 |
| 24. | Capitol Heights | 31.6% | 9.8%(+21.8)#24 | 11.1%(+20.6)#2,885 |
| 25. | Accident | 31.4% | 9.8%(+21.6)#25 | 11.1%(+20.4)#2,912 |
| 26. | Derwood | 30.9% | 9.8%(+21.1)#26 | 11.1%(+19.8)#2,975 |
| 27. | Brookeville | 30.8% | 9.8%(+21.0)#27 | 11.1%(+19.7)#3,001 |
| 28. | White Oak | 30.6% | 9.8%(+20.8)#28 | 11.1%(+19.5)#3,027 |
| 29. | Marydel | 30.0% | 9.8%(+20.2)#29 | 11.1%(+18.9)#3,142 |
| 30. | Temple Hills | 29.1% | 9.8%(+19.3)#30 | 11.1%(+18.1)#3,276 |
| 31. | Corriganville | 29.1% | 9.8%(+19.3)#31 | 11.1%(+18.1)#3,277 |
| 32. | Grasonville | 28.5% | 9.8%(+18.7)#32 | 11.1%(+17.4)#3,395 |
| 33. | Perryville | 28.4% | 9.8%(+18.6)#33 | 11.1%(+17.3)#3,403 |
| 34. | Seat Pleasant | 28.3% | 9.8%(+18.5)#34 | 11.1%(+17.3)#3,407 |
| 35. | New Windsor | 28.1% | 9.8%(+18.3)#35 | 11.1%(+17.0)#3,445 |
| 36. | Willards | 27.5% | 9.8%(+17.7)#36 | 11.1%(+16.4)#3,548 |
| 37. | Landover | 27.1% | 9.8%(+17.3)#37 | 11.1%(+16.1)#3,635 |
| 38. | Kingsville | 26.7% | 9.8%(+16.9)#38 | 11.1%(+15.6)#3,713 |
| 39. | Snow Hill | 26.3% | 9.8%(+16.5)#39 | 11.1%(+15.2)#3,791 |
| 40. | Abingdon | 25.2% | 9.8%(+15.4)#40 | 11.1%(+14.2)#4,025 |
| 41. | Princess Anne | 25.0% | 9.8%(+15.2)#41 | 11.1%(+13.9)#4,056 |
| 42. | Eagle Harbor | 25.0% | 9.8%(+15.2)#42 | 11.1%(+13.9)#4,194 |
| 43. | Herald Harbor | 24.2% | 9.8%(+14.4)#43 | 11.1%(+13.2)#4,314 |
| 44. | Silver Hill | 23.9% | 9.8%(+14.1)#44 | 11.1%(+12.8)#4,391 |
| 45. | Morningside | 23.7% | 9.8%(+13.9)#45 | 11.1%(+12.6)#4,470 |
| 46. | Federalsburg | 23.5% | 9.8%(+13.7)#46 | 11.1%(+12.4)#4,521 |
| 47. | Kitzmiller | 22.6% | 9.8%(+12.8)#47 | 11.1%(+11.5)#4,779 |
| 48. | Frostburg | 22.5% | 9.8%(+12.7)#48 | 11.1%(+11.5)#4,790 |
| 49. | Manchester | 21.9% | 9.8%(+12.1)#49 | 11.1%(+10.9)#4,985 |
| 50. | Walker Mill | 21.1% | 9.8%(+11.3)#50 | 11.1%(+10.0)#5,229 |
| 51. | Edgewood | 21.1% | 9.8%(+11.3)#51 | 11.1%(+9.99)#5,242 |
| 52. | Leonardtown | 21.0% | 9.8%(+11.2)#52 | 11.1%(+9.90)#5,272 |
| 53. | Reisterstown | 20.6% | 9.8%(+10.8)#53 | 11.1%(+9.55)#5,384 |
| 54. | Langley Park | 20.6% | 9.8%(+10.8)#54 | 11.1%(+9.50)#5,409 |
| 55. | Baltimore | 20.6% | 9.8%(+10.8)#55 | 11.1%(+9.49)#5,413 |
| 56. | Lansdowne | 20.6% | 9.8%(+10.7)#56 | 11.1%(+9.49)#5,414 |
| 57. | South Laurel | 20.5% | 9.8%(+10.6)#57 | 11.1%(+9.39)#5,445 |
| 58. | Woodlawn Cdp Baltimore County | 20.3% | 9.8%(+10.5)#58 | 11.1%(+9.20)#5,507 |
| 59. | Tilghman Island | 20.0% | 9.8%(+10.2)#59 | 11.1%(+8.93)#5,583 |
| 60. | Bowleys Quarters | 19.9% | 9.8%(+10.1)#60 | 11.1%(+8.87)#5,724 |
| 61. | Salisbury | 19.3% | 9.8%(+9.47)#61 | 11.1%(+8.21)#5,945 |
| 62. | Rosedale | 18.7% | 9.8%(+8.89)#62 | 11.1%(+7.63)#6,190 |
| 63. | Cottage City | 18.7% | 9.8%(+8.87)#63 | 11.1%(+7.61)#6,199 |
| 64. | Cresaptown | 18.4% | 9.8%(+8.55)#64 | 11.1%(+7.29)#6,325 |
| 65. | Savage | 18.3% | 9.8%(+8.53)#65 | 11.1%(+7.27)#6,330 |
| 66. | Aberdeen | 18.2% | 9.8%(+8.41)#66 | 11.1%(+7.15)#6,378 |
| 67. | Ridgely | 18.0% | 9.8%(+8.19)#67 | 11.1%(+6.93)#6,515 |
| 68. | North East | 17.8% | 9.8%(+7.95)#68 | 11.1%(+6.69)#6,613 |
| 69. | Fairmount Heights | 17.7% | 9.8%(+7.94)#69 | 11.1%(+6.68)#6,620 |
| 70. | Perryman | 17.6% | 9.8%(+7.84)#70 | 11.1%(+6.58)#6,661 |
| 71. | Loch Lynn Heights | 17.4% | 9.8%(+7.58)#71 | 11.1%(+6.32)#6,785 |
| 72. | Hancock | 17.3% | 9.8%(+7.49)#72 | 11.1%(+6.23)#6,832 |
| 73. | South Kensington | 17.3% | 9.8%(+7.44)#73 | 11.1%(+6.18)#6,849 |
| 74. | North Potomac | 17.1% | 9.8%(+7.31)#74 | 11.1%(+6.05)#6,914 |
| 75. | Chestertown | 17.0% | 9.8%(+7.16)#75 | 11.1%(+5.90)#6,987 |
| 76. | Clinton | 17.0% | 9.8%(+7.15)#76 | 11.1%(+5.89)#6,990 |
| 77. | California | 16.5% | 9.8%(+6.66)#77 | 11.1%(+5.40)#7,307 |
| 78. | Rockville | 16.3% | 9.8%(+6.53)#78 | 11.1%(+5.27)#7,347 |
| 79. | Clarksburg | 16.0% | 9.8%(+6.23)#79 | 11.1%(+4.97)#7,495 |
| 80. | Clear Spring | 16.0% | 9.8%(+6.19)#80 | 11.1%(+4.93)#7,524 |
| 81. | Friendsville | 15.7% | 9.8%(+5.91)#81 | 11.1%(+4.65)#7,672 |
| 82. | Glassmanor | 15.6% | 9.8%(+5.83)#82 | 11.1%(+4.57)#7,704 |
| 83. | Riviera Beach | 15.6% | 9.8%(+5.81)#83 | 11.1%(+4.55)#7,718 |
| 84. | Cambridge | 15.4% | 9.8%(+5.60)#84 | 11.1%(+4.34)#7,822 |
| 85. | Mount Rainier | 15.3% | 9.8%(+5.47)#85 | 11.1%(+4.21)#7,908 |
| 86. | La Plata | 15.1% | 9.8%(+5.33)#86 | 11.1%(+4.07)#7,989 |
| 87. | Waldorf | 15.1% | 9.8%(+5.25)#87 | 11.1%(+3.99)#8,025 |
| 88. | Edmonston | 15.0% | 9.8%(+5.19)#88 | 11.1%(+3.93)#8,055 |
| 89. | Emmitsburg | 15.0% | 9.8%(+5.15)#89 | 11.1%(+3.89)#8,092 |
| 90. | Adelphi | 14.6% | 9.8%(+4.84)#90 | 11.1%(+3.58)#8,276 |
| 91. | Germantown | 14.6% | 9.8%(+4.76)#91 | 11.1%(+3.50)#8,332 |
| 92. | Sudlersville | 14.5% | 9.8%(+4.65)#92 | 11.1%(+3.39)#8,393 |
| 93. | Garrison | 14.3% | 9.8%(+4.46)#93 | 11.1%(+3.20)#8,599 |
| 94. | Greenbelt | 14.1% | 9.8%(+4.33)#94 | 11.1%(+3.07)#8,654 |
| 95. | Hebron | 14.1% | 9.8%(+4.28)#95 | 11.1%(+3.02)#8,684 |
| 96. | Ilchester | 14.0% | 9.8%(+4.19)#96 | 11.1%(+2.93)#8,736 |
| 97. | Maryland City | 13.9% | 9.8%(+4.09)#97 | 11.1%(+2.83)#8,784 |
| 98. | Bel Air | 13.8% | 9.8%(+3.96)#98 | 11.1%(+2.70)#8,867 |
| 99. | Williamsport | 13.7% | 9.8%(+3.90)#99 | 11.1%(+2.64)#8,908 |
| 100. | Hagerstown | 13.7% | 9.8%(+3.90)#100 | 11.1%(+2.64)#8,909 |
Common Questions
What are the Top 10 Cities with the Highest Poverty Level Among Seniors Over the Age of 75 in Maryland?
Top 10 Cities with the Highest Poverty Level Among Seniors Over the Age of 75 in Maryland are:
#1
100.0%
#2
100.0%
#3
100.0%
#4
100.0%
#5
82.3%
#6
67.6%
#7
66.7%
#8
48.5%
#9
48.1%
#10
47.4%
What city has the Highest Poverty Level Among Seniors Over the Age of 75 in Maryland?
Downsville has the Highest Poverty Level Among Seniors Over the Age of 75 in Maryland with 100.0%.
What is the Poverty Level Among Seniors Over the Age of 75 in the State of Maryland?
Poverty Level Among Seniors Over the Age of 75 in Maryland is 9.8%.
What is the Poverty Level Among Seniors Over the Age of 75 in the United States?
Poverty Level Among Seniors Over the Age of 75 in the United States is 11.1%.