Cities with the Highest Poverty Level Among Seniors Over the Age of 75 in Idaho
RELATED REPORTS & OPTIONS
Highest Poverty | Seniors 75+
Idaho
Compare Cities
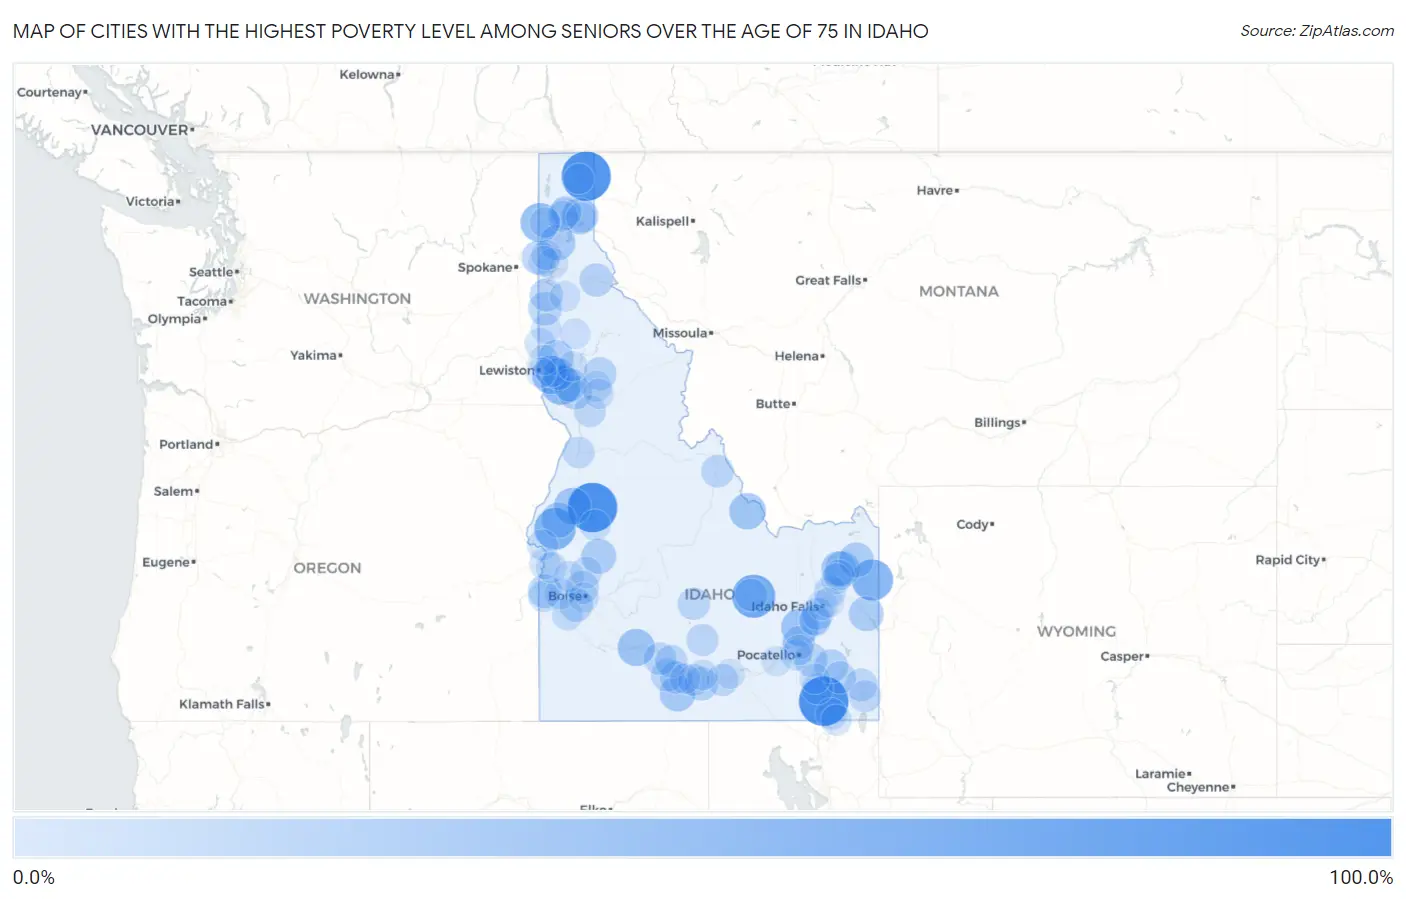
Map of Cities with the Highest Poverty Level Among Seniors Over the Age of 75 in Idaho
0.0%
100.0%
Cities with the Highest Poverty Level Among Seniors Over the Age of 75 in Idaho
| City | Senior Poverty | vs State | vs National | |
| 1. | Donnelly | 100.0% | 9.3%(+90.7)#1 | 11.1%(+88.9)#167 |
| 2. | Oxford | 100.0% | 9.3%(+90.7)#2 | 11.1%(+88.9)#348 |
| 3. | Moyie Springs | 97.9% | 9.3%(+88.6)#3 | 11.1%(+86.8)#400 |
| 4. | Butte City | 69.2% | 9.3%(+59.9)#4 | 11.1%(+58.2)#637 |
| 5. | Midvale | 61.1% | 9.3%(+51.8)#5 | 11.1%(+50.0)#815 |
| 6. | Tetonia | 60.0% | 9.3%(+50.7)#6 | 11.1%(+48.9)#842 |
| 7. | Winchester | 51.9% | 9.3%(+42.6)#7 | 11.1%(+40.8)#1,126 |
| 8. | Oldtown | 50.0% | 9.3%(+40.7)#8 | 11.1%(+38.9)#1,200 |
| 9. | Sweetwater | 46.2% | 9.3%(+36.9)#9 | 11.1%(+35.1)#1,492 |
| 10. | Moreland | 42.9% | 9.3%(+33.6)#10 | 11.1%(+31.8)#1,679 |
| 11. | Glenns Ferry | 40.5% | 9.3%(+31.2)#11 | 11.1%(+29.5)#1,866 |
| 12. | Council | 40.0% | 9.3%(+30.7)#12 | 11.1%(+28.9)#1,903 |
| 13. | Leadore | 37.5% | 9.3%(+28.2)#13 | 11.1%(+26.4)#2,181 |
| 14. | Hope | 37.5% | 9.3%(+28.2)#14 | 11.1%(+26.4)#2,185 |
| 15. | Athol | 33.8% | 9.3%(+24.5)#15 | 11.1%(+22.8)#2,527 |
| 16. | Hollister | 33.3% | 9.3%(+24.0)#16 | 11.1%(+22.3)#2,622 |
| 17. | Cambridge | 32.0% | 9.3%(+22.7)#17 | 11.1%(+20.9)#2,845 |
| 18. | St Anthony | 31.4% | 9.3%(+22.1)#18 | 11.1%(+20.4)#2,908 |
| 19. | Parker | 31.2% | 9.3%(+22.0)#19 | 11.1%(+20.2)#2,927 |
| 20. | Ashton | 30.9% | 9.3%(+21.6)#20 | 11.1%(+19.8)#2,977 |
| 21. | Crouch | 30.6% | 9.3%(+21.3)#21 | 11.1%(+19.5)#3,033 |
| 22. | Irwin | 30.4% | 9.3%(+21.1)#22 | 11.1%(+19.4)#3,053 |
| 23. | Juliaetta | 29.7% | 9.3%(+20.4)#23 | 11.1%(+18.7)#3,177 |
| 24. | Hauser | 26.9% | 9.3%(+17.6)#24 | 11.1%(+15.9)#3,675 |
| 25. | Wilder | 25.8% | 9.3%(+16.5)#25 | 11.1%(+14.7)#3,914 |
| 26. | Bancroft | 25.8% | 9.3%(+16.5)#26 | 11.1%(+14.7)#3,925 |
| 27. | Ferdinand | 25.0% | 9.3%(+15.7)#27 | 11.1%(+13.9)#4,148 |
| 28. | Murtaugh | 25.0% | 9.3%(+15.7)#28 | 11.1%(+13.9)#4,157 |
| 29. | Tensed | 25.0% | 9.3%(+15.7)#29 | 11.1%(+13.9)#4,186 |
| 30. | Kuna | 24.4% | 9.3%(+15.1)#30 | 11.1%(+13.3)#4,283 |
| 31. | Osburn | 23.9% | 9.3%(+14.6)#31 | 11.1%(+12.8)#4,390 |
| 32. | Craigmont | 23.8% | 9.3%(+14.5)#32 | 11.1%(+12.7)#4,422 |
| 33. | Plummer | 22.5% | 9.3%(+13.2)#33 | 11.1%(+11.4)#4,796 |
| 34. | Inkom | 22.4% | 9.3%(+13.2)#34 | 11.1%(+11.4)#4,813 |
| 35. | Weippe | 22.4% | 9.3%(+13.1)#35 | 11.1%(+11.3)#4,823 |
| 36. | Hidden Springs | 22.1% | 9.3%(+12.8)#36 | 11.1%(+11.0)#4,948 |
| 37. | Buhl | 21.7% | 9.3%(+12.4)#37 | 11.1%(+10.6)#5,059 |
| 38. | Fort Hall | 20.9% | 9.3%(+11.6)#38 | 11.1%(+9.79)#5,306 |
| 39. | Georgetown | 20.5% | 9.3%(+11.2)#39 | 11.1%(+9.45)#5,428 |
| 40. | Filer | 20.5% | 9.3%(+11.2)#40 | 11.1%(+9.41)#5,438 |
| 41. | Hagerman | 20.1% | 9.3%(+10.8)#41 | 11.1%(+9.05)#5,543 |
| 42. | Salmon | 20.0% | 9.3%(+10.7)#42 | 11.1%(+8.93)#5,561 |
| 43. | Arco | 20.0% | 9.3%(+10.7)#43 | 11.1%(+8.93)#5,588 |
| 44. | Firth | 20.0% | 9.3%(+10.7)#44 | 11.1%(+8.93)#5,608 |
| 45. | Wendell | 19.6% | 9.3%(+10.3)#45 | 11.1%(+8.53)#5,822 |
| 46. | Hailey | 19.3% | 9.3%(+10.0)#46 | 11.1%(+8.25)#5,929 |
| 47. | Sandpoint | 19.0% | 9.3%(+9.66)#47 | 11.1%(+7.88)#6,085 |
| 48. | Grace | 18.8% | 9.3%(+9.46)#48 | 11.1%(+7.68)#6,155 |
| 49. | Richfield | 18.5% | 9.3%(+9.22)#49 | 11.1%(+7.45)#6,264 |
| 50. | Culdesac | 17.9% | 9.3%(+8.56)#50 | 11.1%(+6.79)#6,573 |
| 51. | Shelley | 17.7% | 9.3%(+8.44)#51 | 11.1%(+6.67)#6,624 |
| 52. | Burley | 17.6% | 9.3%(+8.31)#52 | 11.1%(+6.53)#6,710 |
| 53. | Montpelier | 17.2% | 9.3%(+7.91)#53 | 11.1%(+6.14)#6,873 |
| 54. | Grangeville | 17.1% | 9.3%(+7.81)#54 | 11.1%(+6.04)#6,919 |
| 55. | Lapwai | 16.3% | 9.3%(+7.03)#55 | 11.1%(+5.26)#7,354 |
| 56. | Riggins | 16.3% | 9.3%(+6.98)#56 | 11.1%(+5.21)#7,379 |
| 57. | Rigby | 16.2% | 9.3%(+6.94)#57 | 11.1%(+5.16)#7,398 |
| 58. | Hansen | 16.0% | 9.3%(+6.74)#58 | 11.1%(+4.97)#7,494 |
| 59. | Preston | 15.1% | 9.3%(+5.80)#59 | 11.1%(+4.02)#8,008 |
| 60. | Horseshoe Bend | 14.9% | 9.3%(+5.56)#60 | 11.1%(+3.78)#8,137 |
| 61. | Downey | 14.8% | 9.3%(+5.52)#61 | 11.1%(+3.75)#8,168 |
| 62. | Homedale | 14.4% | 9.3%(+5.13)#62 | 11.1%(+3.36)#8,410 |
| 63. | Fruitland | 14.3% | 9.3%(+5.04)#63 | 11.1%(+3.26)#8,447 |
| 64. | Weiser | 13.6% | 9.3%(+4.27)#64 | 11.1%(+2.50)#9,018 |
| 65. | Kamiah | 13.4% | 9.3%(+4.12)#65 | 11.1%(+2.35)#9,106 |
| 66. | Caldwell | 13.4% | 9.3%(+4.07)#66 | 11.1%(+2.30)#9,135 |
| 67. | Pocatello | 13.3% | 9.3%(+4.05)#67 | 11.1%(+2.28)#9,143 |
| 68. | Cascade | 13.3% | 9.3%(+4.04)#68 | 11.1%(+2.27)#9,154 |
| 69. | Moscow | 13.3% | 9.3%(+4.03)#69 | 11.1%(+2.26)#9,219 |
| 70. | Melba | 13.0% | 9.3%(+3.75)#70 | 11.1%(+1.98)#9,403 |
| 71. | Ponderay | 12.9% | 9.3%(+3.61)#71 | 11.1%(+1.84)#9,504 |
| 72. | Franklin | 12.8% | 9.3%(+3.53)#72 | 11.1%(+1.75)#9,564 |
| 73. | Dover | 12.8% | 9.3%(+3.53)#73 | 11.1%(+1.75)#9,566 |
| 74. | New Plymouth | 12.8% | 9.3%(+3.47)#74 | 11.1%(+1.70)#9,604 |
| 75. | Coeur D Alene | 12.3% | 9.3%(+3.02)#75 | 11.1%(+1.25)#10,030 |
| 76. | Emmett | 12.0% | 9.3%(+2.73)#76 | 11.1%(+0.958)#10,227 |
| 77. | Hazelton | 12.0% | 9.3%(+2.71)#77 | 11.1%(+0.933)#10,247 |
| 78. | Post Falls | 11.9% | 9.3%(+2.61)#78 | 11.1%(+0.838)#10,311 |
| 79. | Rexburg | 11.6% | 9.3%(+2.28)#79 | 11.1%(+0.511)#10,590 |
| 80. | Sugar City | 11.5% | 9.3%(+2.24)#80 | 11.1%(+0.472)#10,610 |
| 81. | St Maries | 11.1% | 9.3%(+1.82)#81 | 11.1%(+0.044)#10,902 |
| 82. | Arimo | 11.1% | 9.3%(+1.82)#82 | 11.1%(+0.044)#10,984 |
| 83. | Bovill | 11.1% | 9.3%(+1.82)#83 | 11.1%(+0.044)#11,013 |
| 84. | Potlatch | 10.9% | 9.3%(+1.61)#84 | 11.1%(-0.158)#11,169 |
| 85. | Twin Falls | 10.8% | 9.3%(+1.47)#85 | 11.1%(-0.307)#11,289 |
| 86. | Bonners Ferry | 10.7% | 9.3%(+1.36)#86 | 11.1%(-0.411)#11,381 |
| 87. | Genesee | 10.5% | 9.3%(+1.23)#87 | 11.1%(-0.541)#11,489 |
| 88. | Priest River | 10.4% | 9.3%(+1.14)#88 | 11.1%(-0.637)#11,600 |
| 89. | Kooskia | 10.2% | 9.3%(+0.910)#89 | 11.1%(-0.863)#11,805 |
| 90. | Rathdrum | 10.1% | 9.3%(+0.825)#90 | 11.1%(-0.948)#11,873 |
| 91. | Basalt | 10.0% | 9.3%(+0.706)#91 | 11.1%(-1.07)#12,002 |
| 92. | Peck | 10.0% | 9.3%(+0.706)#92 | 11.1%(-1.07)#12,050 |
| 93. | Idaho Falls | 9.8% | 9.3%(+0.529)#93 | 11.1%(-1.24)#12,157 |
| 94. | Chubbuck | 9.8% | 9.3%(+0.479)#94 | 11.1%(-1.29)#12,195 |
| 95. | American Falls | 9.6% | 9.3%(+0.349)#95 | 11.1%(-1.42)#12,337 |
| 96. | East Hope | 9.5% | 9.3%(+0.230)#96 | 11.1%(-1.54)#12,465 |
| 97. | Rupert | 9.5% | 9.3%(+0.212)#97 | 11.1%(-1.56)#12,479 |
| 98. | Lewiston | 9.5% | 9.3%(+0.196)#98 | 11.1%(-1.58)#12,488 |
| 99. | Iona | 9.3% | 9.3%(+0.008)#99 | 11.1%(-1.76)#12,645 |
| 100. | Boise City | 9.2% | 9.3%(-0.107)#100 | 11.1%(-1.88)#12,742 |
Common Questions
What are the Top 10 Cities with the Highest Poverty Level Among Seniors Over the Age of 75 in Idaho?
Top 10 Cities with the Highest Poverty Level Among Seniors Over the Age of 75 in Idaho are:
#1
100.0%
#2
100.0%
#3
97.9%
#4
69.2%
#5
61.1%
#6
60.0%
#7
51.9%
#8
50.0%
#9
46.2%
#10
42.9%
What city has the Highest Poverty Level Among Seniors Over the Age of 75 in Idaho?
Donnelly has the Highest Poverty Level Among Seniors Over the Age of 75 in Idaho with 100.0%.
What is the Poverty Level Among Seniors Over the Age of 75 in the State of Idaho?
Poverty Level Among Seniors Over the Age of 75 in Idaho is 9.3%.
What is the Poverty Level Among Seniors Over the Age of 75 in the United States?
Poverty Level Among Seniors Over the Age of 75 in the United States is 11.1%.