Cities with the Highest Poverty Level Among Seniors Over the Age of 75 in Nebraska
RELATED REPORTS & OPTIONS
Highest Poverty | Seniors 75+
Nebraska
Compare Cities
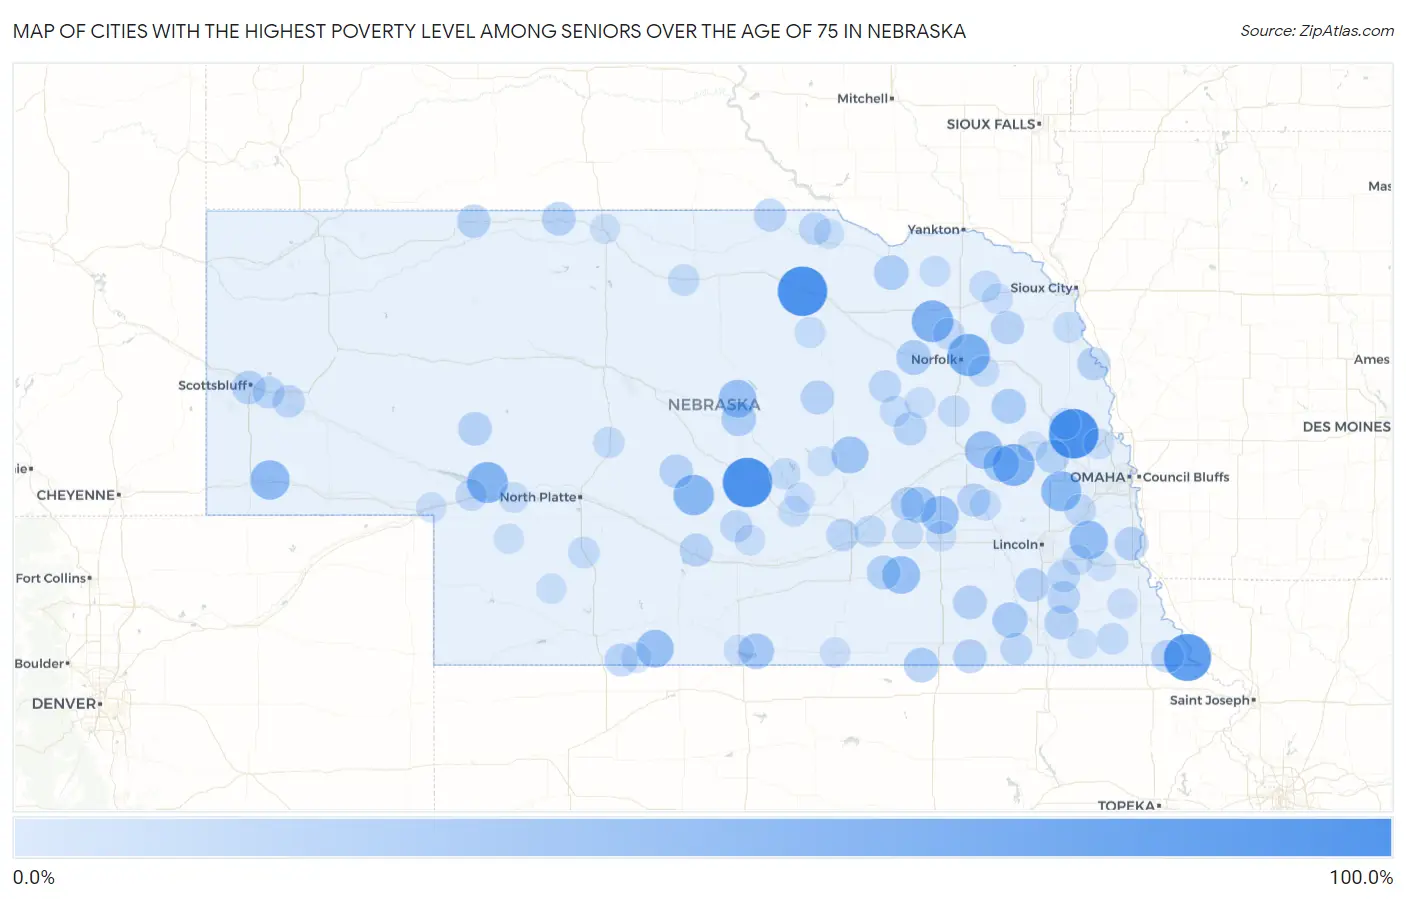
Map of Cities with the Highest Poverty Level Among Seniors Over the Age of 75 in Nebraska
0.0%
100.0%
Cities with the Highest Poverty Level Among Seniors Over the Age of 75 in Nebraska
| City | Senior Poverty | vs State | vs National | |
| 1. | Mason City | 100.0% | 10.3%(+89.7)#1 | 11.1%(+88.9)#212 |
| 2. | Melia | 100.0% | 10.3%(+89.7)#2 | 11.1%(+88.9)#277 |
| 3. | Fontanelle | 100.0% | 10.3%(+89.7)#3 | 11.1%(+88.9)#308 |
| 4. | Emmet | 100.0% | 10.3%(+89.7)#4 | 11.1%(+88.9)#378 |
| 5. | Rulo | 90.0% | 10.3%(+79.7)#5 | 11.1%(+78.9)#424 |
| 6. | Woodland Park | 69.0% | 10.3%(+58.7)#6 | 11.1%(+58.0)#640 |
| 7. | Abie | 66.7% | 10.3%(+56.4)#7 | 11.1%(+55.6)#709 |
| 8. | Foster | 66.7% | 10.3%(+56.4)#8 | 11.1%(+55.6)#711 |
| 9. | Keystone | 63.6% | 10.3%(+53.3)#9 | 11.1%(+52.6)#747 |
| 10. | Oconto | 61.5% | 10.3%(+51.2)#10 | 11.1%(+50.5)#807 |
| 11. | Ithaca | 60.0% | 10.3%(+49.7)#11 | 11.1%(+48.9)#858 |
| 12. | Dix | 56.5% | 10.3%(+46.2)#12 | 11.1%(+45.5)#967 |
| 13. | Elmwood | 53.3% | 10.3%(+43.0)#13 | 11.1%(+42.3)#1,084 |
| 14. | Benedict | 50.0% | 10.3%(+39.7)#14 | 11.1%(+38.9)#1,211 |
| 15. | Taylor | 50.0% | 10.3%(+39.7)#15 | 11.1%(+38.9)#1,263 |
| 16. | Wilsonville | 50.0% | 10.3%(+39.7)#16 | 11.1%(+38.9)#1,299 |
| 17. | Richland | 50.0% | 10.3%(+39.7)#17 | 11.1%(+38.9)#1,304 |
| 18. | Saronville | 50.0% | 10.3%(+39.7)#18 | 11.1%(+38.9)#1,307 |
| 19. | Wolbach | 46.7% | 10.3%(+36.4)#19 | 11.1%(+35.6)#1,459 |
| 20. | Polk | 42.9% | 10.3%(+32.6)#20 | 11.1%(+31.8)#1,693 |
| 21. | Octavia | 42.9% | 10.3%(+32.6)#21 | 11.1%(+31.8)#1,705 |
| 22. | Republican City | 41.4% | 10.3%(+31.1)#22 | 11.1%(+30.3)#1,814 |
| 23. | Plymouth | 39.7% | 10.3%(+29.4)#23 | 11.1%(+28.7)#1,974 |
| 24. | Tilden | 37.9% | 10.3%(+27.6)#24 | 11.1%(+26.9)#2,129 |
| 25. | Byron | 37.5% | 10.3%(+27.2)#25 | 11.1%(+26.4)#2,190 |
| 26. | Verdigre | 37.2% | 10.3%(+26.9)#26 | 11.1%(+26.1)#2,211 |
| 27. | Sargent | 37.2% | 10.3%(+26.9)#27 | 11.1%(+26.1)#2,212 |
| 28. | Howells | 37.1% | 10.3%(+26.8)#28 | 11.1%(+26.0)#2,220 |
| 29. | Harvard | 34.6% | 10.3%(+24.3)#29 | 11.1%(+23.5)#2,452 |
| 30. | Cedar Bluffs | 34.2% | 10.3%(+23.9)#30 | 11.1%(+23.1)#2,493 |
| 31. | Terrytown | 33.3% | 10.3%(+23.0)#31 | 11.1%(+22.3)#2,590 |
| 32. | Hallam | 33.3% | 10.3%(+23.0)#32 | 11.1%(+22.3)#2,633 |
| 33. | Union | 33.3% | 10.3%(+23.0)#33 | 11.1%(+22.3)#2,642 |
| 34. | Kilgore | 33.3% | 10.3%(+23.0)#34 | 11.1%(+22.3)#2,693 |
| 35. | Arthur | 33.3% | 10.3%(+23.0)#35 | 11.1%(+22.3)#2,702 |
| 36. | Tobias | 33.3% | 10.3%(+23.0)#36 | 11.1%(+22.3)#2,705 |
| 37. | Filley | 33.3% | 10.3%(+23.0)#37 | 11.1%(+22.3)#2,706 |
| 38. | Ericson | 33.3% | 10.3%(+23.0)#38 | 11.1%(+22.3)#2,709 |
| 39. | Reynolds | 33.3% | 10.3%(+23.0)#39 | 11.1%(+22.3)#2,717 |
| 40. | Callaway | 32.8% | 10.3%(+22.5)#40 | 11.1%(+21.7)#2,765 |
| 41. | Merriman | 32.0% | 10.3%(+21.7)#41 | 11.1%(+20.9)#2,850 |
| 42. | Wayne | 31.9% | 10.3%(+21.6)#42 | 11.1%(+20.8)#2,851 |
| 43. | Hordville | 31.8% | 10.3%(+21.5)#43 | 11.1%(+20.8)#2,869 |
| 44. | Surprise | 31.2% | 10.3%(+20.9)#44 | 11.1%(+20.2)#2,940 |
| 45. | St Edward | 31.2% | 10.3%(+20.9)#45 | 11.1%(+20.1)#2,946 |
| 46. | Lexington | 31.0% | 10.3%(+20.7)#46 | 11.1%(+19.9)#2,961 |
| 47. | Decatur | 30.8% | 10.3%(+20.5)#47 | 11.1%(+19.7)#2,990 |
| 48. | Danbury | 30.8% | 10.3%(+20.5)#48 | 11.1%(+19.7)#3,007 |
| 49. | Falls City | 30.0% | 10.3%(+19.7)#49 | 11.1%(+18.9)#3,097 |
| 50. | Adams | 30.0% | 10.3%(+19.7)#50 | 11.1%(+18.9)#3,112 |
| 51. | Naper | 29.6% | 10.3%(+19.3)#51 | 11.1%(+18.6)#3,199 |
| 52. | Bayard | 29.1% | 10.3%(+18.8)#52 | 11.1%(+18.0)#3,283 |
| 53. | Alda | 28.2% | 10.3%(+17.9)#53 | 11.1%(+17.1)#3,430 |
| 54. | Panama | 27.8% | 10.3%(+17.5)#54 | 11.1%(+16.7)#3,509 |
| 55. | Miller | 27.8% | 10.3%(+17.5)#55 | 11.1%(+16.7)#3,513 |
| 56. | Spencer | 27.6% | 10.3%(+17.3)#56 | 11.1%(+16.5)#3,540 |
| 57. | Diller | 27.3% | 10.3%(+17.0)#57 | 11.1%(+16.2)#3,604 |
| 58. | Minatare | 27.2% | 10.3%(+16.9)#58 | 11.1%(+16.1)#3,627 |
| 59. | Petersburg | 26.7% | 10.3%(+16.4)#59 | 11.1%(+15.6)#3,720 |
| 60. | Ashland | 25.7% | 10.3%(+15.4)#60 | 11.1%(+14.6)#3,951 |
| 61. | Pierce | 25.7% | 10.3%(+15.4)#61 | 11.1%(+14.6)#3,952 |
| 62. | Ogallala | 25.3% | 10.3%(+15.0)#62 | 11.1%(+14.3)#4,015 |
| 63. | Ainsworth | 25.3% | 10.3%(+15.0)#63 | 11.1%(+14.2)#4,020 |
| 64. | Humphrey | 25.0% | 10.3%(+14.7)#64 | 11.1%(+13.9)#4,084 |
| 65. | Table Rock | 25.0% | 10.3%(+14.7)#65 | 11.1%(+13.9)#4,117 |
| 66. | Phillips | 25.0% | 10.3%(+14.7)#66 | 11.1%(+13.9)#4,121 |
| 67. | Winslow | 25.0% | 10.3%(+14.7)#67 | 11.1%(+13.9)#4,172 |
| 68. | Wellfleet | 25.0% | 10.3%(+14.7)#68 | 11.1%(+13.9)#4,182 |
| 69. | Coleridge | 24.5% | 10.3%(+14.2)#69 | 11.1%(+13.5)#4,262 |
| 70. | Loup City | 24.1% | 10.3%(+13.8)#70 | 11.1%(+13.0)#4,349 |
| 71. | Stapleton | 24.1% | 10.3%(+13.8)#71 | 11.1%(+13.0)#4,359 |
| 72. | Stanton | 23.8% | 10.3%(+13.5)#72 | 11.1%(+12.7)#4,437 |
| 73. | Winnebago | 23.5% | 10.3%(+13.2)#73 | 11.1%(+12.5)#4,505 |
| 74. | Ulysses | 23.5% | 10.3%(+13.2)#74 | 11.1%(+12.5)#4,515 |
| 75. | Albion | 23.1% | 10.3%(+12.8)#75 | 11.1%(+12.1)#4,599 |
| 76. | Chambers | 22.9% | 10.3%(+12.6)#76 | 11.1%(+11.8)#4,696 |
| 77. | Ravenna | 22.8% | 10.3%(+12.5)#77 | 11.1%(+11.8)#4,702 |
| 78. | Bloomfield | 22.6% | 10.3%(+12.3)#78 | 11.1%(+11.5)#4,759 |
| 79. | Hampton | 22.6% | 10.3%(+12.3)#79 | 11.1%(+11.5)#4,771 |
| 80. | Kennard | 22.6% | 10.3%(+12.3)#80 | 11.1%(+11.5)#4,772 |
| 81. | Palmyra | 22.2% | 10.3%(+11.9)#81 | 11.1%(+11.2)#4,868 |
| 82. | Amherst | 22.2% | 10.3%(+11.9)#82 | 11.1%(+11.2)#4,903 |
| 83. | Lebanon | 22.2% | 10.3%(+11.9)#83 | 11.1%(+11.2)#4,922 |
| 84. | Newman Grove | 22.0% | 10.3%(+11.6)#84 | 11.1%(+10.9)#4,977 |
| 85. | Paxton | 21.3% | 10.3%(+11.0)#85 | 11.1%(+10.2)#5,187 |
| 86. | Laurel | 21.2% | 10.3%(+10.9)#86 | 11.1%(+10.1)#5,205 |
| 87. | Johnson | 21.2% | 10.3%(+10.9)#87 | 11.1%(+10.1)#5,209 |
| 88. | Alma | 20.7% | 10.3%(+10.4)#88 | 11.1%(+9.64)#5,355 |
| 89. | York | 20.5% | 10.3%(+10.2)#89 | 11.1%(+9.45)#5,422 |
| 90. | Red Cloud | 20.5% | 10.3%(+10.2)#90 | 11.1%(+9.39)#5,448 |
| 91. | Big Springs | 20.0% | 10.3%(+9.70)#91 | 11.1%(+8.93)#5,613 |
| 92. | Hayes Center | 20.0% | 10.3%(+9.70)#92 | 11.1%(+8.93)#5,643 |
| 93. | Rockville | 20.0% | 10.3%(+9.70)#93 | 11.1%(+8.93)#5,666 |
| 94. | Elsie | 20.0% | 10.3%(+9.70)#94 | 11.1%(+8.93)#5,679 |
| 95. | Burchard | 20.0% | 10.3%(+9.70)#95 | 11.1%(+8.93)#5,703 |
| 96. | Bristow | 20.0% | 10.3%(+9.70)#96 | 11.1%(+8.93)#5,707 |
| 97. | Cotesfield | 20.0% | 10.3%(+9.70)#97 | 11.1%(+8.93)#5,712 |
| 98. | Valentine | 19.4% | 10.3%(+9.07)#98 | 11.1%(+8.31)#5,897 |
| 99. | Syracuse | 19.3% | 10.3%(+8.98)#99 | 11.1%(+8.22)#5,943 |
| 100. | North Bend | 19.2% | 10.3%(+8.93)#100 | 11.1%(+8.16)#5,962 |
Common Questions
What are the Top 10 Cities with the Highest Poverty Level Among Seniors Over the Age of 75 in Nebraska?
Top 10 Cities with the Highest Poverty Level Among Seniors Over the Age of 75 in Nebraska are:
#1
100.0%
#2
100.0%
#3
100.0%
#4
90.0%
#5
69.0%
#6
66.7%
#7
66.7%
#8
63.6%
#9
61.5%
#10
60.0%
What city has the Highest Poverty Level Among Seniors Over the Age of 75 in Nebraska?
Mason City has the Highest Poverty Level Among Seniors Over the Age of 75 in Nebraska with 100.0%.
What is the Poverty Level Among Seniors Over the Age of 75 in the State of Nebraska?
Poverty Level Among Seniors Over the Age of 75 in Nebraska is 10.3%.
What is the Poverty Level Among Seniors Over the Age of 75 in the United States?
Poverty Level Among Seniors Over the Age of 75 in the United States is 11.1%.