Cities with the Highest Poverty Level Among Seniors Over the Age of 75 in Massachusetts
RELATED REPORTS & OPTIONS
Highest Poverty | Seniors 75+
Massachusetts
Compare Cities
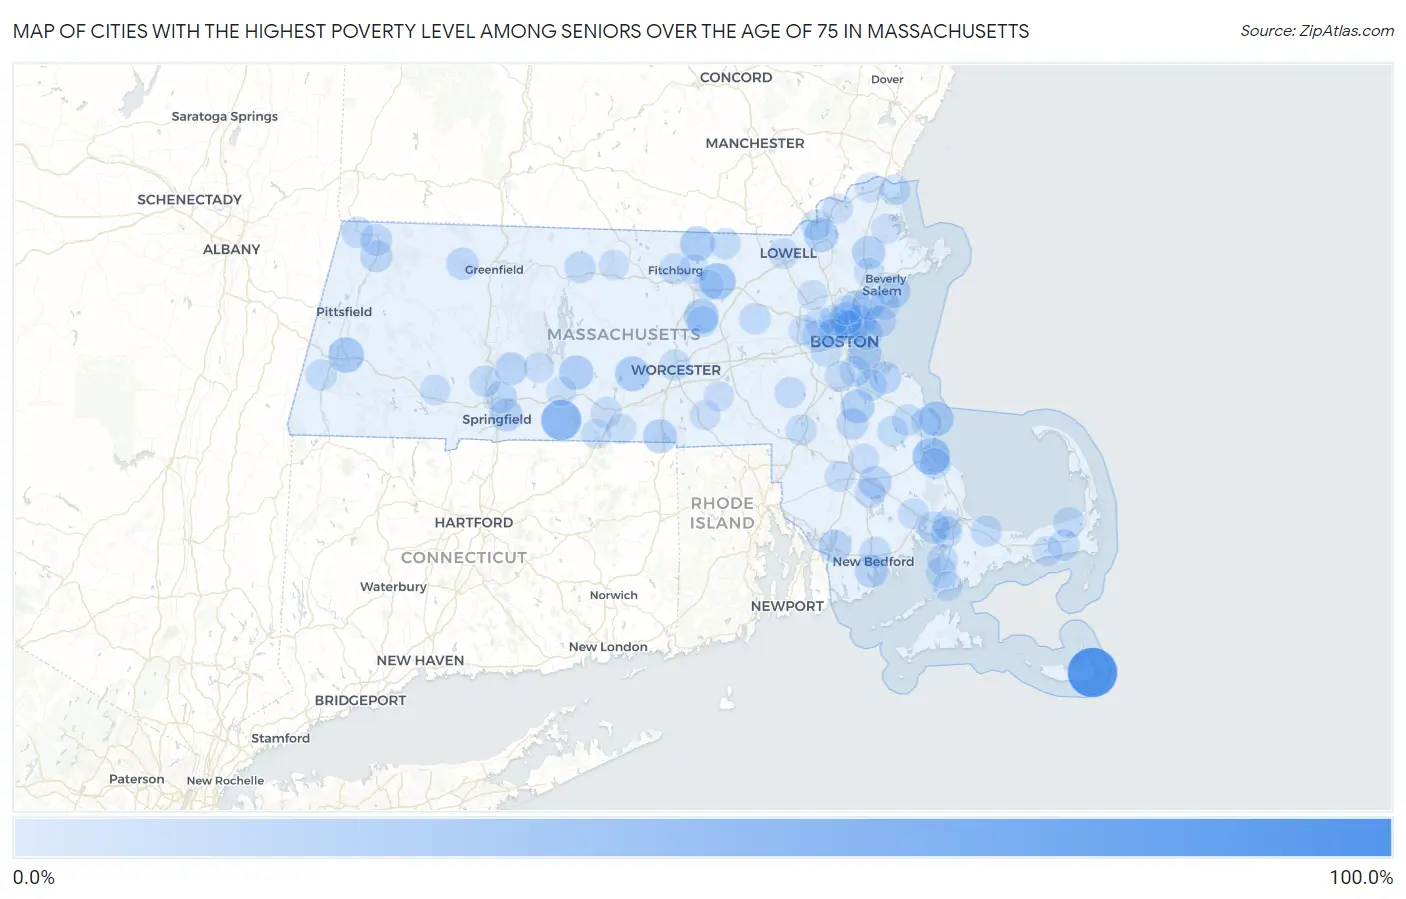
Map of Cities with the Highest Poverty Level Among Seniors Over the Age of 75 in Massachusetts
0.0%
100.0%
Cities with the Highest Poverty Level Among Seniors Over the Age of 75 in Massachusetts
| City | Senior Poverty | vs State | vs National | |
| 1. | West Warren | 100.0% | 11.8%(+88.2)#1 | 11.1%(+88.9)#45 |
| 2. | Siasconset | 92.5% | 11.8%(+80.7)#2 | 11.1%(+81.5)#413 |
| 3. | Green Harbor | 69.7% | 11.8%(+57.9)#3 | 11.1%(+58.6)#626 |
| 4. | Monson Center | 52.8% | 11.8%(+41.0)#4 | 11.1%(+41.7)#1,104 |
| 5. | North Plymouth | 40.4% | 11.8%(+28.6)#5 | 11.1%(+29.4)#1,873 |
| 6. | Devens | 36.1% | 11.8%(+24.2)#6 | 11.1%(+25.0)#2,308 |
| 7. | Lee | 33.1% | 11.8%(+21.3)#7 | 11.1%(+22.1)#2,739 |
| 8. | Spencer | 30.5% | 11.8%(+18.7)#8 | 11.1%(+19.4)#3,038 |
| 9. | South Lancaster | 30.5% | 11.8%(+18.6)#9 | 11.1%(+19.4)#3,042 |
| 10. | Townsend | 30.0% | 11.8%(+18.2)#10 | 11.1%(+18.9)#3,106 |
| 11. | Ocean Bluff Brant Rock | 29.9% | 11.8%(+18.1)#11 | 11.1%(+18.8)#3,157 |
| 12. | Ware | 28.4% | 11.8%(+16.6)#12 | 11.1%(+17.4)#3,401 |
| 13. | Lawrence | 27.6% | 11.8%(+15.8)#13 | 11.1%(+16.6)#3,525 |
| 14. | Holbrook | 26.5% | 11.8%(+14.6)#14 | 11.1%(+15.4)#3,766 |
| 15. | Webster | 26.3% | 11.8%(+14.5)#15 | 11.1%(+15.3)#3,786 |
| 16. | Boston | 25.0% | 11.8%(+13.2)#16 | 11.1%(+13.9)#4,198 |
| 17. | Salem | 24.8% | 11.8%(+12.9)#17 | 11.1%(+13.7)#4,232 |
| 18. | Topsfield | 24.3% | 11.8%(+12.5)#18 | 11.1%(+13.2)#4,307 |
| 19. | Greenfield | 23.1% | 11.8%(+11.2)#19 | 11.1%(+12.0)#4,643 |
| 20. | Middleborough Center | 22.9% | 11.8%(+11.1)#20 | 11.1%(+11.8)#4,678 |
| 21. | Chelsea | 22.8% | 11.8%(+11.0)#21 | 11.1%(+11.8)#4,705 |
| 22. | Fall River | 22.6% | 11.8%(+10.8)#22 | 11.1%(+11.5)#4,761 |
| 23. | Bliss Corner | 22.4% | 11.8%(+10.6)#23 | 11.1%(+11.3)#4,830 |
| 24. | Springfield | 22.2% | 11.8%(+10.4)#24 | 11.1%(+11.1)#4,926 |
| 25. | Granby | 21.6% | 11.8%(+9.73)#25 | 11.1%(+10.5)#5,107 |
| 26. | Revere | 20.9% | 11.8%(+9.03)#26 | 11.1%(+9.79)#5,307 |
| 27. | Hingham | 20.8% | 11.8%(+8.96)#27 | 11.1%(+9.72)#5,334 |
| 28. | Winthrop Town | 20.8% | 11.8%(+8.95)#28 | 11.1%(+9.71)#5,336 |
| 29. | Malden | 20.8% | 11.8%(+8.95)#29 | 11.1%(+9.70)#5,337 |
| 30. | Shelburne Falls | 20.1% | 11.8%(+8.30)#30 | 11.1%(+9.06)#5,541 |
| 31. | Lynn | 19.9% | 11.8%(+8.05)#31 | 11.1%(+8.80)#5,739 |
| 32. | Adams | 19.5% | 11.8%(+7.70)#32 | 11.1%(+8.45)#5,843 |
| 33. | Onset | 19.2% | 11.8%(+7.35)#33 | 11.1%(+8.10)#5,999 |
| 34. | Brockton | 18.2% | 11.8%(+6.40)#34 | 11.1%(+7.16)#6,372 |
| 35. | Chicopee | 18.1% | 11.8%(+6.32)#35 | 11.1%(+7.07)#6,466 |
| 36. | Saugus | 18.1% | 11.8%(+6.26)#36 | 11.1%(+7.02)#6,485 |
| 37. | North Adams | 17.8% | 11.8%(+5.99)#37 | 11.1%(+6.75)#6,592 |
| 38. | Nahant | 17.8% | 11.8%(+5.93)#38 | 11.1%(+6.69)#6,617 |
| 39. | Athol | 17.6% | 11.8%(+5.81)#39 | 11.1%(+6.57)#6,699 |
| 40. | Cedar Crest | 17.6% | 11.8%(+5.76)#40 | 11.1%(+6.52)#6,717 |
| 41. | Somerville | 17.3% | 11.8%(+5.52)#41 | 11.1%(+6.28)#6,813 |
| 42. | Williamstown | 17.2% | 11.8%(+5.42)#42 | 11.1%(+6.17)#6,850 |
| 43. | Weymouth Town | 16.8% | 11.8%(+5.01)#43 | 11.1%(+5.76)#7,033 |
| 44. | New Bedford | 16.7% | 11.8%(+4.88)#44 | 11.1%(+5.64)#7,069 |
| 45. | Maynard | 16.7% | 11.8%(+4.84)#45 | 11.1%(+5.60)#7,077 |
| 46. | Holyoke | 16.4% | 11.8%(+4.61)#46 | 11.1%(+5.36)#7,320 |
| 47. | East Sandwich | 16.4% | 11.8%(+4.56)#47 | 11.1%(+5.32)#7,338 |
| 48. | Medfield | 16.3% | 11.8%(+4.45)#48 | 11.1%(+5.21)#7,381 |
| 49. | Clinton | 16.3% | 11.8%(+4.44)#49 | 11.1%(+5.20)#7,385 |
| 50. | West Falmouth | 16.2% | 11.8%(+4.34)#50 | 11.1%(+5.10)#7,429 |
| 51. | Northwest Harwich | 16.2% | 11.8%(+4.34)#51 | 11.1%(+5.09)#7,434 |
| 52. | North Falmouth | 16.1% | 11.8%(+4.32)#52 | 11.1%(+5.07)#7,442 |
| 53. | Housatonic | 16.1% | 11.8%(+4.31)#53 | 11.1%(+5.06)#7,453 |
| 54. | Brookline | 16.1% | 11.8%(+4.27)#54 | 11.1%(+5.02)#7,471 |
| 55. | Bourne | 16.0% | 11.8%(+4.15)#55 | 11.1%(+4.91)#7,543 |
| 56. | Fitchburg | 15.9% | 11.8%(+4.12)#56 | 11.1%(+4.88)#7,552 |
| 57. | Brewster | 15.9% | 11.8%(+4.07)#57 | 11.1%(+4.83)#7,580 |
| 58. | Watertown Town | 15.9% | 11.8%(+4.04)#58 | 11.1%(+4.80)#7,590 |
| 59. | Foxborough | 15.9% | 11.8%(+4.03)#59 | 11.1%(+4.79)#7,592 |
| 60. | Quincy | 15.9% | 11.8%(+4.03)#60 | 11.1%(+4.79)#7,593 |
| 61. | Plymouth | 15.8% | 11.8%(+3.97)#61 | 11.1%(+4.72)#7,612 |
| 62. | West Wareham | 15.8% | 11.8%(+3.97)#62 | 11.1%(+4.72)#7,618 |
| 63. | Pepperell | 15.6% | 11.8%(+3.82)#63 | 11.1%(+4.58)#7,701 |
| 64. | Everett | 15.4% | 11.8%(+3.57)#64 | 11.1%(+4.33)#7,827 |
| 65. | North Pembroke | 15.4% | 11.8%(+3.54)#65 | 11.1%(+4.30)#7,884 |
| 66. | Salisbury | 15.2% | 11.8%(+3.38)#66 | 11.1%(+4.13)#7,953 |
| 67. | Hanson | 15.2% | 11.8%(+3.35)#67 | 11.1%(+4.10)#7,966 |
| 68. | Methuen Town | 15.1% | 11.8%(+3.26)#68 | 11.1%(+4.01)#8,014 |
| 69. | Worcester | 15.1% | 11.8%(+3.25)#69 | 11.1%(+4.01)#8,016 |
| 70. | Taunton | 14.7% | 11.8%(+2.90)#70 | 11.1%(+3.66)#8,218 |
| 71. | Milton | 14.6% | 11.8%(+2.81)#71 | 11.1%(+3.56)#8,303 |
| 72. | Marshfield | 14.6% | 11.8%(+2.80)#72 | 11.1%(+3.56)#8,304 |
| 73. | Fiskdale | 14.6% | 11.8%(+2.78)#73 | 11.1%(+3.53)#8,322 |
| 74. | North Lakeville | 14.2% | 11.8%(+2.38)#74 | 11.1%(+3.14)#8,616 |
| 75. | Lowell | 13.6% | 11.8%(+1.76)#75 | 11.1%(+2.52)#9,008 |
| 76. | Arlington | 13.4% | 11.8%(+1.55)#76 | 11.1%(+2.30)#9,131 |
| 77. | Russell | 13.3% | 11.8%(+1.51)#77 | 11.1%(+2.27)#9,175 |
| 78. | Whitinsville | 13.2% | 11.8%(+1.40)#78 | 11.1%(+2.16)#9,272 |
| 79. | Bridgewater Town | 12.9% | 11.8%(+1.06)#79 | 11.1%(+1.81)#9,528 |
| 80. | Haverhill | 12.9% | 11.8%(+1.05)#80 | 11.1%(+1.81)#9,531 |
| 81. | Buzzards Bay | 12.8% | 11.8%(+1.02)#81 | 11.1%(+1.78)#9,553 |
| 82. | Baldwinville | 12.8% | 11.8%(+0.968)#82 | 11.1%(+1.72)#9,590 |
| 83. | Waltham | 12.8% | 11.8%(+0.963)#83 | 11.1%(+1.72)#9,595 |
| 84. | Swampscott | 12.5% | 11.8%(+0.677)#84 | 11.1%(+1.43)#9,780 |
| 85. | Falmouth | 12.5% | 11.8%(+0.658)#85 | 11.1%(+1.41)#9,926 |
| 86. | Belchertown | 12.5% | 11.8%(+0.636)#86 | 11.1%(+1.39)#9,933 |
| 87. | West Dennis | 12.3% | 11.8%(+0.468)#87 | 11.1%(+1.22)#10,039 |
| 88. | Shirley | 12.2% | 11.8%(+0.407)#88 | 11.1%(+1.16)#10,081 |
| 89. | Upton | 12.2% | 11.8%(+0.357)#89 | 11.1%(+1.11)#10,134 |
| 90. | Medford | 12.1% | 11.8%(+0.308)#90 | 11.1%(+1.06)#10,155 |
| 91. | Burlington | 12.1% | 11.8%(+0.244)#91 | 11.1%(+1.00)#10,204 |
| 92. | Southbridge Town | 12.1% | 11.8%(+0.243)#92 | 11.1%(+0.999)#10,205 |
| 93. | Holland | 11.8% | 11.8%(+0.005)#93 | 11.1%(+0.761)#10,372 |
| 94. | Rowley | 11.8% | 11.8%(-0.058)#94 | 11.1%(+0.698)#10,414 |
| 95. | Cambridge | 11.7% | 11.8%(-0.096)#95 | 11.1%(+0.660)#10,472 |
| 96. | Palmer Town | 11.5% | 11.8%(-0.288)#96 | 11.1%(+0.468)#10,628 |
| 97. | Amesbury Town | 11.2% | 11.8%(-0.628)#97 | 11.1%(+0.128)#10,842 |
| 98. | Melrose | 11.2% | 11.8%(-0.670)#98 | 11.1%(+0.086)#10,864 |
| 99. | Danvers | 11.1% | 11.8%(-0.680)#99 | 11.1%(+0.076)#10,871 |
| 100. | Lunenburg | 11.1% | 11.8%(-0.763)#100 | 11.1%(-0.007)#11,057 |
Common Questions
What are the Top 10 Cities with the Highest Poverty Level Among Seniors Over the Age of 75 in Massachusetts?
Top 10 Cities with the Highest Poverty Level Among Seniors Over the Age of 75 in Massachusetts are:
#1
92.5%
#2
52.8%
#3
40.4%
#4
36.1%
#5
33.1%
#6
30.5%
#7
30.5%
#8
30.0%
#9
29.9%
#10
28.4%
What city has the Highest Poverty Level Among Seniors Over the Age of 75 in Massachusetts?
Siasconset has the Highest Poverty Level Among Seniors Over the Age of 75 in Massachusetts with 92.5%.
What is the Poverty Level Among Seniors Over the Age of 75 in the State of Massachusetts?
Poverty Level Among Seniors Over the Age of 75 in Massachusetts is 11.8%.
What is the Poverty Level Among Seniors Over the Age of 75 in the United States?
Poverty Level Among Seniors Over the Age of 75 in the United States is 11.1%.