Cities with the Highest Poverty Level Among Seniors Over the Age of 75 in Kentucky
RELATED REPORTS & OPTIONS
Highest Poverty | Seniors 75+
Kentucky
Compare Cities
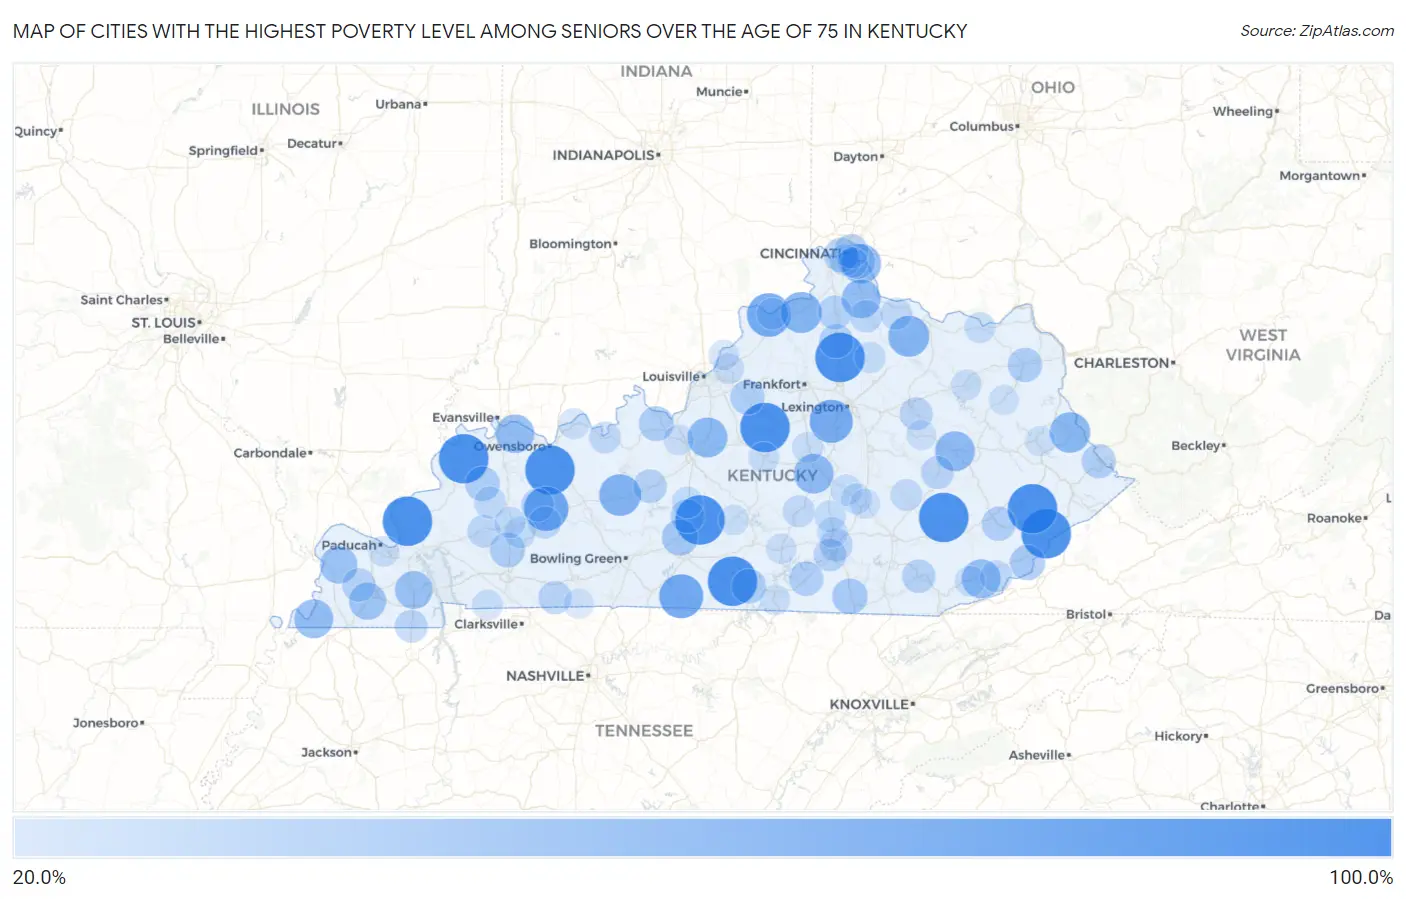
Map of Cities with the Highest Poverty Level Among Seniors Over the Age of 75 in Kentucky
0.0%
100.0%
Cities with the Highest Poverty Level Among Seniors Over the Age of 75 in Kentucky
| City | Senior Poverty | vs State | vs National | |
| 1. | Breckinridge Center | 100.0% | 13.2%(+86.8)#1 | 11.1%(+88.9)#11 |
| 2. | Millstone | 100.0% | 13.2%(+86.8)#2 | 11.1%(+88.9)#54 |
| 3. | Chaplin | 100.0% | 13.2%(+86.8)#3 | 11.1%(+88.9)#62 |
| 4. | Pippa Passes | 100.0% | 13.2%(+86.8)#4 | 11.1%(+88.9)#76 |
| 5. | Sadieville | 100.0% | 13.2%(+86.8)#5 | 11.1%(+88.9)#123 |
| 6. | Oneida | 100.0% | 13.2%(+86.8)#6 | 11.1%(+88.9)#142 |
| 7. | Utica | 100.0% | 13.2%(+86.8)#7 | 11.1%(+88.9)#144 |
| 8. | Hardyville | 100.0% | 13.2%(+86.8)#8 | 11.1%(+88.9)#150 |
| 9. | Moseleyville | 100.0% | 13.2%(+86.8)#9 | 11.1%(+88.9)#178 |
| 10. | Burna | 100.0% | 13.2%(+86.8)#10 | 11.1%(+88.9)#247 |
| 11. | Marrowbone | 100.0% | 13.2%(+86.8)#11 | 11.1%(+88.9)#279 |
| 12. | St. Joseph | 90.2% | 13.2%(+77.0)#12 | 11.1%(+79.2)#421 |
| 13. | South Carrollton | 80.0% | 13.2%(+66.8)#13 | 11.1%(+68.9)#491 |
| 14. | Fountain Run | 78.3% | 13.2%(+65.1)#14 | 11.1%(+67.2)#515 |
| 15. | Prestonville | 76.7% | 13.2%(+63.5)#15 | 11.1%(+65.6)#534 |
| 16. | Keene | 75.0% | 13.2%(+61.8)#16 | 11.1%(+63.9)#560 |
| 17. | West Van Lear | 71.4% | 13.2%(+58.2)#17 | 11.1%(+60.4)#604 |
| 18. | Caneyville | 68.8% | 13.2%(+55.6)#18 | 11.1%(+57.7)#641 |
| 19. | Sparta | 66.7% | 13.2%(+53.5)#19 | 11.1%(+55.6)#678 |
| 20. | Sardis | 66.7% | 13.2%(+53.5)#20 | 11.1%(+55.6)#705 |
| 21. | Inez | 64.1% | 13.2%(+50.9)#21 | 11.1%(+53.0)#735 |
| 22. | Lebanon Junction | 62.2% | 13.2%(+49.0)#22 | 11.1%(+51.1)#787 |
| 23. | Campton | 61.5% | 13.2%(+48.3)#23 | 11.1%(+50.5)#805 |
| 24. | Junction City | 61.2% | 13.2%(+48.0)#24 | 11.1%(+50.1)#811 |
| 25. | Melbourne | 60.8% | 13.2%(+47.6)#25 | 11.1%(+49.7)#825 |
| 26. | Hickman | 58.2% | 13.2%(+45.0)#26 | 11.1%(+47.2)#908 |
| 27. | Harlan | 58.1% | 13.2%(+44.9)#27 | 11.1%(+47.0)#914 |
| 28. | Butler | 58.1% | 13.2%(+44.9)#28 | 11.1%(+47.0)#916 |
| 29. | Spottsville | 57.1% | 13.2%(+43.9)#29 | 11.1%(+46.1)#951 |
| 30. | Hardin | 53.8% | 13.2%(+40.6)#30 | 11.1%(+42.8)#1,068 |
| 31. | Blandville | 52.4% | 13.2%(+39.2)#31 | 11.1%(+41.3)#1,113 |
| 32. | Pryorsburg | 51.2% | 13.2%(+38.0)#32 | 11.1%(+40.1)#1,150 |
| 33. | Cave City | 48.0% | 13.2%(+34.8)#33 | 11.1%(+36.9)#1,374 |
| 34. | Whitley City | 45.6% | 13.2%(+32.4)#34 | 11.1%(+34.5)#1,516 |
| 35. | Lynch | 44.7% | 13.2%(+31.5)#35 | 11.1%(+33.7)#1,570 |
| 36. | Silver Grove | 44.3% | 13.2%(+31.1)#36 | 11.1%(+33.2)#1,600 |
| 37. | Crofton | 43.2% | 13.2%(+30.0)#37 | 11.1%(+32.2)#1,661 |
| 38. | Ekron | 42.9% | 13.2%(+29.7)#38 | 11.1%(+31.8)#1,703 |
| 39. | Dixon | 42.3% | 13.2%(+29.1)#39 | 11.1%(+31.2)#1,738 |
| 40. | Burkesville | 42.2% | 13.2%(+29.0)#40 | 11.1%(+31.1)#1,741 |
| 41. | Ludlow | 41.7% | 13.2%(+28.5)#41 | 11.1%(+30.6)#1,781 |
| 42. | Grayson | 40.9% | 13.2%(+27.7)#42 | 11.1%(+29.9)#1,840 |
| 43. | Elk Creek | 40.8% | 13.2%(+27.6)#43 | 11.1%(+29.8)#1,847 |
| 44. | Monticello | 40.7% | 13.2%(+27.5)#44 | 11.1%(+29.7)#1,855 |
| 45. | Dayton | 40.6% | 13.2%(+27.4)#45 | 11.1%(+29.5)#1,863 |
| 46. | Diablock | 40.0% | 13.2%(+26.8)#46 | 11.1%(+28.9)#1,911 |
| 47. | South Williamson | 40.0% | 13.2%(+26.8)#47 | 11.1%(+28.9)#1,918 |
| 48. | Corinth | 40.0% | 13.2%(+26.8)#48 | 11.1%(+28.9)#1,924 |
| 49. | Munfordville | 39.6% | 13.2%(+26.4)#49 | 11.1%(+28.5)#1,986 |
| 50. | Dry Ridge | 39.5% | 13.2%(+26.3)#50 | 11.1%(+28.5)#1,987 |
| 51. | Clarkson | 38.0% | 13.2%(+24.8)#51 | 11.1%(+27.0)#2,121 |
| 52. | Barbourville | 37.7% | 13.2%(+24.5)#52 | 11.1%(+26.6)#2,149 |
| 53. | Fancy Farm | 37.2% | 13.2%(+24.0)#53 | 11.1%(+26.1)#2,213 |
| 54. | Allensville | 37.0% | 13.2%(+23.8)#54 | 11.1%(+26.0)#2,224 |
| 55. | Camargo | 35.7% | 13.2%(+22.5)#55 | 11.1%(+24.6)#2,330 |
| 56. | Bremen | 35.7% | 13.2%(+22.5)#56 | 11.1%(+24.6)#2,336 |
| 57. | Somerset | 35.7% | 13.2%(+22.5)#57 | 11.1%(+24.6)#2,347 |
| 58. | Beattyville | 35.4% | 13.2%(+22.2)#58 | 11.1%(+24.4)#2,365 |
| 59. | Burnside | 35.2% | 13.2%(+22.0)#59 | 11.1%(+24.2)#2,396 |
| 60. | Hazel | 34.8% | 13.2%(+21.6)#60 | 11.1%(+23.7)#2,439 |
| 61. | Dawson Springs | 34.5% | 13.2%(+21.3)#61 | 11.1%(+23.5)#2,459 |
| 62. | Falmouth | 33.9% | 13.2%(+20.7)#62 | 11.1%(+22.8)#2,523 |
| 63. | Powderly | 33.3% | 13.2%(+20.1)#63 | 11.1%(+22.3)#2,586 |
| 64. | Nebo | 31.8% | 13.2%(+18.6)#64 | 11.1%(+20.8)#2,870 |
| 65. | Liberty | 31.7% | 13.2%(+18.5)#65 | 11.1%(+20.6)#2,881 |
| 66. | Evarts | 31.6% | 13.2%(+18.4)#66 | 11.1%(+20.5)#2,892 |
| 67. | Cloverport | 31.4% | 13.2%(+18.2)#67 | 11.1%(+20.4)#2,909 |
| 68. | Brooksville | 31.2% | 13.2%(+18.1)#68 | 11.1%(+20.2)#2,926 |
| 69. | Mckee | 31.1% | 13.2%(+17.9)#69 | 11.1%(+20.0)#2,949 |
| 70. | White Plains | 30.8% | 13.2%(+17.6)#70 | 11.1%(+19.7)#2,986 |
| 71. | Kenton Vale | 30.8% | 13.2%(+17.6)#71 | 11.1%(+19.7)#3,003 |
| 72. | Carrollton | 30.6% | 13.2%(+17.4)#72 | 11.1%(+19.6)#3,017 |
| 73. | Eubank | 30.0% | 13.2%(+16.8)#73 | 11.1%(+18.9)#3,116 |
| 74. | Bonnieville | 30.0% | 13.2%(+16.8)#74 | 11.1%(+18.9)#3,130 |
| 75. | Mortons Gap | 29.7% | 13.2%(+16.5)#75 | 11.1%(+18.7)#3,176 |
| 76. | Cynthiana | 29.5% | 13.2%(+16.3)#76 | 11.1%(+18.4)#3,209 |
| 77. | Crab Orchard | 29.4% | 13.2%(+16.2)#77 | 11.1%(+18.3)#3,225 |
| 78. | Stanley | 28.8% | 13.2%(+15.6)#78 | 11.1%(+17.7)#3,311 |
| 79. | Vanceburg | 28.7% | 13.2%(+15.5)#79 | 11.1%(+17.6)#3,325 |
| 80. | Springfield | 28.2% | 13.2%(+15.0)#80 | 11.1%(+17.1)#3,427 |
| 81. | Harrodsburg | 28.2% | 13.2%(+15.0)#81 | 11.1%(+17.1)#3,433 |
| 82. | Farley | 27.9% | 13.2%(+14.7)#82 | 11.1%(+16.8)#3,480 |
| 83. | Brodhead | 27.9% | 13.2%(+14.7)#83 | 11.1%(+16.8)#3,485 |
| 84. | Wallins Creek | 27.8% | 13.2%(+14.6)#84 | 11.1%(+16.7)#3,502 |
| 85. | Morehead | 27.4% | 13.2%(+14.2)#85 | 11.1%(+16.4)#3,559 |
| 86. | Science Hill | 27.3% | 13.2%(+14.1)#86 | 11.1%(+16.2)#3,585 |
| 87. | Fincastle | 27.3% | 13.2%(+14.1)#87 | 11.1%(+16.2)#3,587 |
| 88. | Lafayette | 27.3% | 13.2%(+14.1)#88 | 11.1%(+16.2)#3,608 |
| 89. | Lewisport | 27.2% | 13.2%(+14.0)#89 | 11.1%(+16.1)#3,624 |
| 90. | Vine Grove | 27.1% | 13.2%(+13.9)#90 | 11.1%(+16.0)#3,650 |
| 91. | Goshen | 26.9% | 13.2%(+13.7)#91 | 11.1%(+15.9)#3,674 |
| 92. | Albany | 26.8% | 13.2%(+13.6)#92 | 11.1%(+15.7)#3,702 |
| 93. | Highland Heights | 26.6% | 13.2%(+13.4)#93 | 11.1%(+15.5)#3,741 |
| 94. | Russell Springs | 26.5% | 13.2%(+13.3)#94 | 11.1%(+15.5)#3,748 |
| 95. | Greensburg | 26.2% | 13.2%(+13.0)#95 | 11.1%(+15.1)#3,827 |
| 96. | Sandy Hook | 25.9% | 13.2%(+12.7)#96 | 11.1%(+14.8)#3,905 |
| 97. | Adairville | 25.8% | 13.2%(+12.6)#97 | 11.1%(+14.7)#3,922 |
| 98. | Paintsville | 25.7% | 13.2%(+12.5)#98 | 11.1%(+14.6)#3,953 |
| 99. | Stanton | 25.7% | 13.2%(+12.5)#99 | 11.1%(+14.6)#3,954 |
| 100. | Mount Vernon | 25.3% | 13.2%(+12.1)#100 | 11.1%(+14.2)#4,021 |
Common Questions
What are the Top 10 Cities with the Highest Poverty Level Among Seniors Over the Age of 75 in Kentucky?
Top 10 Cities with the Highest Poverty Level Among Seniors Over the Age of 75 in Kentucky are:
#1
100.0%
#2
100.0%
#3
100.0%
#4
100.0%
#5
100.0%
#6
100.0%
#7
100.0%
#8
100.0%
#9
100.0%
#10
100.0%
What city has the Highest Poverty Level Among Seniors Over the Age of 75 in Kentucky?
Breckinridge Center has the Highest Poverty Level Among Seniors Over the Age of 75 in Kentucky with 100.0%.
What is the Poverty Level Among Seniors Over the Age of 75 in the State of Kentucky?
Poverty Level Among Seniors Over the Age of 75 in Kentucky is 13.2%.
What is the Poverty Level Among Seniors Over the Age of 75 in the United States?
Poverty Level Among Seniors Over the Age of 75 in the United States is 11.1%.