Cities with the Highest Poverty Level Among Seniors Over the Age of 75 in Iowa
RELATED REPORTS & OPTIONS
Highest Poverty | Seniors 75+
Iowa
Compare Cities
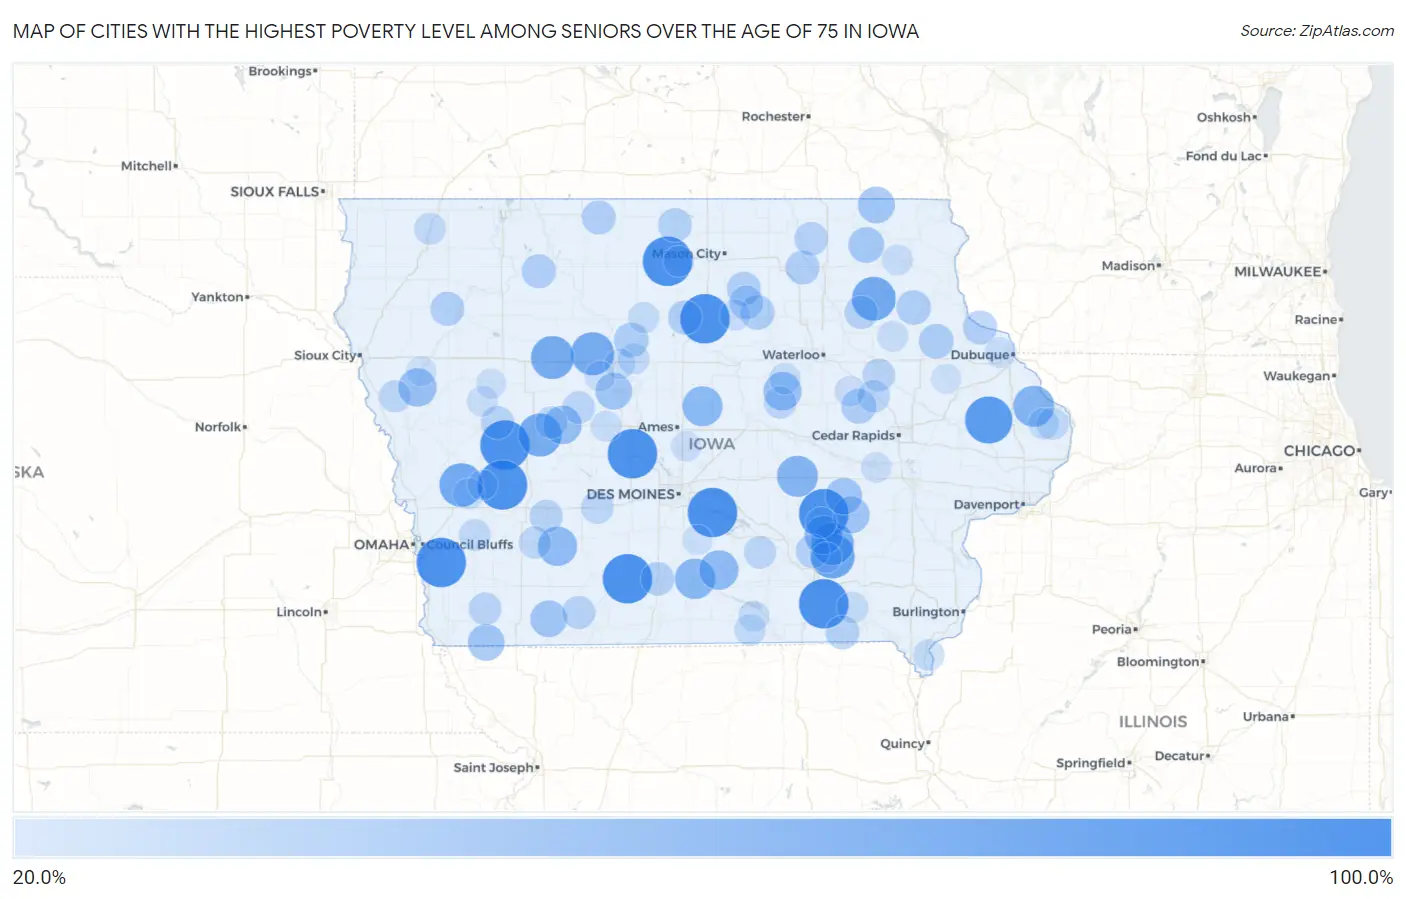
Map of Cities with the Highest Poverty Level Among Seniors Over the Age of 75 in Iowa
0.0%
100.0%
Cities with the Highest Poverty Level Among Seniors Over the Age of 75 in Iowa
| City | Senior Poverty | vs State | vs National | |
| 1. | Coulter | 100.0% | 9.3%(+90.7)#1 | 11.1%(+88.9)#174 |
| 2. | Bouton | 100.0% | 9.3%(+90.7)#2 | 11.1%(+88.9)#197 |
| 3. | Floris | 100.0% | 9.3%(+90.7)#3 | 11.1%(+88.9)#208 |
| 4. | Duncan | 100.0% | 9.3%(+90.7)#4 | 11.1%(+88.9)#271 |
| 5. | Swan | 100.0% | 9.3%(+90.7)#5 | 11.1%(+88.9)#307 |
| 6. | Thornburg | 100.0% | 9.3%(+90.7)#6 | 11.1%(+88.9)#308 |
| 7. | Thayer | 100.0% | 9.3%(+90.7)#7 | 11.1%(+88.9)#339 |
| 8. | Aspinwall | 100.0% | 9.3%(+90.7)#8 | 11.1%(+88.9)#366 |
| 9. | Mineola | 100.0% | 9.3%(+90.7)#9 | 11.1%(+88.9)#370 |
| 10. | Jacksonville | 100.0% | 9.3%(+90.7)#10 | 11.1%(+88.9)#398 |
| 11. | Monmouth | 90.9% | 9.3%(+81.6)#11 | 11.1%(+79.8)#420 |
| 12. | Martinsburg | 80.0% | 9.3%(+70.7)#12 | 11.1%(+68.9)#495 |
| 13. | Randalia | 77.8% | 9.3%(+68.4)#13 | 11.1%(+66.7)#521 |
| 14. | Portsmouth | 76.9% | 9.3%(+67.6)#14 | 11.1%(+65.9)#529 |
| 15. | Fairport | 76.2% | 9.3%(+66.9)#15 | 11.1%(+65.1)#540 |
| 16. | Barnum | 75.0% | 9.3%(+65.7)#16 | 11.1%(+63.9)#557 |
| 17. | Willey | 75.0% | 9.3%(+65.7)#17 | 11.1%(+63.9)#563 |
| 18. | Jolley | 75.0% | 9.3%(+65.7)#18 | 11.1%(+63.9)#572 |
| 19. | Hayesville | 73.7% | 9.3%(+64.3)#19 | 11.1%(+62.6)#582 |
| 20. | Malcom | 66.7% | 9.3%(+57.3)#20 | 11.1%(+55.6)#682 |
| 21. | Springbrook | 66.7% | 9.3%(+57.3)#21 | 11.1%(+55.6)#694 |
| 22. | Lucas | 64.3% | 9.3%(+54.9)#22 | 11.1%(+53.2)#731 |
| 23. | Mccallsburg | 62.5% | 9.3%(+53.2)#23 | 11.1%(+51.4)#770 |
| 24. | Williamson | 60.0% | 9.3%(+50.7)#24 | 11.1%(+48.9)#857 |
| 25. | Bridgewater | 60.0% | 9.3%(+50.7)#25 | 11.1%(+48.9)#860 |
| 26. | Delta | 57.1% | 9.3%(+47.8)#26 | 11.1%(+46.1)#944 |
| 27. | Ralston | 57.1% | 9.3%(+47.8)#27 | 11.1%(+46.1)#955 |
| 28. | Lincoln | 55.6% | 9.3%(+46.2)#28 | 11.1%(+44.5)#1,006 |
| 29. | Oto | 55.6% | 9.3%(+46.2)#29 | 11.1%(+44.5)#1,009 |
| 30. | South English | 50.0% | 9.3%(+40.7)#30 | 11.1%(+38.9)#1,229 |
| 31. | Burr Oak | 50.0% | 9.3%(+40.7)#31 | 11.1%(+38.9)#1,233 |
| 32. | Harcourt | 50.0% | 9.3%(+40.7)#32 | 11.1%(+38.9)#1,245 |
| 33. | Gravity | 50.0% | 9.3%(+40.7)#33 | 11.1%(+38.9)#1,252 |
| 34. | Millersburg | 50.0% | 9.3%(+40.7)#34 | 11.1%(+38.9)#1,256 |
| 35. | Sperry | 50.0% | 9.3%(+40.7)#35 | 11.1%(+38.9)#1,281 |
| 36. | Northboro | 50.0% | 9.3%(+40.7)#36 | 11.1%(+38.9)#1,282 |
| 37. | Spillville | 46.8% | 9.3%(+37.4)#37 | 11.1%(+35.7)#1,448 |
| 38. | Vinton | 43.0% | 9.3%(+33.7)#38 | 11.1%(+31.9)#1,671 |
| 39. | Greeley | 42.9% | 9.3%(+33.5)#39 | 11.1%(+31.8)#1,699 |
| 40. | Vincent | 42.9% | 9.3%(+33.5)#40 | 11.1%(+31.8)#1,709 |
| 41. | Volga | 42.1% | 9.3%(+32.8)#41 | 11.1%(+31.0)#1,754 |
| 42. | Bristow | 41.7% | 9.3%(+32.3)#42 | 11.1%(+30.6)#1,798 |
| 43. | Swea City | 40.0% | 9.3%(+30.7)#43 | 11.1%(+28.9)#1,902 |
| 44. | Ayrshire | 40.0% | 9.3%(+30.7)#44 | 11.1%(+28.9)#1,937 |
| 45. | Rowan | 40.0% | 9.3%(+30.7)#45 | 11.1%(+28.9)#1,940 |
| 46. | Meriden | 40.0% | 9.3%(+30.7)#46 | 11.1%(+28.9)#1,947 |
| 47. | North Buena Vista | 40.0% | 9.3%(+30.7)#47 | 11.1%(+28.9)#1,949 |
| 48. | Dougherty | 40.0% | 9.3%(+30.7)#48 | 11.1%(+28.9)#1,958 |
| 49. | Aredale | 40.0% | 9.3%(+30.7)#49 | 11.1%(+28.9)#1,962 |
| 50. | Bassett | 40.0% | 9.3%(+30.7)#50 | 11.1%(+28.9)#1,964 |
| 51. | Leland | 38.9% | 9.3%(+29.5)#51 | 11.1%(+27.8)#2,040 |
| 52. | Milton | 38.7% | 9.3%(+29.4)#52 | 11.1%(+27.6)#2,051 |
| 53. | Osceola | 38.7% | 9.3%(+29.4)#53 | 11.1%(+27.6)#2,053 |
| 54. | Fremont | 38.6% | 9.3%(+29.3)#54 | 11.1%(+27.6)#2,058 |
| 55. | Elma | 38.0% | 9.3%(+28.7)#55 | 11.1%(+27.0)#2,122 |
| 56. | Westgate | 37.5% | 9.3%(+28.2)#56 | 11.1%(+26.4)#2,176 |
| 57. | Anita | 36.9% | 9.3%(+27.6)#57 | 11.1%(+25.9)#2,228 |
| 58. | Clearfield | 36.7% | 9.3%(+27.3)#58 | 11.1%(+25.6)#2,250 |
| 59. | Vail | 36.4% | 9.3%(+27.0)#59 | 11.1%(+25.3)#2,276 |
| 60. | Rowley | 35.3% | 9.3%(+26.0)#60 | 11.1%(+24.2)#2,384 |
| 61. | Essex | 35.2% | 9.3%(+25.9)#61 | 11.1%(+24.2)#2,393 |
| 62. | Stuart | 34.9% | 9.3%(+25.5)#62 | 11.1%(+23.8)#2,429 |
| 63. | Urbana | 34.8% | 9.3%(+25.4)#63 | 11.1%(+23.7)#2,436 |
| 64. | Gladbrook | 34.5% | 9.3%(+25.2)#64 | 11.1%(+23.5)#2,458 |
| 65. | Churdan | 34.2% | 9.3%(+24.9)#65 | 11.1%(+23.1)#2,494 |
| 66. | Glidden | 33.3% | 9.3%(+24.0)#66 | 11.1%(+22.3)#2,581 |
| 67. | Bussey | 33.3% | 9.3%(+24.0)#67 | 11.1%(+22.3)#2,615 |
| 68. | Hornick | 33.3% | 9.3%(+24.0)#68 | 11.1%(+22.3)#2,631 |
| 69. | Cumberland | 33.3% | 9.3%(+24.0)#69 | 11.1%(+22.3)#2,634 |
| 70. | Miles | 32.4% | 9.3%(+23.0)#70 | 11.1%(+21.3)#2,800 |
| 71. | Oakland | 32.2% | 9.3%(+22.8)#71 | 11.1%(+21.1)#2,819 |
| 72. | Ashton | 32.0% | 9.3%(+22.7)#72 | 11.1%(+20.9)#2,843 |
| 73. | Morrison | 30.8% | 9.3%(+21.4)#73 | 11.1%(+19.7)#3,005 |
| 74. | Douds | 30.8% | 9.3%(+21.4)#74 | 11.1%(+19.7)#3,006 |
| 75. | Numa | 30.8% | 9.3%(+21.4)#75 | 11.1%(+19.7)#3,008 |
| 76. | Duncombe | 30.4% | 9.3%(+21.1)#76 | 11.1%(+19.4)#3,052 |
| 77. | Montrose | 30.2% | 9.3%(+20.8)#77 | 11.1%(+19.1)#3,082 |
| 78. | Preston | 30.0% | 9.3%(+20.7)#78 | 11.1%(+18.9)#3,107 |
| 79. | Goldfield | 30.0% | 9.3%(+20.7)#79 | 11.1%(+18.9)#3,109 |
| 80. | Tennant | 30.0% | 9.3%(+20.7)#80 | 11.1%(+18.9)#3,148 |
| 81. | Grand Junction | 28.6% | 9.3%(+19.2)#81 | 11.1%(+17.5)#3,344 |
| 82. | Mystic | 28.6% | 9.3%(+19.2)#82 | 11.1%(+17.5)#3,353 |
| 83. | Aurora | 28.6% | 9.3%(+19.2)#83 | 11.1%(+17.5)#3,368 |
| 84. | Castalia | 28.6% | 9.3%(+19.2)#84 | 11.1%(+17.5)#3,372 |
| 85. | Hansell | 28.6% | 9.3%(+19.2)#85 | 11.1%(+17.5)#3,378 |
| 86. | Garner | 28.3% | 9.3%(+19.0)#86 | 11.1%(+17.3)#3,409 |
| 87. | What Cheer | 28.0% | 9.3%(+18.7)#87 | 11.1%(+16.9)#3,459 |
| 88. | Kiron | 28.0% | 9.3%(+18.7)#88 | 11.1%(+16.9)#3,466 |
| 89. | Coalville | 27.5% | 9.3%(+18.1)#89 | 11.1%(+16.4)#3,556 |
| 90. | Mount Auburn | 27.3% | 9.3%(+17.9)#90 | 11.1%(+16.2)#3,611 |
| 91. | Homestead | 27.3% | 9.3%(+17.9)#91 | 11.1%(+16.2)#3,612 |
| 92. | Cambridge | 27.1% | 9.3%(+17.7)#92 | 11.1%(+16.0)#3,644 |
| 93. | Hedrick | 27.1% | 9.3%(+17.7)#93 | 11.1%(+16.0)#3,646 |
| 94. | Callender | 26.5% | 9.3%(+17.1)#94 | 11.1%(+15.4)#3,764 |
| 95. | Asbury | 26.4% | 9.3%(+17.1)#95 | 11.1%(+15.4)#3,770 |
| 96. | Anthon | 26.3% | 9.3%(+17.0)#96 | 11.1%(+15.2)#3,798 |
| 97. | Odebolt | 26.3% | 9.3%(+16.9)#97 | 11.1%(+15.2)#3,817 |
| 98. | Harlan | 26.0% | 9.3%(+16.6)#98 | 11.1%(+14.9)#3,886 |
| 99. | Milo | 25.8% | 9.3%(+16.5)#99 | 11.1%(+14.7)#3,921 |
| 100. | Hopkinton | 25.7% | 9.3%(+16.4)#100 | 11.1%(+14.6)#3,940 |
Common Questions
What are the Top 10 Cities with the Highest Poverty Level Among Seniors Over the Age of 75 in Iowa?
Top 10 Cities with the Highest Poverty Level Among Seniors Over the Age of 75 in Iowa are:
What city has the Highest Poverty Level Among Seniors Over the Age of 75 in Iowa?
Coulter has the Highest Poverty Level Among Seniors Over the Age of 75 in Iowa with 100.0%.
What is the Poverty Level Among Seniors Over the Age of 75 in the State of Iowa?
Poverty Level Among Seniors Over the Age of 75 in Iowa is 9.3%.
What is the Poverty Level Among Seniors Over the Age of 75 in the United States?
Poverty Level Among Seniors Over the Age of 75 in the United States is 11.1%.