Cities with the Highest Poverty Level Among Seniors Over the Age of 75 in Illinois
RELATED REPORTS & OPTIONS
Highest Poverty | Seniors 75+
Illinois
Compare Cities
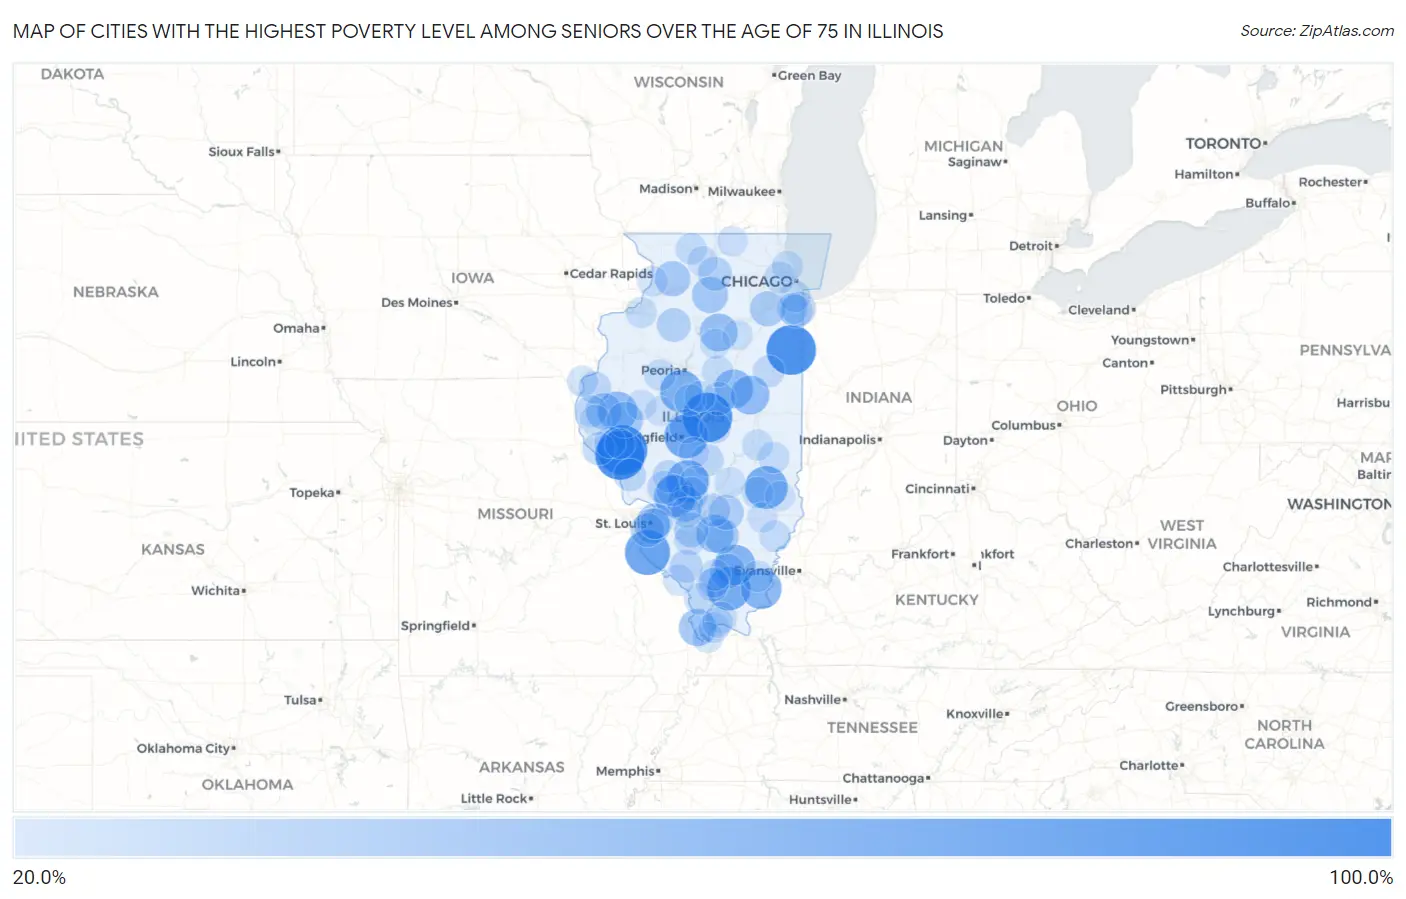
Map of Cities with the Highest Poverty Level Among Seniors Over the Age of 75 in Illinois
0.0%
100.0%
Cities with the Highest Poverty Level Among Seniors Over the Age of 75 in Illinois
| City | Senior Poverty | vs State | vs National | |
| 1. | Chestnut | 100.0% | 10.4%(+89.6)#1 | 11.1%(+88.9)#195 |
| 2. | Papineau | 100.0% | 10.4%(+89.6)#2 | 11.1%(+88.9)#227 |
| 3. | Millersburg | 100.0% | 10.4%(+89.6)#3 | 11.1%(+88.9)#299 |
| 4. | Illinois | 100.0% | 10.4%(+89.6)#4 | 11.1%(+88.9)#349 |
| 5. | Detroit | 100.0% | 10.4%(+89.6)#5 | 11.1%(+88.9)#369 |
| 6. | Time | 100.0% | 10.4%(+89.6)#6 | 11.1%(+88.9)#382 |
| 7. | Niota | 100.0% | 10.4%(+89.6)#7 | 11.1%(+88.9)#384 |
| 8. | Maeystown | 83.3% | 10.4%(+72.9)#8 | 11.1%(+72.3)#465 |
| 9. | Clear Lake | 78.6% | 10.4%(+68.2)#9 | 11.1%(+67.5)#509 |
| 10. | Crab Orchard | 76.2% | 10.4%(+65.8)#10 | 11.1%(+65.1)#539 |
| 11. | Rose Hill | 75.0% | 10.4%(+64.6)#11 | 11.1%(+63.9)#570 |
| 12. | Green Valley | 72.7% | 10.4%(+62.3)#12 | 11.1%(+61.7)#589 |
| 13. | Butler | 72.2% | 10.4%(+61.8)#13 | 11.1%(+61.2)#598 |
| 14. | Williamson | 70.6% | 10.4%(+60.2)#14 | 11.1%(+59.5)#615 |
| 15. | Junction | 66.7% | 10.4%(+56.3)#15 | 11.1%(+55.6)#708 |
| 16. | Macedonia | 66.7% | 10.4%(+56.3)#16 | 11.1%(+55.6)#712 |
| 17. | Camden | 61.5% | 10.4%(+51.1)#17 | 11.1%(+50.5)#808 |
| 18. | Ellsworth | 60.0% | 10.4%(+49.6)#18 | 11.1%(+48.9)#850 |
| 19. | Foosland | 60.0% | 10.4%(+49.6)#19 | 11.1%(+48.9)#867 |
| 20. | Leonore | 56.5% | 10.4%(+46.1)#20 | 11.1%(+45.5)#969 |
| 21. | Walnut Hill | 55.6% | 10.4%(+45.1)#21 | 11.1%(+44.5)#1,005 |
| 22. | Olive Branch | 54.3% | 10.4%(+43.9)#22 | 11.1%(+43.3)#1,053 |
| 23. | West Brooklyn | 50.0% | 10.4%(+39.6)#23 | 11.1%(+38.9)#1,257 |
| 24. | Old Ripley | 50.0% | 10.4%(+39.6)#24 | 11.1%(+38.9)#1,284 |
| 25. | La Prairie | 50.0% | 10.4%(+39.6)#25 | 11.1%(+38.9)#1,303 |
| 26. | Ripley | 50.0% | 10.4%(+39.6)#26 | 11.1%(+38.9)#1,310 |
| 27. | Fairmont City | 48.7% | 10.4%(+38.3)#27 | 11.1%(+37.6)#1,346 |
| 28. | Sauget | 47.6% | 10.4%(+37.2)#28 | 11.1%(+36.6)#1,397 |
| 29. | Coleta | 47.6% | 10.4%(+37.2)#29 | 11.1%(+36.6)#1,398 |
| 30. | Dix | 46.4% | 10.4%(+36.0)#30 | 11.1%(+35.4)#1,474 |
| 31. | Rockdale | 46.2% | 10.4%(+35.7)#31 | 11.1%(+35.1)#1,484 |
| 32. | Custer Park | 46.2% | 10.4%(+35.7)#32 | 11.1%(+35.1)#1,489 |
| 33. | Kinmundy | 45.6% | 10.4%(+35.2)#33 | 11.1%(+34.5)#1,514 |
| 34. | Hanaford | 45.5% | 10.4%(+35.0)#34 | 11.1%(+34.4)#1,529 |
| 35. | Bartelso | 44.6% | 10.4%(+34.2)#35 | 11.1%(+33.5)#1,576 |
| 36. | Williamsville | 42.5% | 10.4%(+32.1)#36 | 11.1%(+31.4)#1,730 |
| 37. | Ford Heights | 42.1% | 10.4%(+31.7)#37 | 11.1%(+31.1)#1,744 |
| 38. | East Carondelet | 42.1% | 10.4%(+31.7)#38 | 11.1%(+31.0)#1,753 |
| 39. | Hillcrest | 41.7% | 10.4%(+31.3)#39 | 11.1%(+30.6)#1,783 |
| 40. | Neponset | 41.7% | 10.4%(+31.3)#40 | 11.1%(+30.6)#1,785 |
| 41. | Heyworth | 40.0% | 10.4%(+29.6)#41 | 11.1%(+28.9)#1,896 |
| 42. | Donnellson | 40.0% | 10.4%(+29.6)#42 | 11.1%(+28.9)#1,938 |
| 43. | Moro | 38.6% | 10.4%(+28.2)#43 | 11.1%(+27.6)#2,059 |
| 44. | Arbury Hills | 38.5% | 10.4%(+28.1)#44 | 11.1%(+27.4)#2,067 |
| 45. | Vernon | 38.5% | 10.4%(+28.1)#45 | 11.1%(+27.4)#2,087 |
| 46. | South Chicago Heights | 38.3% | 10.4%(+27.9)#46 | 11.1%(+27.2)#2,098 |
| 47. | Cutler | 38.1% | 10.4%(+27.7)#47 | 11.1%(+27.0)#2,113 |
| 48. | New Canton | 38.1% | 10.4%(+27.7)#48 | 11.1%(+27.0)#2,115 |
| 49. | Royal Lakes | 37.5% | 10.4%(+27.1)#49 | 11.1%(+26.4)#2,173 |
| 50. | Eldred | 37.0% | 10.4%(+26.6)#50 | 11.1%(+26.0)#2,223 |
| 51. | Carterville | 36.8% | 10.4%(+26.4)#51 | 11.1%(+25.7)#2,242 |
| 52. | Owaneco | 36.4% | 10.4%(+26.0)#52 | 11.1%(+25.3)#2,273 |
| 53. | Ferris | 35.7% | 10.4%(+25.3)#53 | 11.1%(+24.6)#2,344 |
| 54. | Carlinville | 35.7% | 10.4%(+25.3)#54 | 11.1%(+24.6)#2,348 |
| 55. | Warrensburg | 35.3% | 10.4%(+24.9)#55 | 11.1%(+24.2)#2,376 |
| 56. | Loraine | 35.0% | 10.4%(+24.6)#56 | 11.1%(+23.9)#2,417 |
| 57. | Sawyerville | 35.0% | 10.4%(+24.6)#57 | 11.1%(+23.9)#2,420 |
| 58. | Alto Pass | 34.8% | 10.4%(+24.4)#58 | 11.1%(+23.7)#2,440 |
| 59. | Thawville | 34.4% | 10.4%(+24.0)#59 | 11.1%(+23.3)#2,477 |
| 60. | Calumet Park | 34.0% | 10.4%(+23.6)#60 | 11.1%(+22.9)#2,511 |
| 61. | Northlake | 33.5% | 10.4%(+23.0)#61 | 11.1%(+22.4)#2,555 |
| 62. | Olympia Fields | 33.4% | 10.4%(+23.0)#62 | 11.1%(+22.3)#2,557 |
| 63. | Ashmore | 33.3% | 10.4%(+22.9)#63 | 11.1%(+22.3)#2,589 |
| 64. | Emden | 33.3% | 10.4%(+22.9)#64 | 11.1%(+22.3)#2,621 |
| 65. | Norris | 33.3% | 10.4%(+22.9)#65 | 11.1%(+22.3)#2,637 |
| 66. | Omaha | 33.3% | 10.4%(+22.9)#66 | 11.1%(+22.3)#2,645 |
| 67. | Bone Gap | 33.3% | 10.4%(+22.9)#67 | 11.1%(+22.3)#2,665 |
| 68. | Kappa | 33.3% | 10.4%(+22.9)#68 | 11.1%(+22.3)#2,666 |
| 69. | Baylis | 33.3% | 10.4%(+22.9)#69 | 11.1%(+22.3)#2,683 |
| 70. | Belknap | 33.3% | 10.4%(+22.9)#70 | 11.1%(+22.3)#2,684 |
| 71. | Ridott | 33.3% | 10.4%(+22.9)#71 | 11.1%(+22.3)#2,685 |
| 72. | Wheeler | 33.3% | 10.4%(+22.9)#72 | 11.1%(+22.3)#2,690 |
| 73. | Rockwood | 33.3% | 10.4%(+22.9)#73 | 11.1%(+22.3)#2,730 |
| 74. | Zeigler | 32.7% | 10.4%(+22.3)#74 | 11.1%(+21.6)#2,769 |
| 75. | Colona | 32.2% | 10.4%(+21.8)#75 | 11.1%(+21.1)#2,816 |
| 76. | Arcola | 32.1% | 10.4%(+21.7)#76 | 11.1%(+21.0)#2,833 |
| 77. | Golf | 32.1% | 10.4%(+21.7)#77 | 11.1%(+21.0)#2,834 |
| 78. | Nauvoo | 32.0% | 10.4%(+21.6)#78 | 11.1%(+21.0)#2,836 |
| 79. | Addieville | 31.8% | 10.4%(+21.4)#79 | 11.1%(+20.8)#2,864 |
| 80. | Armington | 31.6% | 10.4%(+21.2)#80 | 11.1%(+20.5)#2,894 |
| 81. | Fulton | 31.1% | 10.4%(+20.7)#81 | 11.1%(+20.1)#2,947 |
| 82. | Cairo | 31.0% | 10.4%(+20.6)#82 | 11.1%(+19.9)#2,964 |
| 83. | Olmsted | 31.0% | 10.4%(+20.5)#83 | 11.1%(+19.9)#2,969 |
| 84. | Pierron | 30.8% | 10.4%(+20.4)#84 | 11.1%(+19.7)#2,991 |
| 85. | Coatsburg | 30.8% | 10.4%(+20.4)#85 | 11.1%(+19.7)#2,999 |
| 86. | New Grand Chain | 30.8% | 10.4%(+20.4)#86 | 11.1%(+19.7)#3,004 |
| 87. | Beecher City | 30.4% | 10.4%(+20.0)#87 | 11.1%(+19.4)#3,050 |
| 88. | East St Louis | 30.2% | 10.4%(+19.8)#88 | 11.1%(+19.1)#3,079 |
| 89. | Astoria | 30.2% | 10.4%(+19.7)#89 | 11.1%(+19.1)#3,085 |
| 90. | Ransom | 30.0% | 10.4%(+19.6)#90 | 11.1%(+18.9)#3,127 |
| 91. | Bulpitt | 30.0% | 10.4%(+19.6)#91 | 11.1%(+18.9)#3,131 |
| 92. | Byron | 29.8% | 10.4%(+19.4)#92 | 11.1%(+18.8)#3,160 |
| 93. | Capron | 29.7% | 10.4%(+19.3)#93 | 11.1%(+18.7)#3,174 |
| 94. | Griggsville | 29.5% | 10.4%(+19.1)#94 | 11.1%(+18.4)#3,210 |
| 95. | Irving | 29.4% | 10.4%(+19.0)#95 | 11.1%(+18.3)#3,233 |
| 96. | Colp | 29.4% | 10.4%(+19.0)#96 | 11.1%(+18.3)#3,236 |
| 97. | Wenona | 29.3% | 10.4%(+18.9)#97 | 11.1%(+18.3)#3,247 |
| 98. | Noble | 29.2% | 10.4%(+18.8)#98 | 11.1%(+18.2)#3,258 |
| 99. | Oblong | 29.0% | 10.4%(+18.6)#99 | 11.1%(+17.9)#3,289 |
| 100. | Kilbourne | 28.6% | 10.4%(+18.2)#100 | 11.1%(+17.5)#3,357 |
Common Questions
What are the Top 10 Cities with the Highest Poverty Level Among Seniors Over the Age of 75 in Illinois?
Top 10 Cities with the Highest Poverty Level Among Seniors Over the Age of 75 in Illinois are:
#1
100.0%
#2
100.0%
#3
100.0%
#4
100.0%
#5
83.3%
#6
78.6%
#7
76.2%
#8
75.0%
#9
72.7%
#10
72.2%
What city has the Highest Poverty Level Among Seniors Over the Age of 75 in Illinois?
Chestnut has the Highest Poverty Level Among Seniors Over the Age of 75 in Illinois with 100.0%.
What is the Poverty Level Among Seniors Over the Age of 75 in the State of Illinois?
Poverty Level Among Seniors Over the Age of 75 in Illinois is 10.4%.
What is the Poverty Level Among Seniors Over the Age of 75 in the United States?
Poverty Level Among Seniors Over the Age of 75 in the United States is 11.1%.