Cities with the Highest Poverty Level Among Seniors Over the Age of 75 in North Dakota
RELATED REPORTS & OPTIONS
Highest Poverty | Seniors 75+
North Dakota
Compare Cities
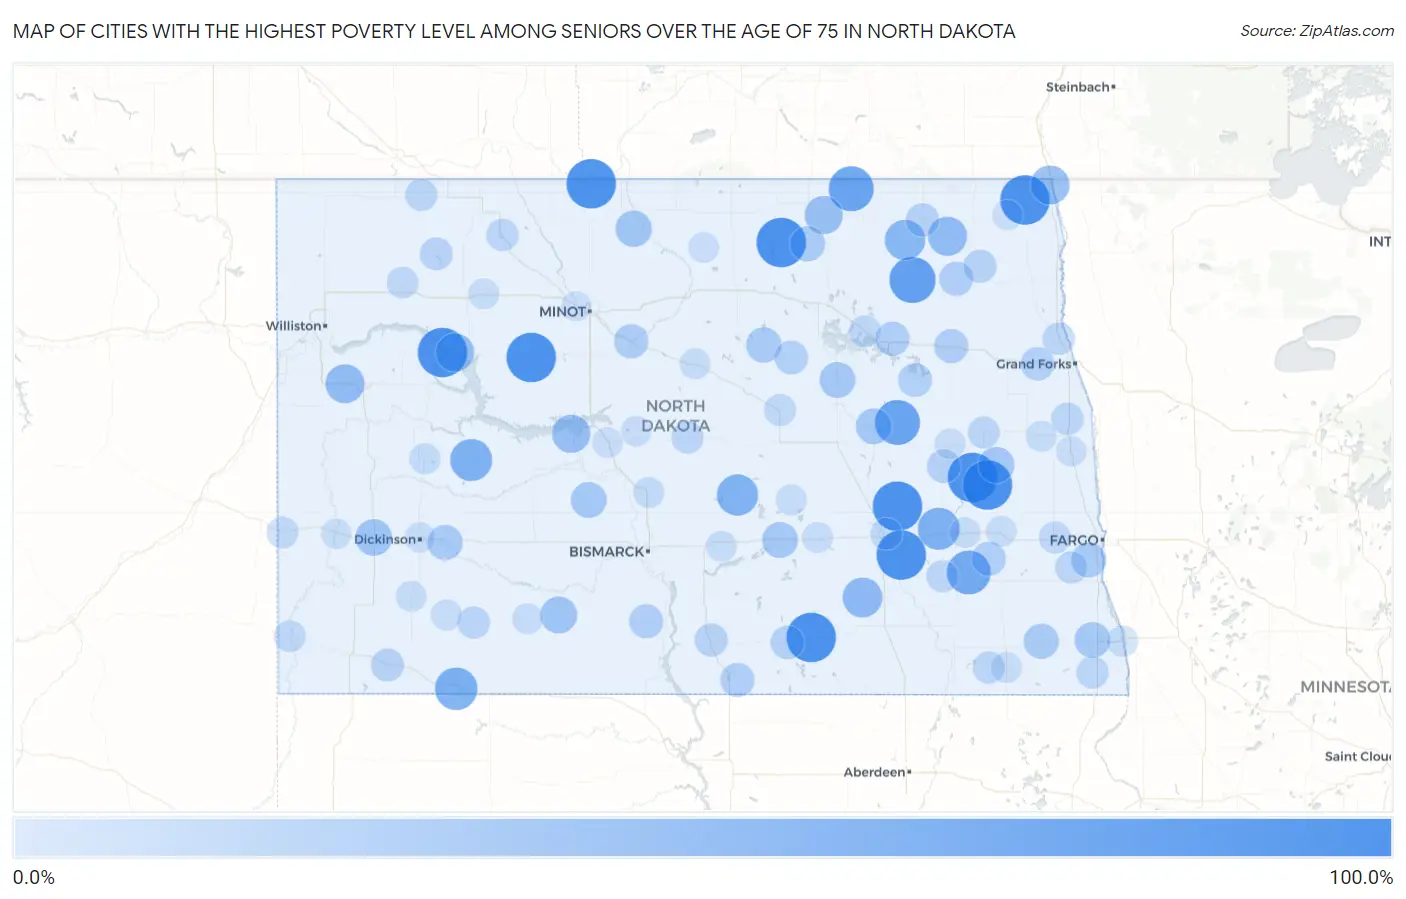
Map of Cities with the Highest Poverty Level Among Seniors Over the Age of 75 in North Dakota
0.0%
100.0%
Cities with the Highest Poverty Level Among Seniors Over the Age of 75 in North Dakota
| City | Senior Poverty | vs State | vs National | |
| 1. | Four Bears Village | 100.0% | 11.9%(+88.1)#1 | 11.1%(+88.9)#152 |
| 2. | Spiritwood Lake | 100.0% | 11.9%(+88.1)#2 | 11.1%(+88.9)#202 |
| 3. | Makoti | 100.0% | 11.9%(+88.1)#3 | 11.1%(+88.9)#263 |
| 4. | Lehr | 100.0% | 11.9%(+88.1)#4 | 11.1%(+88.9)#286 |
| 5. | Bathgate | 100.0% | 11.9%(+88.1)#5 | 11.1%(+88.9)#329 |
| 6. | Luverne | 100.0% | 11.9%(+88.1)#6 | 11.1%(+88.9)#362 |
| 7. | Antler | 100.0% | 11.9%(+88.1)#7 | 11.1%(+88.9)#385 |
| 8. | Mylo | 100.0% | 11.9%(+88.1)#8 | 11.1%(+88.9)#388 |
| 9. | Pillsbury | 100.0% | 11.9%(+88.1)#9 | 11.1%(+88.9)#392 |
| 10. | Ypsilanti | 100.0% | 11.9%(+88.1)#10 | 11.1%(+88.9)#393 |
| 11. | Edmore | 85.2% | 11.9%(+73.3)#11 | 11.1%(+74.2)#449 |
| 12. | Mchenry | 80.0% | 11.9%(+68.1)#12 | 11.1%(+68.9)#497 |
| 13. | Sarles | 80.0% | 11.9%(+68.1)#13 | 11.1%(+68.9)#498 |
| 14. | Kathryn | 75.0% | 11.9%(+63.1)#14 | 11.1%(+63.9)#566 |
| 15. | Haynes | 69.2% | 11.9%(+57.3)#15 | 11.1%(+58.2)#638 |
| 16. | Halliday | 66.7% | 11.9%(+54.8)#16 | 11.1%(+55.6)#677 |
| 17. | Sanborn | 66.7% | 11.9%(+54.8)#17 | 11.1%(+55.6)#695 |
| 18. | Tuttle | 63.6% | 11.9%(+51.7)#18 | 11.1%(+52.6)#746 |
| 19. | Loma | 60.0% | 11.9%(+48.1)#19 | 11.1%(+48.9)#870 |
| 20. | Jud | 57.1% | 11.9%(+45.2)#20 | 11.1%(+46.1)#956 |
| 21. | Osnabrock | 54.5% | 11.9%(+42.6)#21 | 11.1%(+43.5)#1,045 |
| 22. | Pembina | 54.0% | 11.9%(+42.1)#22 | 11.1%(+42.9)#1,062 |
| 23. | Arnegard | 53.8% | 11.9%(+41.9)#23 | 11.1%(+42.8)#1,070 |
| 24. | New Town | 51.5% | 11.9%(+39.6)#24 | 11.1%(+40.4)#1,135 |
| 25. | Rocklake | 50.0% | 11.9%(+38.1)#25 | 11.1%(+38.9)#1,277 |
| 26. | Pick City | 50.0% | 11.9%(+38.1)#26 | 11.1%(+38.9)#1,278 |
| 27. | Carson | 45.0% | 11.9%(+33.1)#27 | 11.1%(+33.9)#1,558 |
| 28. | Belfield | 43.8% | 11.9%(+31.8)#28 | 11.1%(+32.7)#1,621 |
| 29. | Newburg | 42.9% | 11.9%(+30.9)#29 | 11.1%(+31.8)#1,713 |
| 30. | Hope | 41.9% | 11.9%(+30.0)#30 | 11.1%(+30.9)#1,770 |
| 31. | Sheyenne | 40.6% | 11.9%(+28.7)#31 | 11.1%(+29.6)#1,862 |
| 32. | Center | 40.4% | 11.9%(+28.5)#32 | 11.1%(+29.4)#1,874 |
| 33. | Trenton | 40.0% | 11.9%(+28.1)#33 | 11.1%(+28.9)#1,907 |
| 34. | Tappen | 40.0% | 11.9%(+28.1)#34 | 11.1%(+28.9)#1,922 |
| 35. | Mooreton | 40.0% | 11.9%(+28.1)#35 | 11.1%(+28.9)#1,935 |
| 36. | Grace City | 40.0% | 11.9%(+28.1)#36 | 11.1%(+28.9)#1,965 |
| 37. | Esmond | 38.1% | 11.9%(+26.2)#37 | 11.1%(+27.0)#2,118 |
| 38. | Gladstone | 37.5% | 11.9%(+25.6)#38 | 11.1%(+26.4)#2,174 |
| 39. | Bisbee | 37.5% | 11.9%(+25.6)#39 | 11.1%(+26.4)#2,192 |
| 40. | De Lamere | 37.5% | 11.9%(+25.6)#40 | 11.1%(+26.4)#2,194 |
| 41. | Horace | 36.8% | 11.9%(+24.9)#41 | 11.1%(+25.8)#2,232 |
| 42. | Velva | 34.5% | 11.9%(+22.6)#42 | 11.1%(+23.4)#2,465 |
| 43. | Michigan City | 33.3% | 11.9%(+21.4)#43 | 11.1%(+22.3)#2,628 |
| 44. | Fingal | 33.3% | 11.9%(+21.4)#44 | 11.1%(+22.3)#2,686 |
| 45. | Adams | 33.3% | 11.9%(+21.4)#45 | 11.1%(+22.3)#2,695 |
| 46. | Hague | 33.3% | 11.9%(+21.4)#46 | 11.1%(+22.3)#2,697 |
| 47. | Crary | 33.3% | 11.9%(+21.4)#47 | 11.1%(+22.3)#2,698 |
| 48. | Solen | 33.3% | 11.9%(+21.4)#48 | 11.1%(+22.3)#2,716 |
| 49. | Tolna | 32.3% | 11.9%(+20.3)#49 | 11.1%(+21.2)#2,815 |
| 50. | Maddock | 31.8% | 11.9%(+19.9)#50 | 11.1%(+20.8)#2,863 |
| 51. | Hannaford | 31.2% | 11.9%(+19.3)#51 | 11.1%(+20.2)#2,939 |
| 52. | Emerado | 31.0% | 11.9%(+19.1)#52 | 11.1%(+20.0)#2,958 |
| 53. | Wishek | 31.0% | 11.9%(+19.1)#53 | 11.1%(+19.9)#2,960 |
| 54. | Langdon | 30.0% | 11.9%(+18.0)#54 | 11.1%(+18.9)#3,152 |
| 55. | Linton | 29.2% | 11.9%(+17.3)#55 | 11.1%(+18.1)#3,268 |
| 56. | Edinburg | 29.2% | 11.9%(+17.3)#56 | 11.1%(+18.1)#3,271 |
| 57. | Gascoyne | 28.6% | 11.9%(+16.7)#57 | 11.1%(+17.5)#3,388 |
| 58. | Powers Lake | 28.0% | 11.9%(+16.1)#58 | 11.1%(+16.9)#3,467 |
| 59. | Kenmare | 26.3% | 11.9%(+14.4)#59 | 11.1%(+15.2)#3,816 |
| 60. | Buxton | 26.1% | 11.9%(+14.2)#60 | 11.1%(+15.0)#3,856 |
| 61. | Manvel | 25.9% | 11.9%(+14.0)#61 | 11.1%(+14.9)#3,893 |
| 62. | Mott | 25.7% | 11.9%(+13.8)#62 | 11.1%(+14.6)#3,941 |
| 63. | Hankinson | 25.6% | 11.9%(+13.6)#63 | 11.1%(+14.5)#3,973 |
| 64. | Davenport | 25.0% | 11.9%(+13.1)#64 | 11.1%(+13.9)#4,131 |
| 65. | Litchville | 25.0% | 11.9%(+13.1)#65 | 11.1%(+13.9)#4,158 |
| 66. | Cogswell | 25.0% | 11.9%(+13.1)#66 | 11.1%(+13.9)#4,171 |
| 67. | Columbus | 25.0% | 11.9%(+13.1)#67 | 11.1%(+13.9)#4,188 |
| 68. | Mcclusky | 24.6% | 11.9%(+12.7)#68 | 11.1%(+13.6)#4,246 |
| 69. | Finley | 24.4% | 11.9%(+12.5)#69 | 11.1%(+13.3)#4,287 |
| 70. | Casselton | 24.2% | 11.9%(+12.3)#70 | 11.1%(+13.1)#4,325 |
| 71. | Devils Lake | 24.2% | 11.9%(+12.3)#71 | 11.1%(+13.1)#4,331 |
| 72. | Fessenden | 23.8% | 11.9%(+11.9)#72 | 11.1%(+12.7)#4,419 |
| 73. | Jamestown | 23.6% | 11.9%(+11.7)#73 | 11.1%(+12.5)#4,487 |
| 74. | Marmarth | 23.5% | 11.9%(+11.6)#74 | 11.1%(+12.5)#4,516 |
| 75. | Tioga | 23.2% | 11.9%(+11.3)#75 | 11.1%(+12.1)#4,584 |
| 76. | Beach | 23.1% | 11.9%(+11.2)#76 | 11.1%(+12.0)#4,611 |
| 77. | Wahpeton | 20.8% | 11.9%(+8.89)#77 | 11.1%(+9.74)#5,325 |
| 78. | Killdeer | 20.6% | 11.9%(+8.67)#78 | 11.1%(+9.52)#5,402 |
| 79. | Wilton | 20.5% | 11.9%(+8.54)#79 | 11.1%(+9.39)#5,449 |
| 80. | Forman | 20.0% | 11.9%(+8.08)#80 | 11.1%(+8.93)#5,603 |
| 81. | Regent | 20.0% | 11.9%(+8.08)#81 | 11.1%(+8.93)#5,678 |
| 82. | Palermo | 20.0% | 11.9%(+8.08)#82 | 11.1%(+8.93)#5,683 |
| 83. | Pettibone | 20.0% | 11.9%(+8.08)#83 | 11.1%(+8.93)#5,708 |
| 84. | Elgin | 19.7% | 11.9%(+7.82)#84 | 11.1%(+8.67)#5,778 |
| 85. | Mayville | 19.7% | 11.9%(+7.80)#85 | 11.1%(+8.65)#5,781 |
| 86. | Drake | 19.5% | 11.9%(+7.60)#86 | 11.1%(+8.45)#5,851 |
| 87. | New England | 19.4% | 11.9%(+7.53)#87 | 11.1%(+8.38)#5,871 |
| 88. | Medina | 19.2% | 11.9%(+7.32)#88 | 11.1%(+8.16)#5,981 |
| 89. | Driscoll | 19.2% | 11.9%(+7.32)#89 | 11.1%(+8.16)#5,982 |
| 90. | Tower City | 19.0% | 11.9%(+7.13)#90 | 11.1%(+7.98)#6,046 |
| 91. | Valley City | 18.8% | 11.9%(+6.91)#91 | 11.1%(+7.76)#6,129 |
| 92. | Cooperstown | 18.3% | 11.9%(+6.36)#92 | 11.1%(+7.21)#6,353 |
| 93. | Underwood | 18.2% | 11.9%(+6.27)#93 | 11.1%(+7.11)#6,408 |
| 94. | Willow City | 18.2% | 11.9%(+6.27)#94 | 11.1%(+7.11)#6,457 |
| 95. | Turtle Lake | 18.0% | 11.9%(+6.12)#95 | 11.1%(+6.97)#6,505 |
| 96. | Dickinson | 17.9% | 11.9%(+5.95)#96 | 11.1%(+6.80)#6,554 |
| 97. | Hillsboro | 17.9% | 11.9%(+5.94)#97 | 11.1%(+6.79)#6,561 |
| 98. | Medora | 17.6% | 11.9%(+5.73)#98 | 11.1%(+6.58)#6,695 |
| 99. | Cavalier | 16.7% | 11.9%(+4.75)#99 | 11.1%(+5.60)#7,099 |
| 100. | Burlington | 16.7% | 11.9%(+4.75)#100 | 11.1%(+5.60)#7,101 |
Common Questions
What are the Top 10 Cities with the Highest Poverty Level Among Seniors Over the Age of 75 in North Dakota?
Top 10 Cities with the Highest Poverty Level Among Seniors Over the Age of 75 in North Dakota are:
#1
100.0%
#2
100.0%
#3
100.0%
#4
100.0%
#5
100.0%
#6
100.0%
#7
100.0%
#8
100.0%
#9
100.0%
#10
100.0%
What city has the Highest Poverty Level Among Seniors Over the Age of 75 in North Dakota?
Four Bears Village has the Highest Poverty Level Among Seniors Over the Age of 75 in North Dakota with 100.0%.
What is the Poverty Level Among Seniors Over the Age of 75 in the State of North Dakota?
Poverty Level Among Seniors Over the Age of 75 in North Dakota is 11.9%.
What is the Poverty Level Among Seniors Over the Age of 75 in the United States?
Poverty Level Among Seniors Over the Age of 75 in the United States is 11.1%.