Cities with the Highest Poverty Level Among Seniors Over the Age of 75 in Pennsylvania
RELATED REPORTS & OPTIONS
Highest Poverty | Seniors 75+
Pennsylvania
Compare Cities
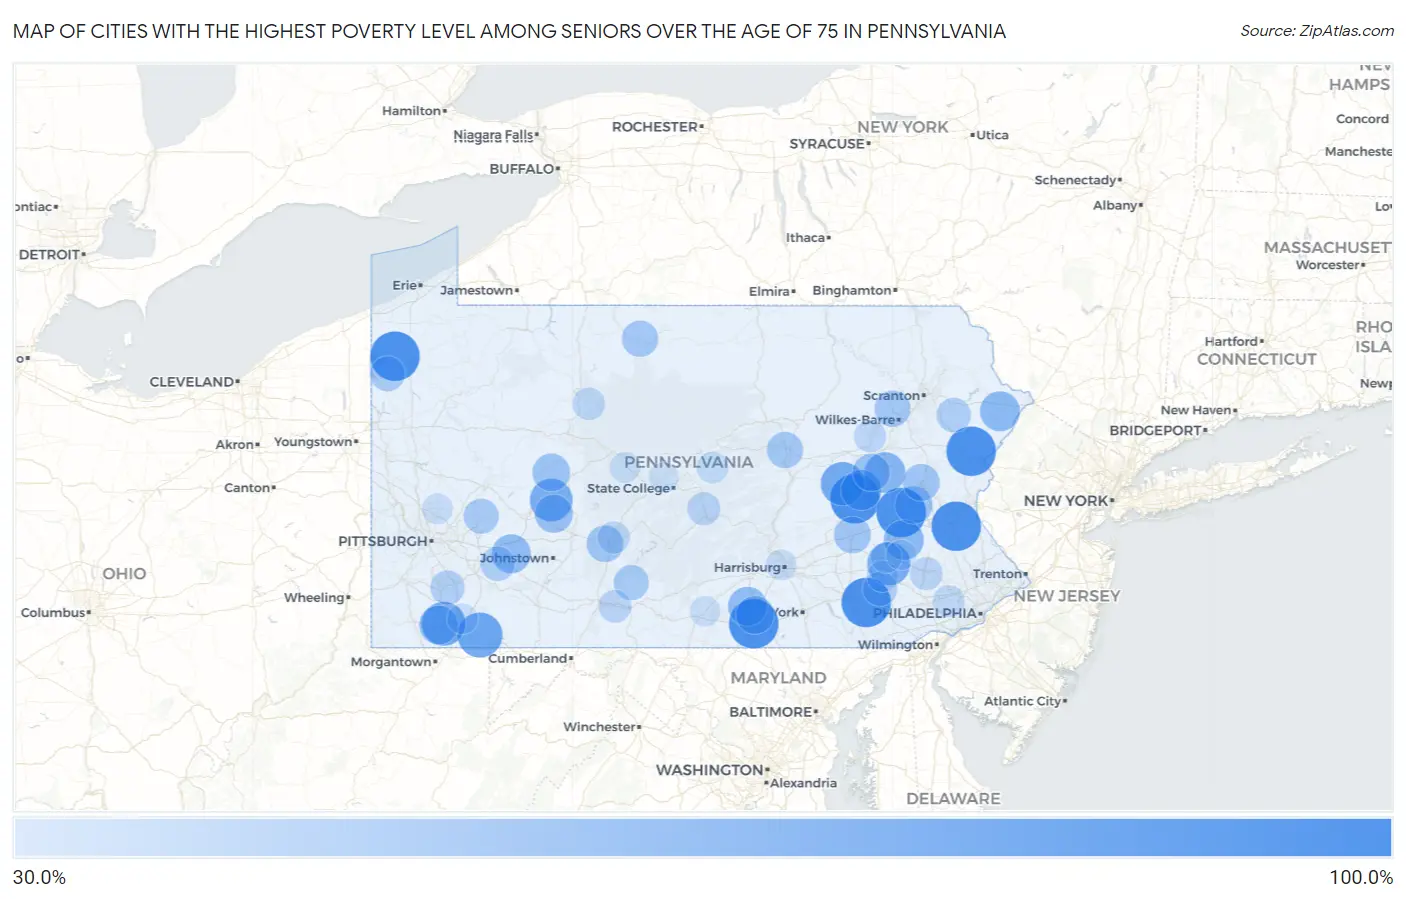
Map of Cities with the Highest Poverty Level Among Seniors Over the Age of 75 in Pennsylvania
0.0%
100.0%
Cities with the Highest Poverty Level Among Seniors Over the Age of 75 in Pennsylvania
| City | Senior Poverty | vs State | vs National | |
| 1. | Penn Estates | 100.0% | 10.1%(+89.9)#1 | 11.1%(+88.9)#1 |
| 2. | Desales University | 100.0% | 10.1%(+89.9)#2 | 11.1%(+88.9)#31 |
| 3. | Dixonville | 100.0% | 10.1%(+89.9)#3 | 11.1%(+88.9)#48 |
| 4. | Hunterstown | 100.0% | 10.1%(+89.9)#4 | 11.1%(+88.9)#115 |
| 5. | Heckscherville | 100.0% | 10.1%(+89.9)#5 | 11.1%(+88.9)#147 |
| 6. | Ronks | 100.0% | 10.1%(+89.9)#6 | 11.1%(+88.9)#161 |
| 7. | Sproul | 100.0% | 10.1%(+89.9)#7 | 11.1%(+88.9)#173 |
| 8. | Harmonsburg | 100.0% | 10.1%(+89.9)#8 | 11.1%(+88.9)#187 |
| 9. | Kempton | 100.0% | 10.1%(+89.9)#9 | 11.1%(+88.9)#207 |
| 10. | Gray | 100.0% | 10.1%(+89.9)#10 | 11.1%(+88.9)#246 |
| 11. | Carson Valley | 100.0% | 10.1%(+89.9)#11 | 11.1%(+88.9)#259 |
| 12. | Farmington | 83.9% | 10.1%(+73.8)#12 | 11.1%(+72.8)#459 |
| 13. | Edenborn | 80.0% | 10.1%(+69.9)#13 | 11.1%(+68.9)#493 |
| 14. | Wilburton Number Two | 78.6% | 10.1%(+68.5)#14 | 11.1%(+67.5)#512 |
| 15. | Pennwyn | 77.7% | 10.1%(+67.6)#15 | 11.1%(+66.6)#522 |
| 16. | Commodore | 76.1% | 10.1%(+66.0)#16 | 11.1%(+65.0)#541 |
| 17. | Kelayres | 69.2% | 10.1%(+59.1)#17 | 11.1%(+58.2)#632 |
| 18. | Altamont | 68.1% | 10.1%(+58.0)#18 | 11.1%(+57.0)#647 |
| 19. | Walnuttown | 66.7% | 10.1%(+56.6)#19 | 11.1%(+55.6)#671 |
| 20. | St Clairsville Borough | 66.7% | 10.1%(+56.6)#20 | 11.1%(+55.6)#703 |
| 21. | Conashaugh Lakes | 66.2% | 10.1%(+56.1)#21 | 11.1%(+55.1)#714 |
| 22. | Gardners | 63.2% | 10.1%(+53.0)#22 | 11.1%(+52.1)#754 |
| 23. | Nemacolin | 63.0% | 10.1%(+52.9)#23 | 11.1%(+52.0)#756 |
| 24. | Millwood | 63.0% | 10.1%(+52.9)#24 | 11.1%(+52.0)#757 |
| 25. | Claysville Borough | 62.7% | 10.1%(+52.6)#25 | 11.1%(+51.7)#764 |
| 26. | Heilwood | 60.0% | 10.1%(+49.9)#26 | 11.1%(+48.9)#848 |
| 27. | Heidlersburg | 59.6% | 10.1%(+49.5)#27 | 11.1%(+48.5)#874 |
| 28. | Briar Creek Borough | 58.3% | 10.1%(+48.2)#28 | 11.1%(+47.3)#897 |
| 29. | New Tripoli | 58.3% | 10.1%(+48.2)#29 | 11.1%(+47.3)#899 |
| 30. | Rossiter | 58.3% | 10.1%(+48.2)#30 | 11.1%(+47.3)#900 |
| 31. | Juniata Terrace Borough | 58.1% | 10.1%(+48.0)#31 | 11.1%(+47.0)#915 |
| 32. | Polk Borough | 57.7% | 10.1%(+47.6)#32 | 11.1%(+46.6)#927 |
| 33. | Sheppton | 57.5% | 10.1%(+47.4)#33 | 11.1%(+46.4)#931 |
| 34. | Jefferson Borough Greene County | 57.1% | 10.1%(+47.0)#34 | 11.1%(+46.1)#948 |
| 35. | Weissport East | 56.1% | 10.1%(+46.0)#35 | 11.1%(+45.0)#984 |
| 36. | Clappertown | 55.6% | 10.1%(+45.4)#36 | 11.1%(+44.5)#1,007 |
| 37. | Foot Of Ten | 55.3% | 10.1%(+45.2)#37 | 11.1%(+44.2)#1,020 |
| 38. | Bethel | 55.3% | 10.1%(+45.2)#38 | 11.1%(+44.2)#1,022 |
| 39. | New Columbia | 53.8% | 10.1%(+43.7)#39 | 11.1%(+42.8)#1,067 |
| 40. | Roulette | 53.7% | 10.1%(+43.5)#40 | 11.1%(+42.6)#1,075 |
| 41. | Shavertown | 53.2% | 10.1%(+43.0)#41 | 11.1%(+42.1)#1,092 |
| 42. | Dauphin Borough | 51.4% | 10.1%(+41.3)#42 | 11.1%(+40.3)#1,143 |
| 43. | Defiance | 50.0% | 10.1%(+39.9)#43 | 11.1%(+38.9)#1,205 |
| 44. | North Vandergrift | 50.0% | 10.1%(+39.9)#44 | 11.1%(+38.9)#1,217 |
| 45. | Hartstown | 50.0% | 10.1%(+39.9)#45 | 11.1%(+38.9)#1,253 |
| 46. | Tarentum Borough | 49.2% | 10.1%(+39.1)#46 | 11.1%(+38.1)#1,325 |
| 47. | Chadds Ford | 49.1% | 10.1%(+38.9)#47 | 11.1%(+38.0)#1,331 |
| 48. | St Vincent College | 47.8% | 10.1%(+37.7)#48 | 11.1%(+36.8)#1,389 |
| 49. | Pocono Springs | 47.6% | 10.1%(+37.5)#49 | 11.1%(+36.6)#1,394 |
| 50. | Blue Ball | 47.2% | 10.1%(+37.1)#50 | 11.1%(+36.2)#1,425 |
| 51. | Lynnwood Pricedale | 47.0% | 10.1%(+36.9)#51 | 11.1%(+35.9)#1,437 |
| 52. | Midland Borough | 45.5% | 10.1%(+35.4)#52 | 11.1%(+34.4)#1,521 |
| 53. | Coaldale Borough Bedford County | 45.5% | 10.1%(+35.3)#53 | 11.1%(+34.4)#1,538 |
| 54. | Donegal Borough | 44.4% | 10.1%(+34.3)#54 | 11.1%(+33.4)#1,597 |
| 55. | Middleport Borough | 43.8% | 10.1%(+33.6)#55 | 11.1%(+32.7)#1,630 |
| 56. | Elco Borough | 43.5% | 10.1%(+33.4)#56 | 11.1%(+32.4)#1,646 |
| 57. | New Columbus Borough | 43.5% | 10.1%(+33.4)#57 | 11.1%(+32.4)#1,647 |
| 58. | Lumber City | 43.1% | 10.1%(+33.0)#58 | 11.1%(+32.1)#1,667 |
| 59. | Kenilworth | 42.1% | 10.1%(+32.0)#59 | 11.1%(+31.0)#1,745 |
| 60. | Earlston | 42.0% | 10.1%(+31.9)#60 | 11.1%(+30.9)#1,762 |
| 61. | Mckees Rocks Borough | 41.6% | 10.1%(+31.5)#61 | 11.1%(+30.5)#1,804 |
| 62. | Terre Hill Borough | 41.5% | 10.1%(+31.4)#62 | 11.1%(+30.5)#1,807 |
| 63. | Kersey | 41.2% | 10.1%(+31.1)#63 | 11.1%(+30.1)#1,826 |
| 64. | Palmerton Borough | 41.1% | 10.1%(+31.0)#64 | 11.1%(+30.1)#1,835 |
| 65. | Lakemont | 40.2% | 10.1%(+30.1)#65 | 11.1%(+29.2)#1,886 |
| 66. | Mount Oliver Borough | 40.1% | 10.1%(+30.0)#66 | 11.1%(+29.1)#1,888 |
| 67. | Mocanaqua | 40.0% | 10.1%(+29.9)#67 | 11.1%(+28.9)#1,904 |
| 68. | Hopewell Borough | 40.0% | 10.1%(+29.9)#68 | 11.1%(+28.9)#1,939 |
| 69. | West Reading Borough | 39.1% | 10.1%(+29.0)#69 | 11.1%(+28.0)#2,020 |
| 70. | Nottingham | 38.8% | 10.1%(+28.7)#70 | 11.1%(+27.7)#2,046 |
| 71. | Berwyn | 38.7% | 10.1%(+28.6)#71 | 11.1%(+27.6)#2,052 |
| 72. | Loretto Borough | 38.5% | 10.1%(+28.4)#72 | 11.1%(+27.4)#2,068 |
| 73. | Oswayo Borough | 38.5% | 10.1%(+28.4)#73 | 11.1%(+27.4)#2,086 |
| 74. | Madisonburg | 38.1% | 10.1%(+28.0)#74 | 11.1%(+27.0)#2,116 |
| 75. | Fountain Hill Borough | 38.0% | 10.1%(+27.9)#75 | 11.1%(+26.9)#2,126 |
| 76. | Bowmansville | 37.5% | 10.1%(+27.4)#76 | 11.1%(+26.4)#2,157 |
| 77. | Atglen Borough | 37.3% | 10.1%(+27.2)#77 | 11.1%(+26.2)#2,204 |
| 78. | Eagleville Cdp Centre County | 37.1% | 10.1%(+27.0)#78 | 11.1%(+26.1)#2,216 |
| 79. | Jenkintown Borough | 36.6% | 10.1%(+26.5)#79 | 11.1%(+25.6)#2,256 |
| 80. | Fredericksburg Cdp Lebanon County | 36.6% | 10.1%(+26.5)#80 | 11.1%(+25.6)#2,257 |
| 81. | Millvale Borough | 36.4% | 10.1%(+26.3)#81 | 11.1%(+25.4)#2,264 |
| 82. | Eagle Creek | 36.4% | 10.1%(+26.3)#82 | 11.1%(+25.3)#2,289 |
| 83. | West Lawn | 36.1% | 10.1%(+26.0)#83 | 11.1%(+25.0)#2,306 |
| 84. | West Fairview | 35.5% | 10.1%(+25.4)#84 | 11.1%(+24.5)#2,362 |
| 85. | Bakerstown | 35.3% | 10.1%(+25.2)#85 | 11.1%(+24.3)#2,372 |
| 86. | West Decatur | 35.0% | 10.1%(+24.9)#86 | 11.1%(+23.9)#2,411 |
| 87. | Tioga Borough | 34.9% | 10.1%(+24.8)#87 | 11.1%(+23.8)#2,426 |
| 88. | North Charleroi Borough | 34.8% | 10.1%(+24.7)#88 | 11.1%(+23.8)#2,433 |
| 89. | Scotland | 34.4% | 10.1%(+24.3)#89 | 11.1%(+23.3)#2,479 |
| 90. | Oliver | 34.3% | 10.1%(+24.2)#90 | 11.1%(+23.3)#2,482 |
| 91. | West York Borough | 34.2% | 10.1%(+24.1)#91 | 11.1%(+23.1)#2,491 |
| 92. | Donora Borough | 34.2% | 10.1%(+24.1)#92 | 11.1%(+23.1)#2,492 |
| 93. | Duncansville Borough | 34.2% | 10.1%(+24.1)#93 | 11.1%(+23.1)#2,496 |
| 94. | Stony Creek Mills | 33.3% | 10.1%(+23.2)#94 | 11.1%(+22.3)#2,585 |
| 95. | Tunnelhill Borough | 33.3% | 10.1%(+23.2)#95 | 11.1%(+22.3)#2,639 |
| 96. | Sylvania Borough | 33.3% | 10.1%(+23.2)#96 | 11.1%(+22.3)#2,641 |
| 97. | Julian | 33.3% | 10.1%(+23.2)#97 | 11.1%(+22.3)#2,643 |
| 98. | Potters Mills | 33.3% | 10.1%(+23.2)#98 | 11.1%(+22.3)#2,675 |
| 99. | Union Dale Borough | 33.3% | 10.1%(+23.2)#99 | 11.1%(+22.3)#2,677 |
| 100. | Robeson Extension | 33.3% | 10.1%(+23.2)#100 | 11.1%(+22.3)#2,679 |
Common Questions
What are the Top 10 Cities with the Highest Poverty Level Among Seniors Over the Age of 75 in Pennsylvania?
Top 10 Cities with the Highest Poverty Level Among Seniors Over the Age of 75 in Pennsylvania are:
#1
100.0%
#2
100.0%
#3
100.0%
#4
100.0%
#5
100.0%
#6
100.0%
#7
100.0%
#8
83.9%
#9
80.0%
#10
78.6%
What city has the Highest Poverty Level Among Seniors Over the Age of 75 in Pennsylvania?
Penn Estates has the Highest Poverty Level Among Seniors Over the Age of 75 in Pennsylvania with 100.0%.
What is the Poverty Level Among Seniors Over the Age of 75 in the State of Pennsylvania?
Poverty Level Among Seniors Over the Age of 75 in Pennsylvania is 10.1%.
What is the Poverty Level Among Seniors Over the Age of 75 in the United States?
Poverty Level Among Seniors Over the Age of 75 in the United States is 11.1%.