Zip Codes with the Highest Percentage of Population Employed in Health Diagnosing & Treating in Renton, WA
RELATED REPORTS & OPTIONS
Health Diagnosing & Treating
Renton
Compare Zip Codes
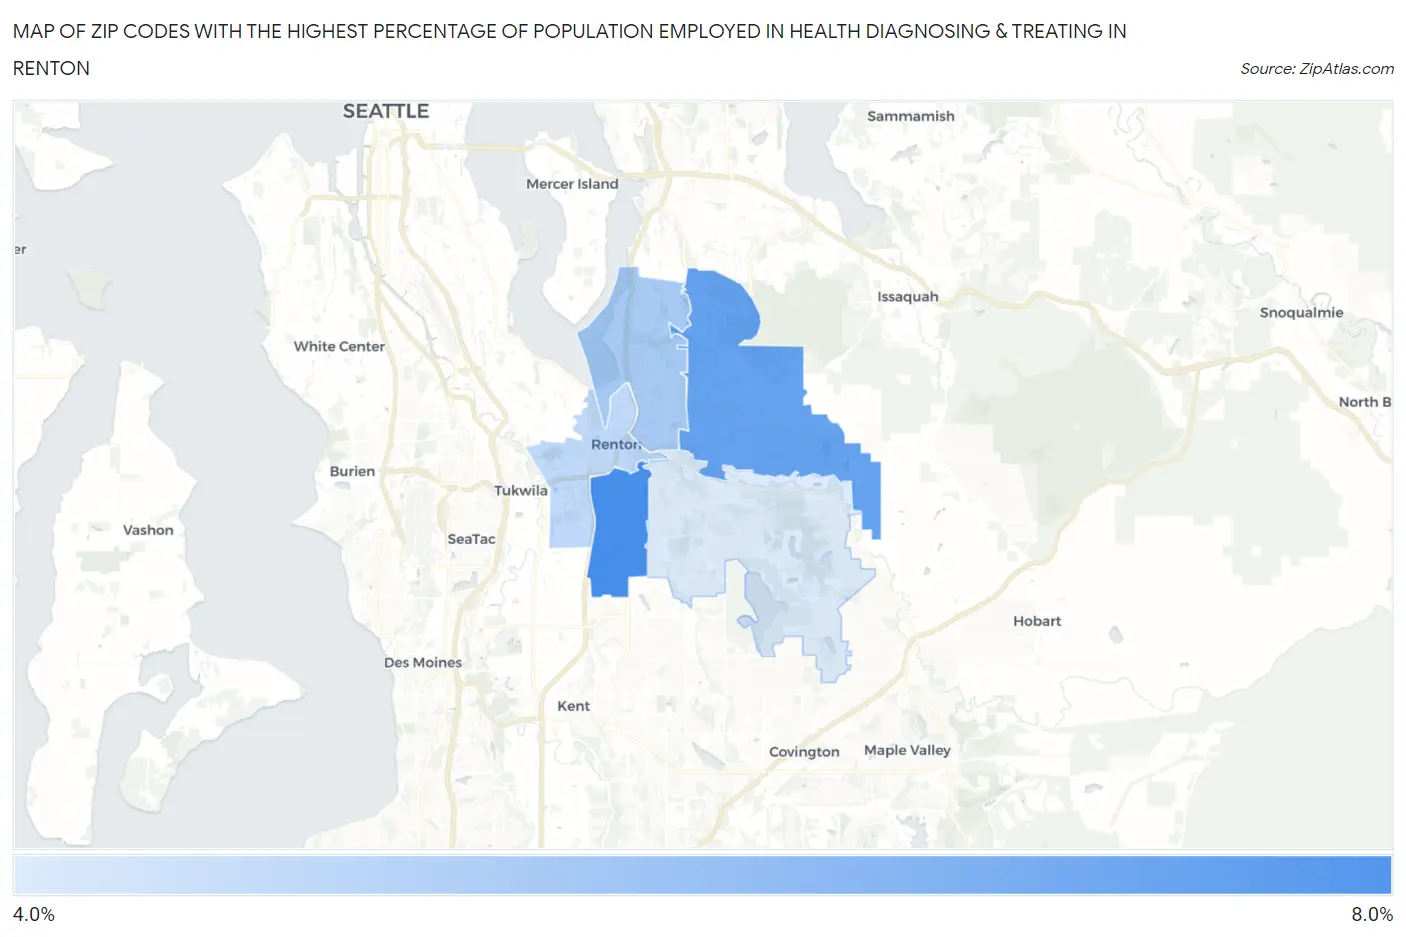
Map of Zip Codes with the Highest Percentage of Population Employed in Health Diagnosing & Treating in Renton
4.8%
6.1%
Zip Codes with the Highest Percentage of Population Employed in Health Diagnosing & Treating in Renton, WA
| Zip Code | % Employed | vs State | vs National | |
| 1. | 98055 | 6.1% | 5.6%(+0.501)#171 | 6.2%(-0.190)#13,669 |
| 2. | 98059 | 5.8% | 5.6%(+0.258)#190 | 6.2%(-0.433)#14,572 |
| 3. | 98056 | 5.3% | 5.6%(-0.299)#241 | 6.2%(-0.990)#16,726 |
| 4. | 98057 | 5.1% | 5.6%(-0.495)#261 | 6.2%(-1.19)#17,464 |
| 5. | 98058 | 4.8% | 5.6%(-0.744)#290 | 6.2%(-1.44)#18,465 |
1
Common Questions
What are the Top 3 Zip Codes with the Highest Percentage of Population Employed in Health Diagnosing & Treating in Renton, WA?
Top 3 Zip Codes with the Highest Percentage of Population Employed in Health Diagnosing & Treating in Renton, WA are:
What zip code has the Highest Percentage of Population Employed in Health Diagnosing & Treating in Renton, WA?
98055 has the Highest Percentage of Population Employed in Health Diagnosing & Treating in Renton, WA with 6.1%.
What is the Percentage of Population Employed in Health Diagnosing & Treating in Renton, WA?
Percentage of Population Employed in Health Diagnosing & Treating in Renton is 5.2%.
What is the Percentage of Population Employed in Health Diagnosing & Treating in Washington?
Percentage of Population Employed in Health Diagnosing & Treating in Washington is 5.6%.
What is the Percentage of Population Employed in Health Diagnosing & Treating in the United States?
Percentage of Population Employed in Health Diagnosing & Treating in the United States is 6.2%.