Ocean City, WA Map & Demographics
Ocean City Map
Ocean City Overview
$12,821
PER CAPITA INCOME
0.39
INEQUALITY / GINI INDEX
107
TOTAL POPULATION
47
MALE POPULATION
60
FEMALE POPULATION
78.33
MALES / 100 FEMALES
127.66
FEMALES / 100 MALES
53.3
MEDIAN AGE
3.1
AVG FAMILY SIZE
2.4
AVG HOUSEHOLD SIZE
46
LABOR FORCE [ PEOPLE ]
59.7%
PERCENT IN LABOR FORCE
Ocean City Area Codes
Income in Ocean City
Income Overview in Ocean City
| Characteristic | Number | Measure |
| Per Capita Income | 107 | $12,821 |
| Median Family Income | 30 | $0 |
| Mean Family Income | 30 | $101,993 |
| Median Household Income | 44 | $0 |
| Mean Household Income | 44 | $76,277 |
| Income Deficit | 30 | $0 |
| Wage / Income Gap (%) | 107 | 0.00% |
| Wage / Income Gap ($) | 107 | 100.00¢ per $1 |
| Gini / Inequality Index | 107 | 0.39 |
Earnings by Sex in Ocean City
| Sex | Number | Average Earnings |
| Male | 16 (25.8%) | $0 |
| Female | 46 (74.2%) | $0 |
| Total | 62 (100.0%) | $0 |
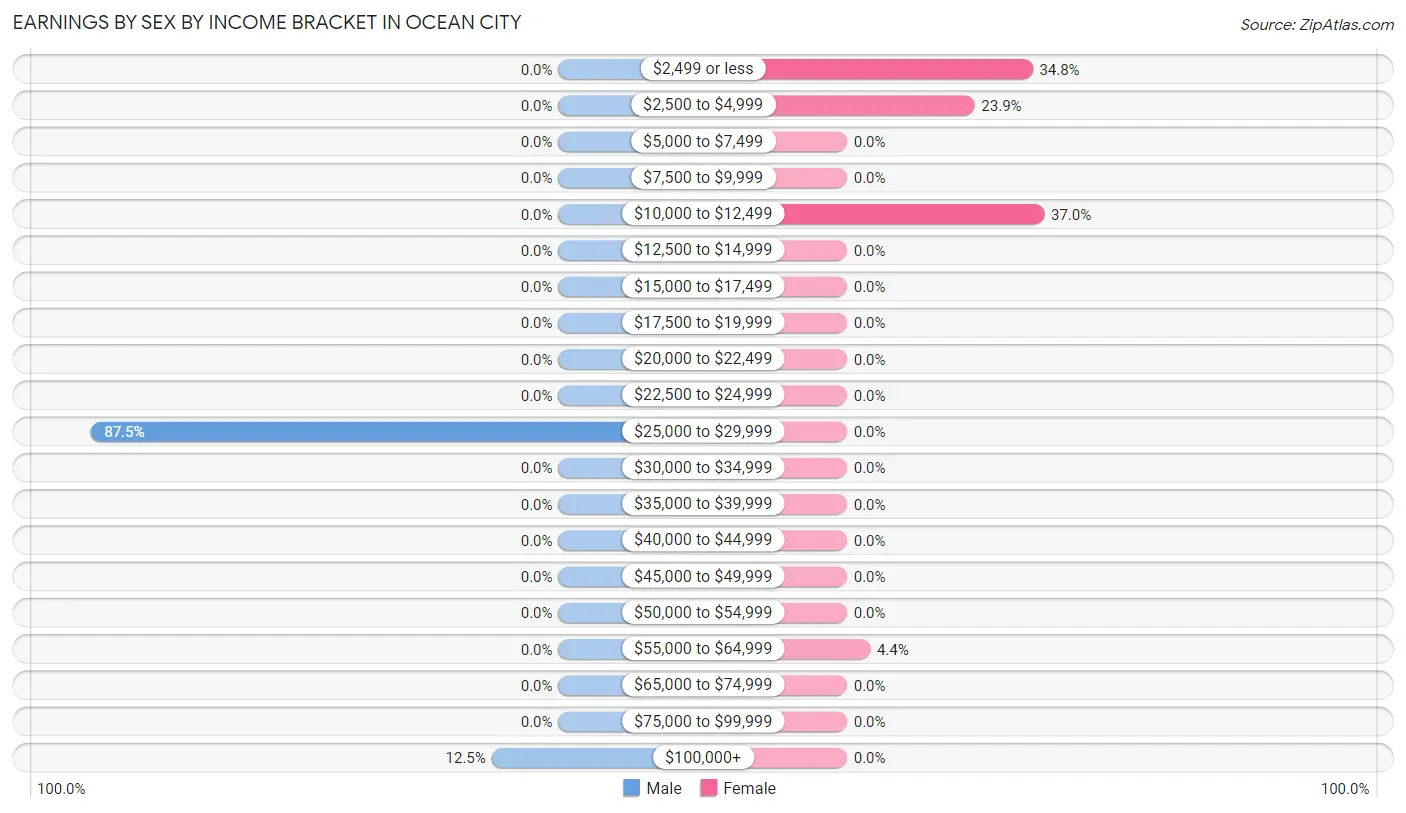
Earnings by Sex by Income Bracket in Ocean City
The most common earnings brackets in Ocean City are $25,000 to $29,999 for men (14 | 87.5%) and $10,000 to $12,499 for women (17 | 37.0%).
| Income | Male | Female |
| $2,499 or less | 0 (0.0%) | 16 (34.8%) |
| $2,500 to $4,999 | 0 (0.0%) | 11 (23.9%) |
| $5,000 to $7,499 | 0 (0.0%) | 0 (0.0%) |
| $7,500 to $9,999 | 0 (0.0%) | 0 (0.0%) |
| $10,000 to $12,499 | 0 (0.0%) | 17 (37.0%) |
| $12,500 to $14,999 | 0 (0.0%) | 0 (0.0%) |
| $15,000 to $17,499 | 0 (0.0%) | 0 (0.0%) |
| $17,500 to $19,999 | 0 (0.0%) | 0 (0.0%) |
| $20,000 to $22,499 | 0 (0.0%) | 0 (0.0%) |
| $22,500 to $24,999 | 0 (0.0%) | 0 (0.0%) |
| $25,000 to $29,999 | 14 (87.5%) | 0 (0.0%) |
| $30,000 to $34,999 | 0 (0.0%) | 0 (0.0%) |
| $35,000 to $39,999 | 0 (0.0%) | 0 (0.0%) |
| $40,000 to $44,999 | 0 (0.0%) | 0 (0.0%) |
| $45,000 to $49,999 | 0 (0.0%) | 0 (0.0%) |
| $50,000 to $54,999 | 0 (0.0%) | 0 (0.0%) |
| $55,000 to $64,999 | 0 (0.0%) | 2 (4.3%) |
| $65,000 to $74,999 | 0 (0.0%) | 0 (0.0%) |
| $75,000 to $99,999 | 0 (0.0%) | 0 (0.0%) |
| $100,000+ | 2 (12.5%) | 0 (0.0%) |
| Total | 16 (100.0%) | 46 (100.0%) |
Earnings by Sex by Educational Attainment in Ocean City
| Educational Attainment | Male Income | Female Income |
| Less than High School | - | - |
| High School Diploma | - | - |
| College or Associate's Degree | - | - |
| Bachelor's Degree | - | - |
| Graduate Degree | - | - |
| Total | - | - |
Family Income in Ocean City
Family Income Brackets in Ocean City
According to the Ocean City family income data, there are 17 families falling into the $100,000 to $149,999 income range, which is the most common income bracket and makes up 56.7% of all families.
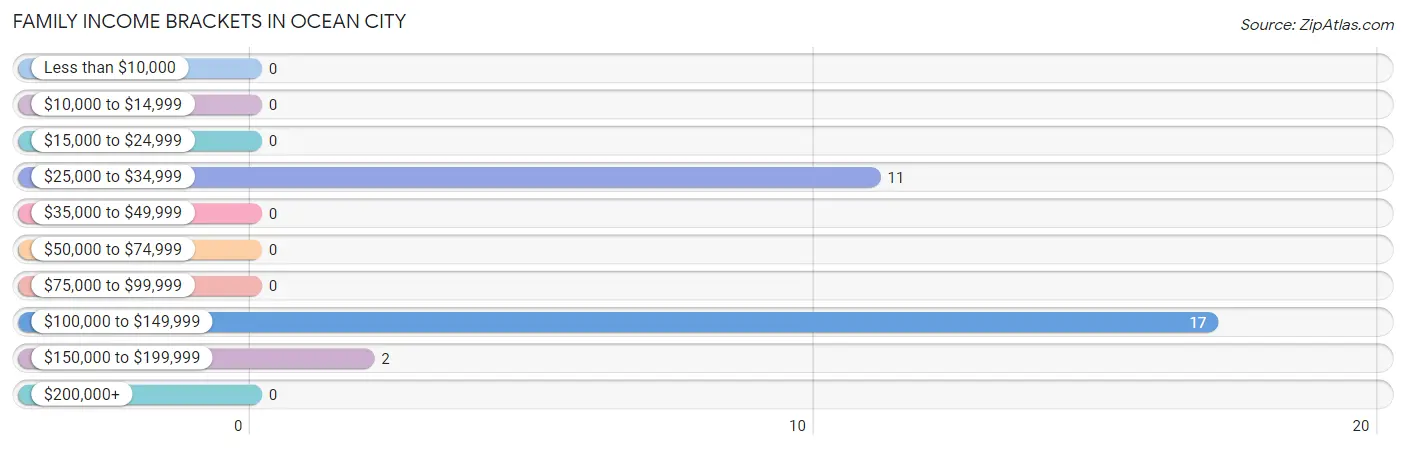
| Income Bracket | # Families | % Families |
| Less than $10,000 | 0 | 0.0% |
| $10,000 to $14,999 | 0 | 0.0% |
| $15,000 to $24,999 | 0 | 0.0% |
| $25,000 to $34,999 | 11 | 36.7% |
| $35,000 to $49,999 | 0 | 0.0% |
| $50,000 to $74,999 | 0 | 0.0% |
| $75,000 to $99,999 | 0 | 0.0% |
| $100,000 to $149,999 | 17 | 56.7% |
| $150,000 to $199,999 | 2 | 6.7% |
| $200,000+ | 0 | 0.0% |
Family Income by Famaliy Size in Ocean City
| Income Bracket | # Families | Median Income |
| 2-Person Families | 13 (43.3%) | $0 |
| 3-Person Families | 0 (0.0%) | $0 |
| 4-Person Families | 17 (56.7%) | $0 |
| 5-Person Families | 0 (0.0%) | $0 |
| 6-Person Families | 0 (0.0%) | $0 |
| 7+ Person Families | 0 (0.0%) | $0 |
| Total | 30 (100.0%) | $0 |
Family Income by Number of Earners in Ocean City
| Number of Earners | # Families | Median Income |
| No Earners | 0 (0.0%) | $0 |
| 1 Earner | 0 (0.0%) | $0 |
| 2 Earners | 30 (100.0%) | $0 |
| 3+ Earners | 0 (0.0%) | $0 |
| Total | 30 (100.0%) | $0 |
Household Income in Ocean City
Household Income Brackets in Ocean City
With 17 households falling in the category, the $100,000 to $149,999 income range is the most frequent in Ocean City, accounting for 38.6% of all households.
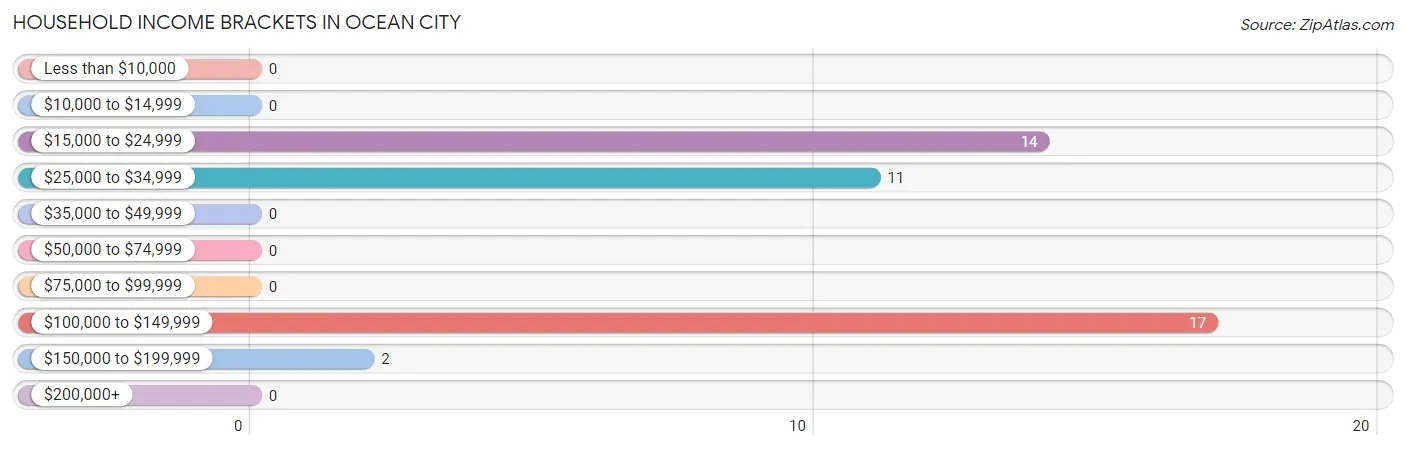
| Income Bracket | # Households | % Households |
| Less than $10,000 | 0 | 0.0% |
| $10,000 to $14,999 | 0 | 0.0% |
| $15,000 to $24,999 | 14 | 31.8% |
| $25,000 to $34,999 | 11 | 25.0% |
| $35,000 to $49,999 | 0 | 0.0% |
| $50,000 to $74,999 | 0 | 0.0% |
| $75,000 to $99,999 | 0 | 0.0% |
| $100,000 to $149,999 | 17 | 38.6% |
| $150,000 to $199,999 | 2 | 4.5% |
| $200,000+ | 0 | 0.0% |
Household Income by Householder Age in Ocean City
| Income Bracket | # Households | Median Income |
| 15 to 24 Years | 0 (0.0%) | $0 |
| 25 to 44 Years | 0 (0.0%) | $0 |
| 45 to 64 Years | 30 (68.2%) | $0 |
| 65+ Years | 14 (31.8%) | $0 |
| Total | 44 (100.0%) | $0 |
Poverty in Ocean City
Income Below Poverty by Sex and Age in Ocean City
| Age Bracket | Male | Female |
| Under 5 Years | 0 (0.0%) | 0 (0.0%) |
| 5 Years | 0 (0.0%) | 0 (0.0%) |
| 6 to 11 Years | 0 (0.0%) | 0 (0.0%) |
| 12 to 14 Years | 0 (0.0%) | 0 (0.0%) |
| 15 Years | 0 (0.0%) | 0 (0.0%) |
| 16 and 17 Years | 0 (0.0%) | 0 (0.0%) |
| 18 to 24 Years | 0 (0.0%) | 0 (0.0%) |
| 25 to 34 Years | 0 (0.0%) | 0 (0.0%) |
| 35 to 44 Years | 0 (0.0%) | 0 (0.0%) |
| 45 to 54 Years | 0 (0.0%) | 0 (0.0%) |
| 55 to 64 Years | 0 (0.0%) | 0 (0.0%) |
| 65 to 74 Years | 0 (0.0%) | 0 (0.0%) |
| 75 Years and over | 0 (0.0%) | 0 (0.0%) |
| Total | 0 (0.0%) | 0 (0.0%) |
Income Above Poverty by Sex and Age in Ocean City
According to the poverty statistics in Ocean City, males aged 6 to 11 years and females aged 16 and 17 years are the age groups that are most secure financially, with 100.0% of males and 100.0% of females in these age groups living above the poverty line.
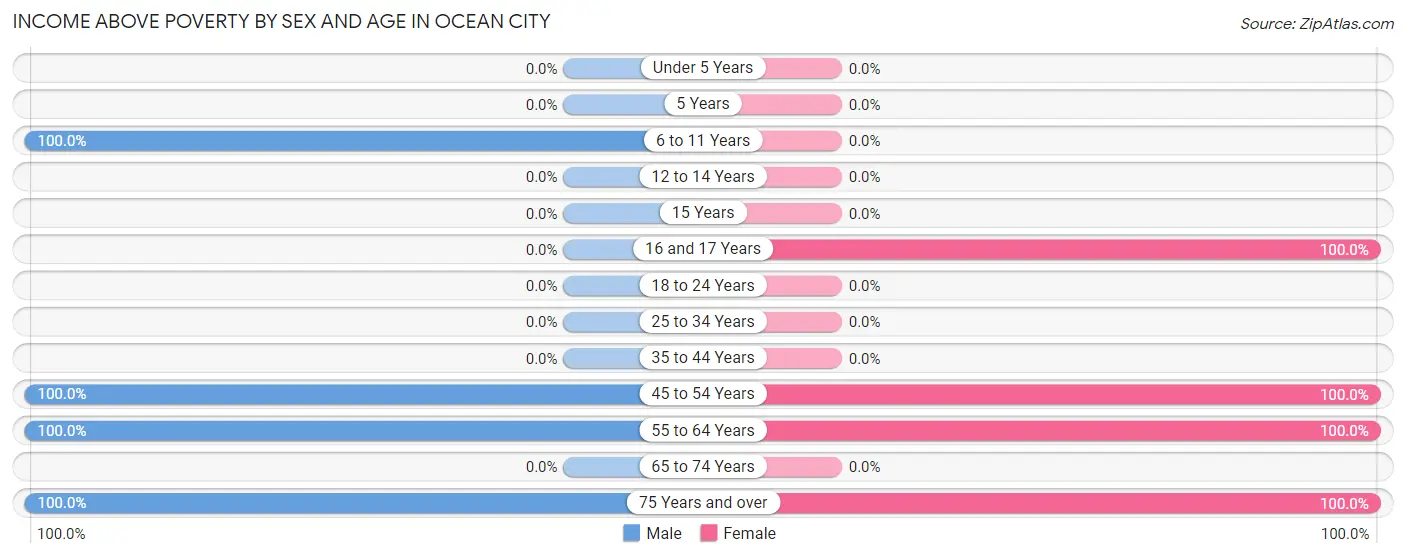
| Age Bracket | Male | Female |
| Under 5 Years | 0 (0.0%) | 0 (0.0%) |
| 5 Years | 0 (0.0%) | 0 (0.0%) |
| 6 to 11 Years | 30 (100.0%) | 0 (0.0%) |
| 12 to 14 Years | 0 (0.0%) | 0 (0.0%) |
| 15 Years | 0 (0.0%) | 0 (0.0%) |
| 16 and 17 Years | 0 (0.0%) | 16 (100.0%) |
| 18 to 24 Years | 0 (0.0%) | 0 (0.0%) |
| 25 to 34 Years | 0 (0.0%) | 0 (0.0%) |
| 35 to 44 Years | 0 (0.0%) | 0 (0.0%) |
| 45 to 54 Years | 14 (100.0%) | 28 (100.0%) |
| 55 to 64 Years | 2 (100.0%) | 2 (100.0%) |
| 65 to 74 Years | 0 (0.0%) | 0 (0.0%) |
| 75 Years and over | 1 (100.0%) | 14 (100.0%) |
| Total | 47 (100.0%) | 60 (100.0%) |
Income Below Poverty Among Married-Couple Families in Ocean City
| Children | Above Poverty | Below Poverty |
| No Children | 13 (100.0%) | 0 (0.0%) |
| 1 or 2 Children | 0 (0.0%) | 0 (0.0%) |
| 3 or 4 Children | 0 (0.0%) | 0 (0.0%) |
| 5 or more Children | 0 (0.0%) | 0 (0.0%) |
| Total | 13 (100.0%) | 0 (0.0%) |
Income Below Poverty Among Single-Parent Households in Ocean City
| Children | Single Father | Single Mother |
| No Children | 0 (0.0%) | 0 (0.0%) |
| 1 or 2 Children | 0 (0.0%) | 0 (0.0%) |
| 3 or 4 Children | 0 (0.0%) | 0 (0.0%) |
| 5 or more Children | 0 (0.0%) | 0 (0.0%) |
| Total | 0 (0.0%) | 0 (0.0%) |
Income Below Poverty Among Married-Couple vs Single-Parent Households in Ocean City
| Children | Married-Couple Families | Single-Parent Households |
| No Children | 0 (0.0%) | 0 (0.0%) |
| 1 or 2 Children | 0 (0.0%) | 0 (0.0%) |
| 3 or 4 Children | 0 (0.0%) | 0 (0.0%) |
| 5 or more Children | 0 (0.0%) | 0 (0.0%) |
| Total | 0 (0.0%) | 0 (0.0%) |
Race in Ocean City
The most populous races in Ocean City are Hispanic or Latino (59 | 55.1%), White / Caucasian (43 | 40.2%), and Some other Race (30 | 28.0%).
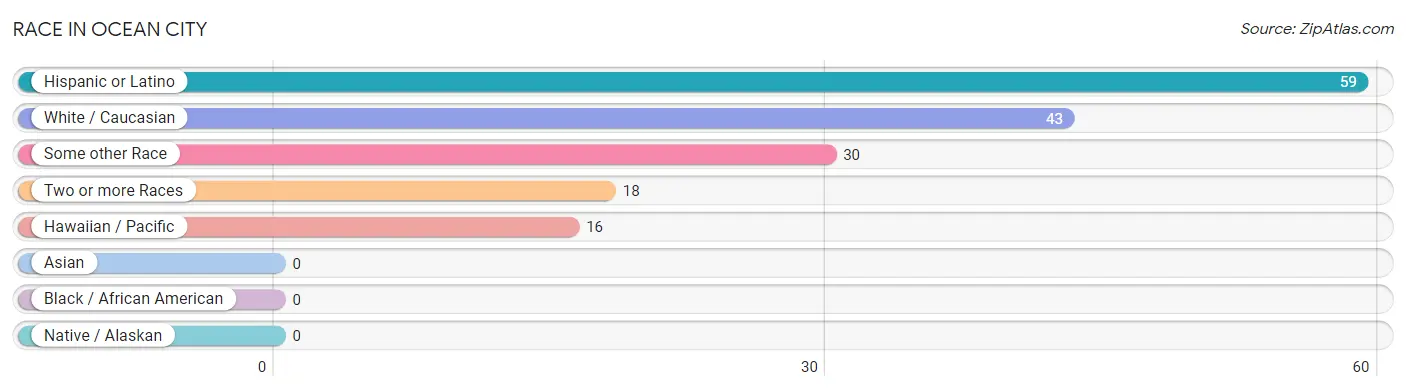
| Race | # Population | % Population |
| Asian | 0 | 0.0% |
| Black / African American | 0 | 0.0% |
| Hawaiian / Pacific | 16 | 14.9% |
| Hispanic or Latino | 59 | 55.1% |
| Native / Alaskan | 0 | 0.0% |
| White / Caucasian | 43 | 40.2% |
| Two or more Races | 18 | 16.8% |
| Some other Race | 30 | 28.0% |
| Total | 107 | 100.0% |
Ancestry in Ocean City
The most populous ancestries reported in Ocean City are Mexican (30 | 28.0%), Spanish (18 | 16.8%), Norwegian (16 | 14.9%), Samoan (16 | 14.9%), and German (14 | 13.1%), together accounting for 87.8% of all Ocean City residents.
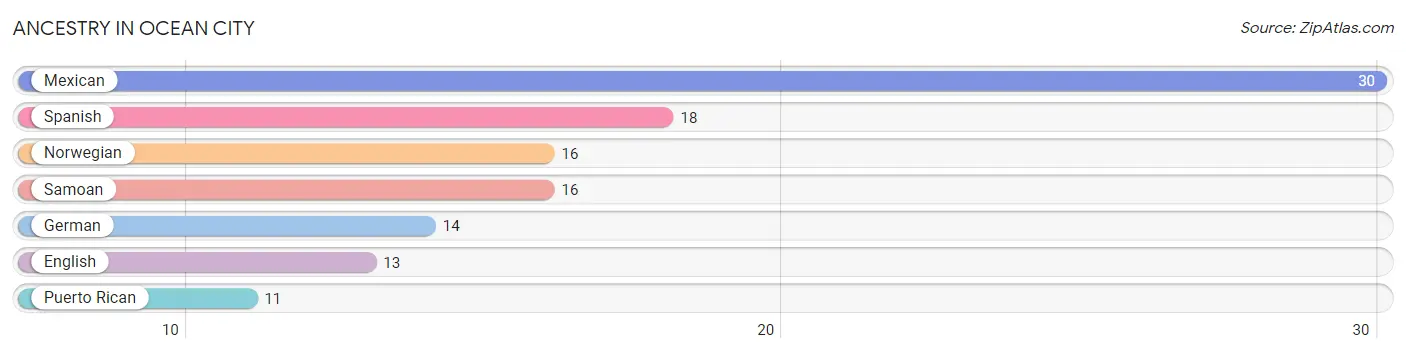
| Ancestry | # Population | % Population |
| English | 13 | 12.1% |
| German | 14 | 13.1% |
| Mexican | 30 | 28.0% |
| Norwegian | 16 | 14.9% |
| Puerto Rican | 11 | 10.3% |
| Samoan | 16 | 14.9% |
| Spanish | 18 | 16.8% | View All 7 Rows |
Immigrants in Ocean City

| Immigration Origin | # Population | % Population | View All 0 Rows |
Sex and Age in Ocean City
Sex and Age in Ocean City
The most populous age groups in Ocean City are 10 to 14 Years (30 | 63.8%) for men and 50 to 54 Years (28 | 46.7%) for women.
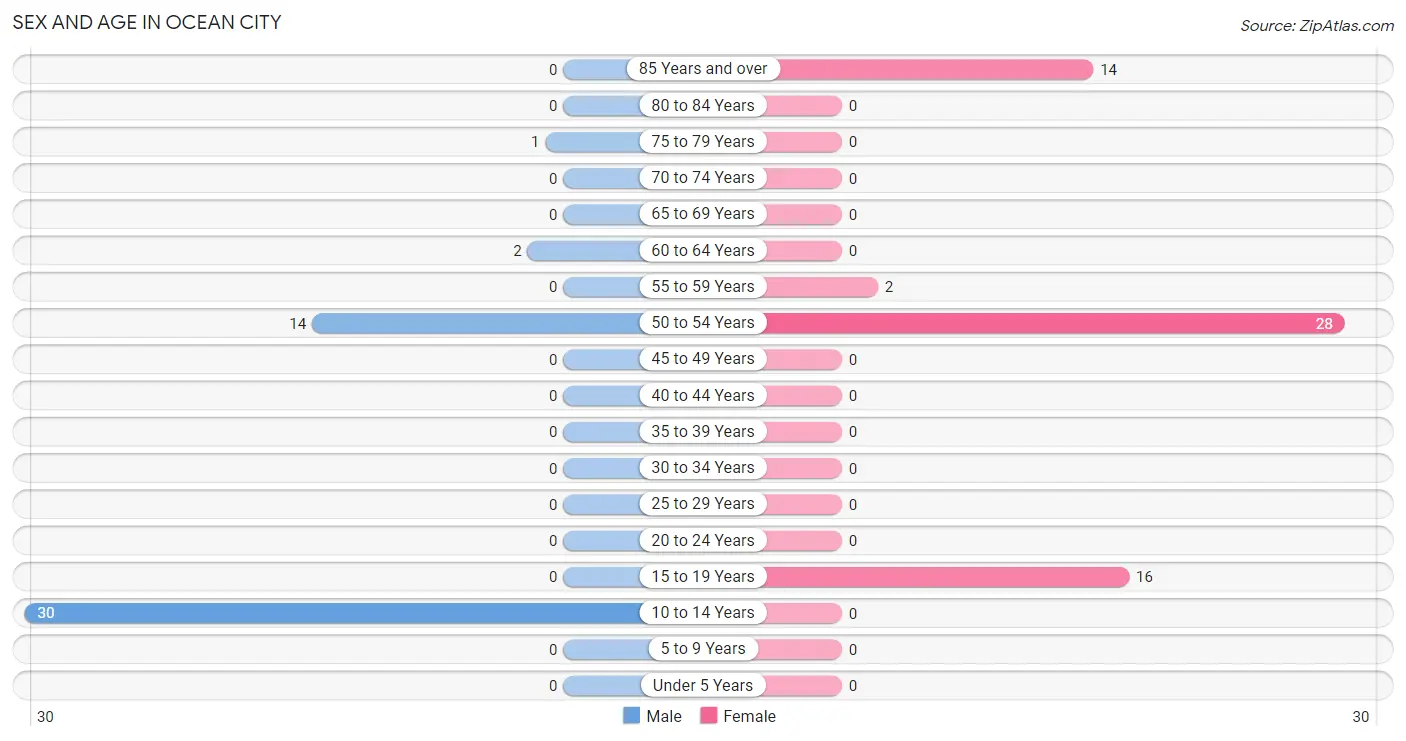
| Age Bracket | Male | Female |
| Under 5 Years | 0 (0.0%) | 0 (0.0%) |
| 5 to 9 Years | 0 (0.0%) | 0 (0.0%) |
| 10 to 14 Years | 30 (63.8%) | 0 (0.0%) |
| 15 to 19 Years | 0 (0.0%) | 16 (26.7%) |
| 20 to 24 Years | 0 (0.0%) | 0 (0.0%) |
| 25 to 29 Years | 0 (0.0%) | 0 (0.0%) |
| 30 to 34 Years | 0 (0.0%) | 0 (0.0%) |
| 35 to 39 Years | 0 (0.0%) | 0 (0.0%) |
| 40 to 44 Years | 0 (0.0%) | 0 (0.0%) |
| 45 to 49 Years | 0 (0.0%) | 0 (0.0%) |
| 50 to 54 Years | 14 (29.8%) | 28 (46.7%) |
| 55 to 59 Years | 0 (0.0%) | 2 (3.3%) |
| 60 to 64 Years | 2 (4.3%) | 0 (0.0%) |
| 65 to 69 Years | 0 (0.0%) | 0 (0.0%) |
| 70 to 74 Years | 0 (0.0%) | 0 (0.0%) |
| 75 to 79 Years | 1 (2.1%) | 0 (0.0%) |
| 80 to 84 Years | 0 (0.0%) | 0 (0.0%) |
| 85 Years and over | 0 (0.0%) | 14 (23.3%) |
| Total | 47 (100.0%) | 60 (100.0%) |
Families and Households in Ocean City
Median Family Size in Ocean City
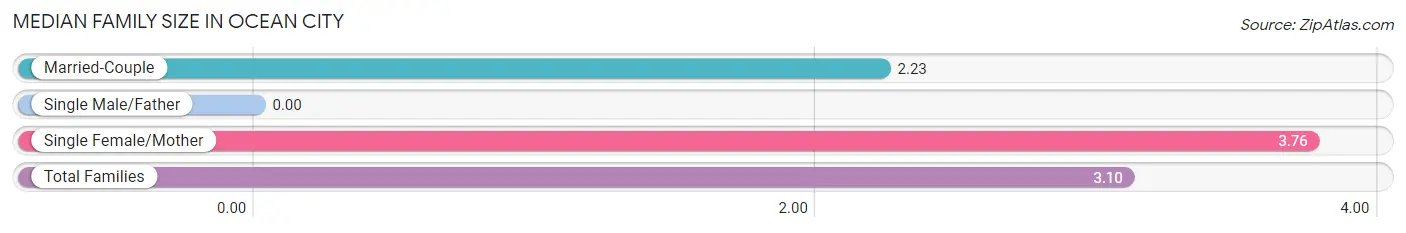
| Family Type | # Families | Family Size |
| Married-Couple | 13 (43.3%) | 2.23 |
| Single Male/Father | 0 (0.0%) | - |
| Single Female/Mother | 17 (56.7%) | 3.76 |
| Total Families | 30 (100.0%) | 3.10 |
Median Household Size in Ocean City
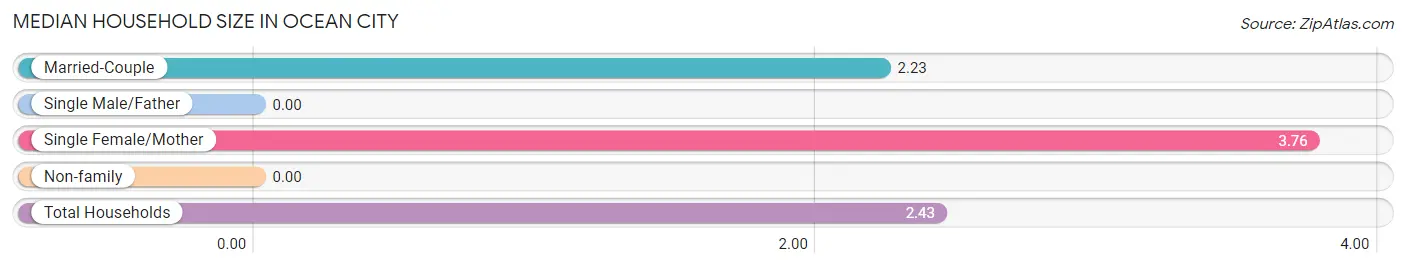
| Household Type | # Households | Household Size |
| Married-Couple | 13 (29.5%) | 2.23 |
| Single Male/Father | 0 (0.0%) | - |
| Single Female/Mother | 17 (38.6%) | 3.76 |
| Non-family | 14 (31.8%) | - |
| Total Households | 44 (100.0%) | 2.43 |
Household Size by Marriage Status in Ocean City
Out of a total of 44 households in Ocean City, 30 (68.2%) are family households, while 14 (31.8%) are nonfamily households. The most numerous type of family households are 4-person households, comprising 17, and the most common type of nonfamily households are 1-person households, comprising 14.
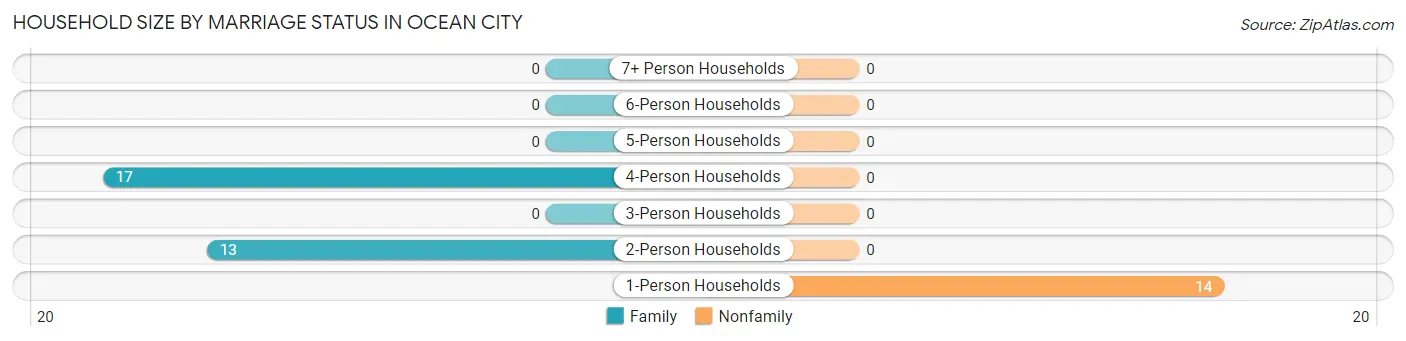
| Household Size | Family Households | Nonfamily Households |
| 1-Person Households | - | 14 (31.8%) |
| 2-Person Households | 13 (29.5%) | 0 (0.0%) |
| 3-Person Households | 0 (0.0%) | 0 (0.0%) |
| 4-Person Households | 17 (38.6%) | 0 (0.0%) |
| 5-Person Households | 0 (0.0%) | 0 (0.0%) |
| 6-Person Households | 0 (0.0%) | 0 (0.0%) |
| 7+ Person Households | 0 (0.0%) | 0 (0.0%) |
| Total | 30 (68.2%) | 14 (31.8%) |
Female Fertility in Ocean City
Fertility by Age in Ocean City
| Age Bracket | Women with Births | Births / 1,000 Women |
| 15 to 19 years | 0 (0.0%) | 0.0 |
| 20 to 34 years | 0 (0.0%) | 0.0 |
| 35 to 50 years | 0 (0.0%) | 0.0 |
| Total | 0 (0.0%) | 0.0 |
Fertility by Age by Marriage Status in Ocean City
| Age Bracket | Married | Unmarried |
| 15 to 19 years | 0 (0.0%) | 0 (0.0%) |
| 20 to 34 years | 0 (0.0%) | 0 (0.0%) |
| 35 to 50 years | 0 (0.0%) | 0 (0.0%) |
| Total | 0 (0.0%) | 0 (0.0%) |
Fertility by Education in Ocean City
| Educational Attainment | Women with Births | Births / 1,000 Women |
| Less than High School | 0 (0.0%) | 0.0 |
| High School Diploma | 0 (0.0%) | 0.0 |
| College or Associate's Degree | 0 (0.0%) | 0.0 |
| Bachelor's Degree | 0 (0.0%) | 0.0 |
| Graduate Degree | 0 (0.0%) | 0.0 |
| Total | 0 (0.0%) | 0.0 |
Fertility by Education by Marriage Status in Ocean City
| Educational Attainment | Married | Unmarried |
| Less than High School | 0 (0.0%) | 0 (0.0%) |
| High School Diploma | 0 (0.0%) | 0 (0.0%) |
| College or Associate's Degree | 0 (0.0%) | 0 (0.0%) |
| Bachelor's Degree | 0 (0.0%) | 0 (0.0%) |
| Graduate Degree | 0 (0.0%) | 0 (0.0%) |
| Total | 0 (0.0%) | 0 (0.0%) |
Employment Characteristics in Ocean City
Employment by Class of Employer in Ocean City
Among the 46 employed individuals in Ocean City, , and private company employees (46 | 100.0%) make up the most common classes of employment.
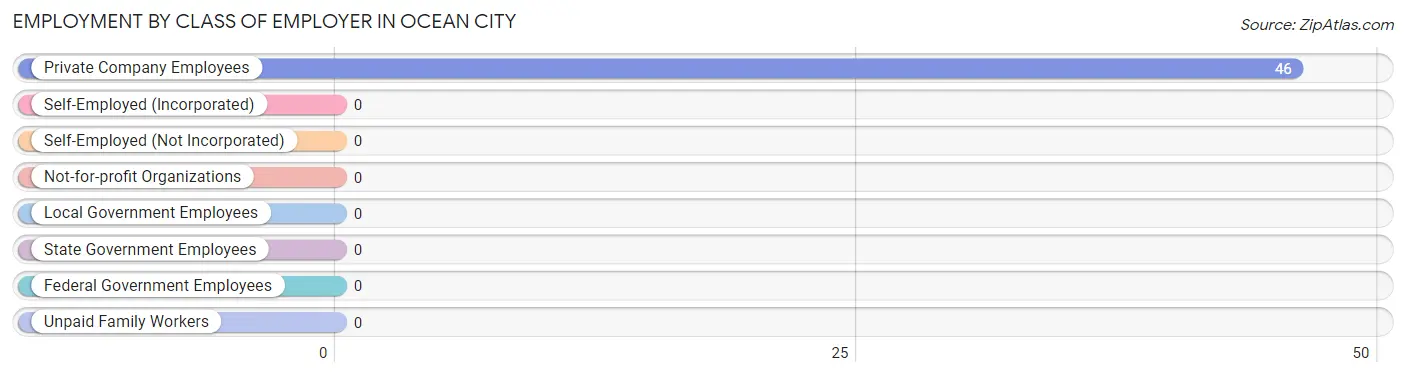
| Employer Class | # Employees | % Employees |
| Private Company Employees | 46 | 100.0% |
| Self-Employed (Incorporated) | 0 | 0.0% |
| Self-Employed (Not Incorporated) | 0 | 0.0% |
| Not-for-profit Organizations | 0 | 0.0% |
| Local Government Employees | 0 | 0.0% |
| State Government Employees | 0 | 0.0% |
| Federal Government Employees | 0 | 0.0% |
| Unpaid Family Workers | 0 | 0.0% |
| Total | 46 | 100.0% |
Employment Status by Age in Ocean City
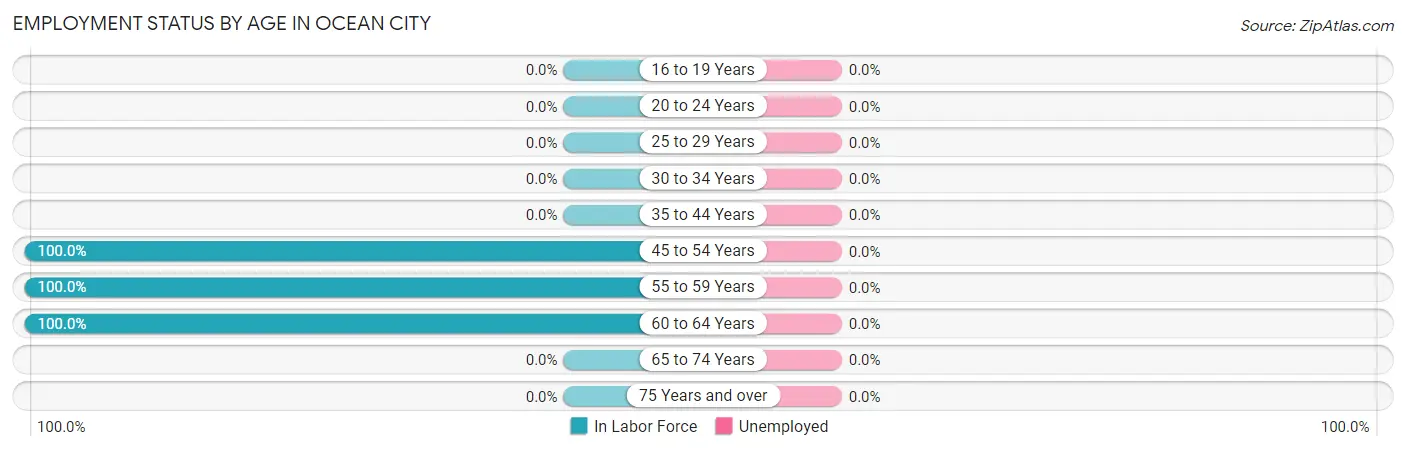
| Age Bracket | In Labor Force | Unemployed |
| 16 to 19 Years | 0 (0.0%) | 0 (0.0%) |
| 20 to 24 Years | 0 (0.0%) | 0 (0.0%) |
| 25 to 29 Years | 0 (0.0%) | 0 (0.0%) |
| 30 to 34 Years | 0 (0.0%) | 0 (0.0%) |
| 35 to 44 Years | 0 (0.0%) | 0 (0.0%) |
| 45 to 54 Years | 42 (100.0%) | 0 (0.0%) |
| 55 to 59 Years | 2 (100.0%) | 0 (0.0%) |
| 60 to 64 Years | 2 (100.0%) | 0 (0.0%) |
| 65 to 74 Years | 0 (0.0%) | 0 (0.0%) |
| 75 Years and over | 0 (0.0%) | 0 (0.0%) |
| Total | 46 (59.7%) | 0 (0.0%) |
Employment Status by Educational Attainment in Ocean City
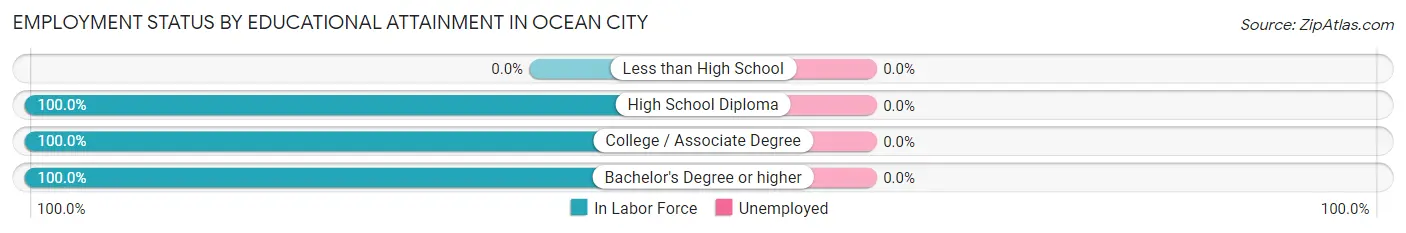
| Educational Attainment | In Labor Force | Unemployed |
| Less than High School | 0 (0.0%) | 0 (0.0%) |
| High School Diploma | 31 (100.0%) | 0 (0.0%) |
| College / Associate Degree | 2 (100.0%) | 0 (0.0%) |
| Bachelor's Degree or higher | 13 (100.0%) | 0 (0.0%) |
| Total | 46 (100.0%) | 0 (0.0%) |
Employment Occupations by Sex in Ocean City
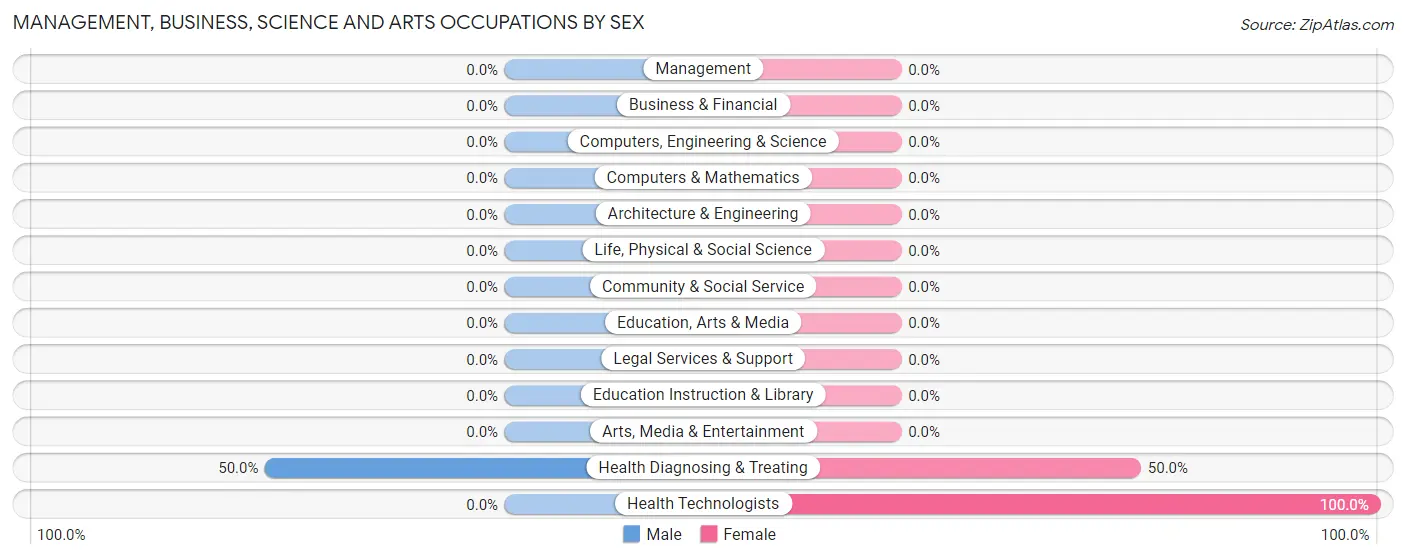
Management, Business, Science and Arts Occupations
The most common Management, Business, Science and Arts occupations in Ocean City are Health Diagnosing & Treating (4 | 8.7%), and Health Technologists (2 | 4.3%).
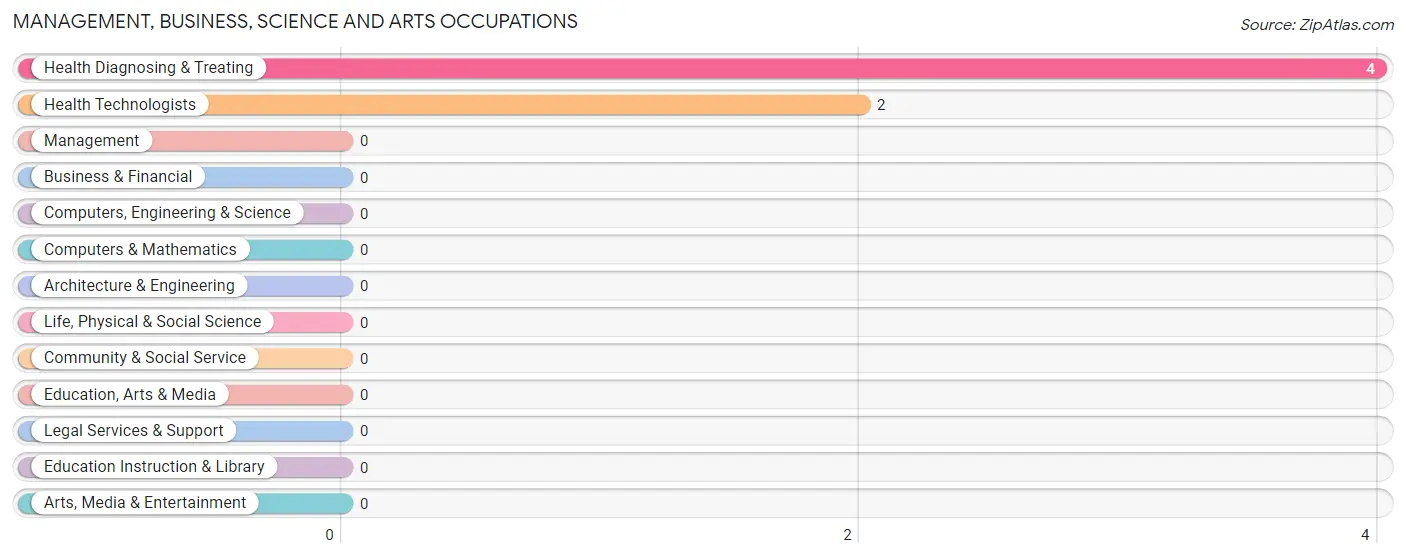
Management, Business, Science and Arts Occupations by Sex
| Occupation | Male | Female |
| Management | 0 (0.0%) | 0 (0.0%) |
| Business & Financial | 0 (0.0%) | 0 (0.0%) |
| Computers, Engineering & Science | 0 (0.0%) | 0 (0.0%) |
| Computers & Mathematics | 0 (0.0%) | 0 (0.0%) |
| Architecture & Engineering | 0 (0.0%) | 0 (0.0%) |
| Life, Physical & Social Science | 0 (0.0%) | 0 (0.0%) |
| Community & Social Service | 0 (0.0%) | 0 (0.0%) |
| Education, Arts & Media | 0 (0.0%) | 0 (0.0%) |
| Legal Services & Support | 0 (0.0%) | 0 (0.0%) |
| Education Instruction & Library | 0 (0.0%) | 0 (0.0%) |
| Arts, Media & Entertainment | 0 (0.0%) | 0 (0.0%) |
| Health Diagnosing & Treating | 2 (50.0%) | 2 (50.0%) |
| Health Technologists | 0 (0.0%) | 2 (100.0%) |
| Total (Category) | 2 (50.0%) | 2 (50.0%) |
| Total (Overall) | 16 (34.8%) | 30 (65.2%) |
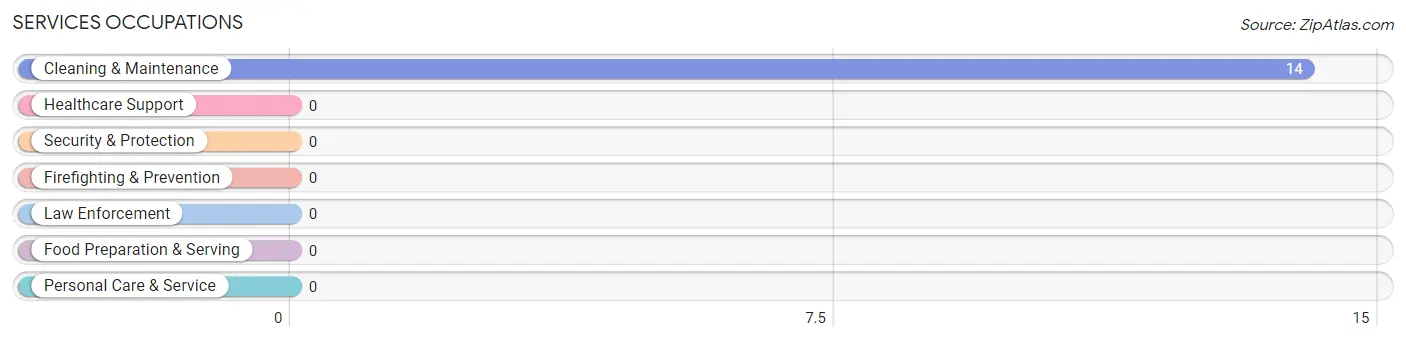
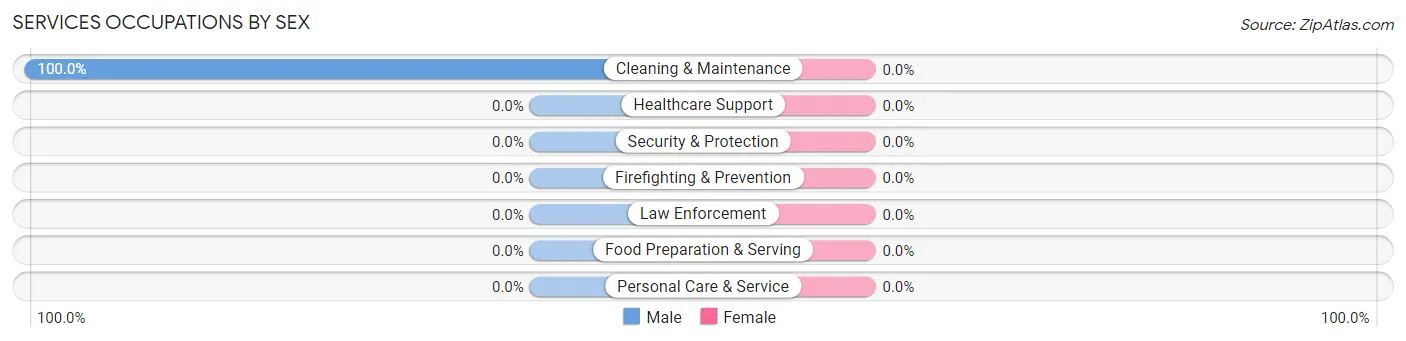
Services Occupations
The most common Services occupations in Ocean City are , and Cleaning & Maintenance (14 | 30.4%).
Services Occupations by Sex
| Occupation | Male | Female |
| Healthcare Support | 0 (0.0%) | 0 (0.0%) |
| Security & Protection | 0 (0.0%) | 0 (0.0%) |
| Firefighting & Prevention | 0 (0.0%) | 0 (0.0%) |
| Law Enforcement | 0 (0.0%) | 0 (0.0%) |
| Food Preparation & Serving | 0 (0.0%) | 0 (0.0%) |
| Cleaning & Maintenance | 14 (100.0%) | 0 (0.0%) |
| Personal Care & Service | 0 (0.0%) | 0 (0.0%) |
| Total (Category) | 14 (100.0%) | 0 (0.0%) |
| Total (Overall) | 16 (34.8%) | 30 (65.2%) |
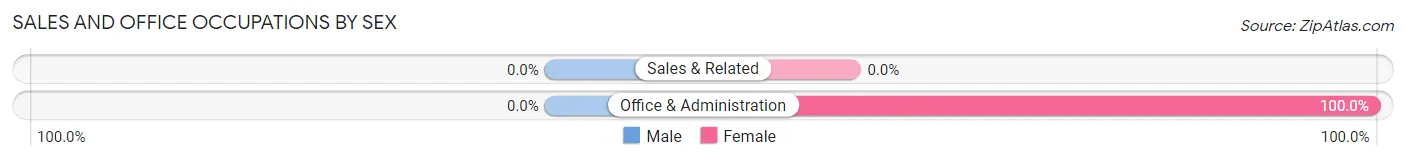
Sales and Office Occupations
The most common Sales and Office occupations in Ocean City are , and Office & Administration (11 | 23.9%).
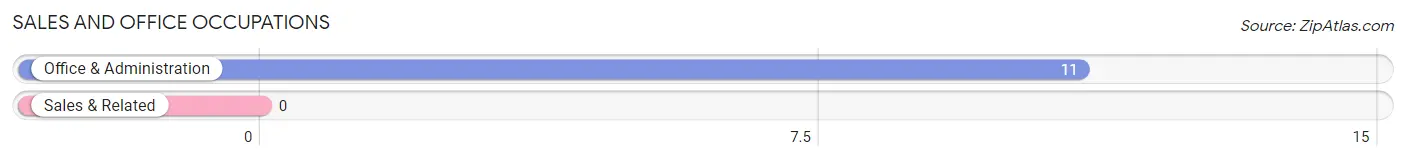
Sales and Office Occupations by Sex
| Occupation | Male | Female |
| Sales & Related | 0 (0.0%) | 0 (0.0%) |
| Office & Administration | 0 (0.0%) | 11 (100.0%) |
| Total (Category) | 0 (0.0%) | 11 (100.0%) |
| Total (Overall) | 16 (34.8%) | 30 (65.2%) |
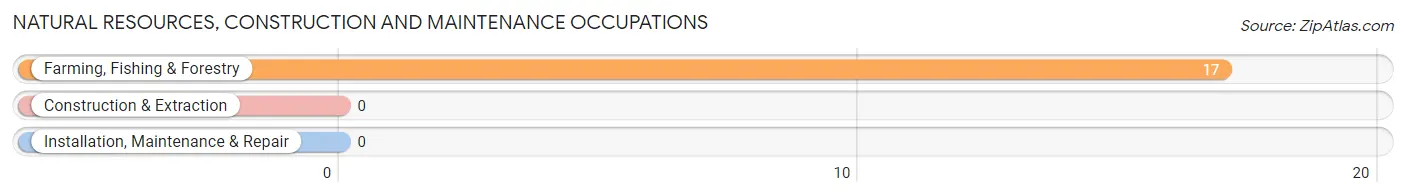
Natural Resources, Construction and Maintenance Occupations
The most common Natural Resources, Construction and Maintenance occupations in Ocean City are , and Farming, Fishing & Forestry (17 | 37.0%).
Natural Resources, Construction and Maintenance Occupations by Sex
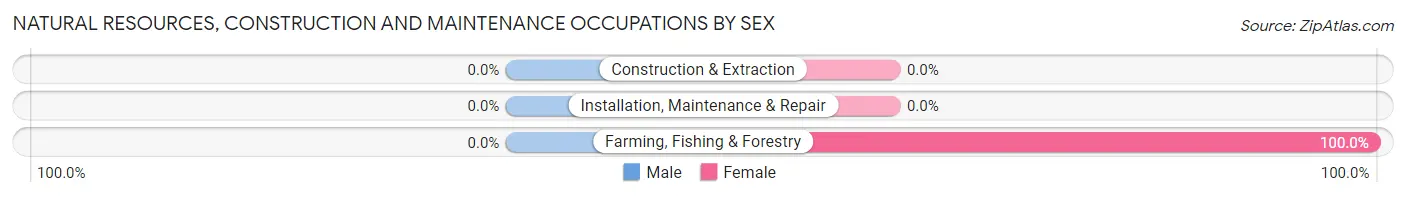
| Occupation | Male | Female |
| Farming, Fishing & Forestry | 0 (0.0%) | 17 (100.0%) |
| Construction & Extraction | 0 (0.0%) | 0 (0.0%) |
| Installation, Maintenance & Repair | 0 (0.0%) | 0 (0.0%) |
| Total (Category) | 0 (0.0%) | 17 (100.0%) |
| Total (Overall) | 16 (34.8%) | 30 (65.2%) |
Production, Transportation and Moving Occupations
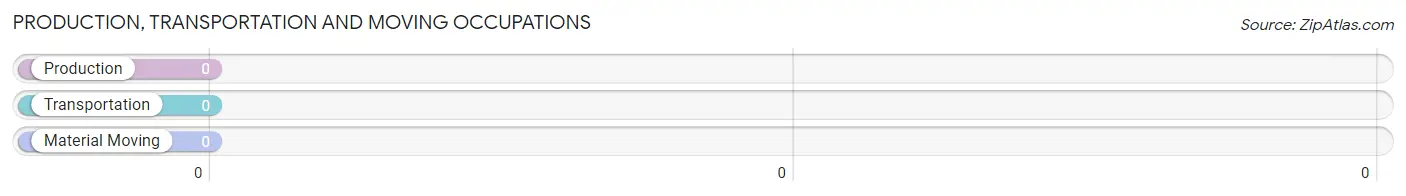
Production, Transportation and Moving Occupations by Sex
| Occupation | Male | Female |
| Production | 0 (0.0%) | 0 (0.0%) |
| Transportation | 0 (0.0%) | 0 (0.0%) |
| Material Moving | 0 (0.0%) | 0 (0.0%) |
| Total (Category) | 0 (0.0%) | 0 (0.0%) |
| Total (Overall) | 16 (34.8%) | 30 (65.2%) |
Employment Industries by Sex in Ocean City
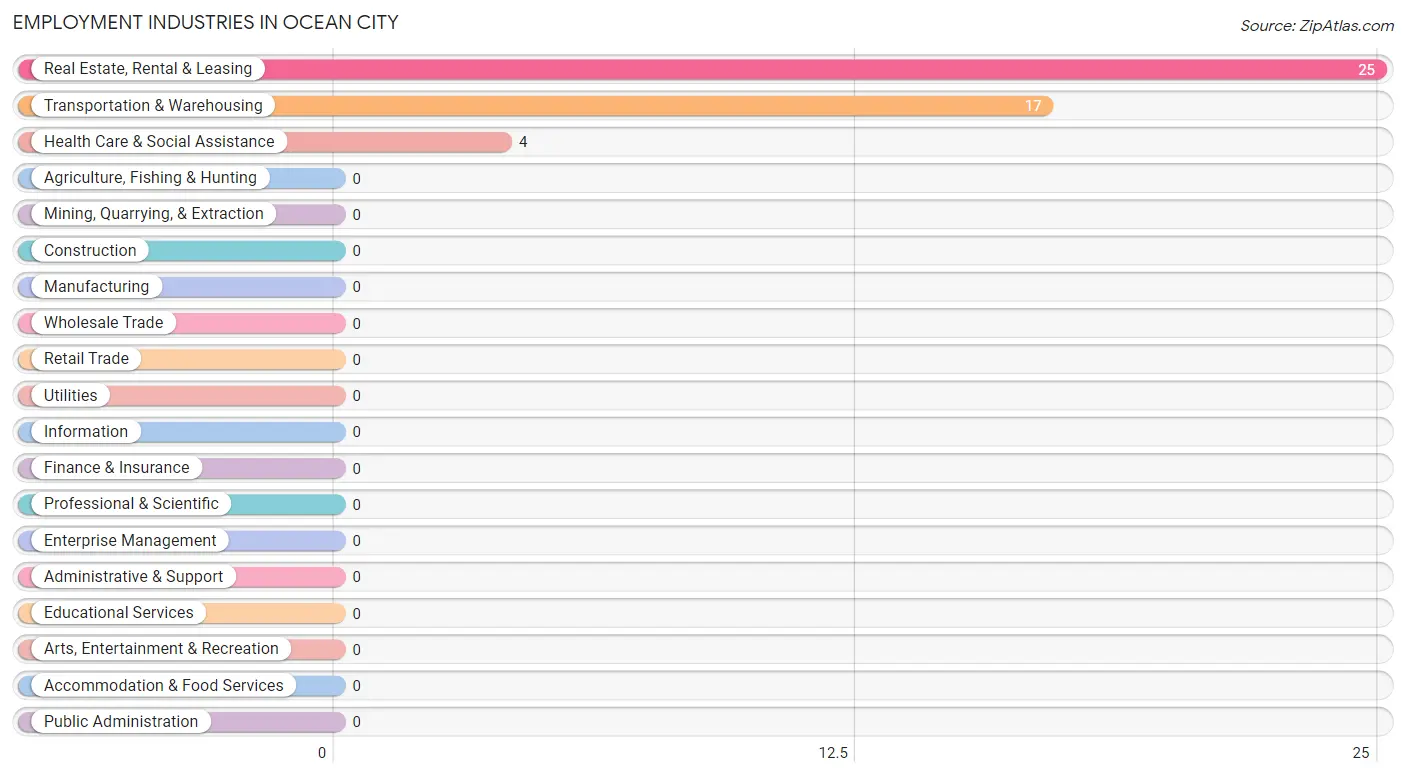
Employment Industries in Ocean City
The major employment industries in Ocean City include Real Estate, Rental & Leasing (25 | 54.3%), Transportation & Warehousing (17 | 37.0%), and Health Care & Social Assistance (4 | 8.7%).
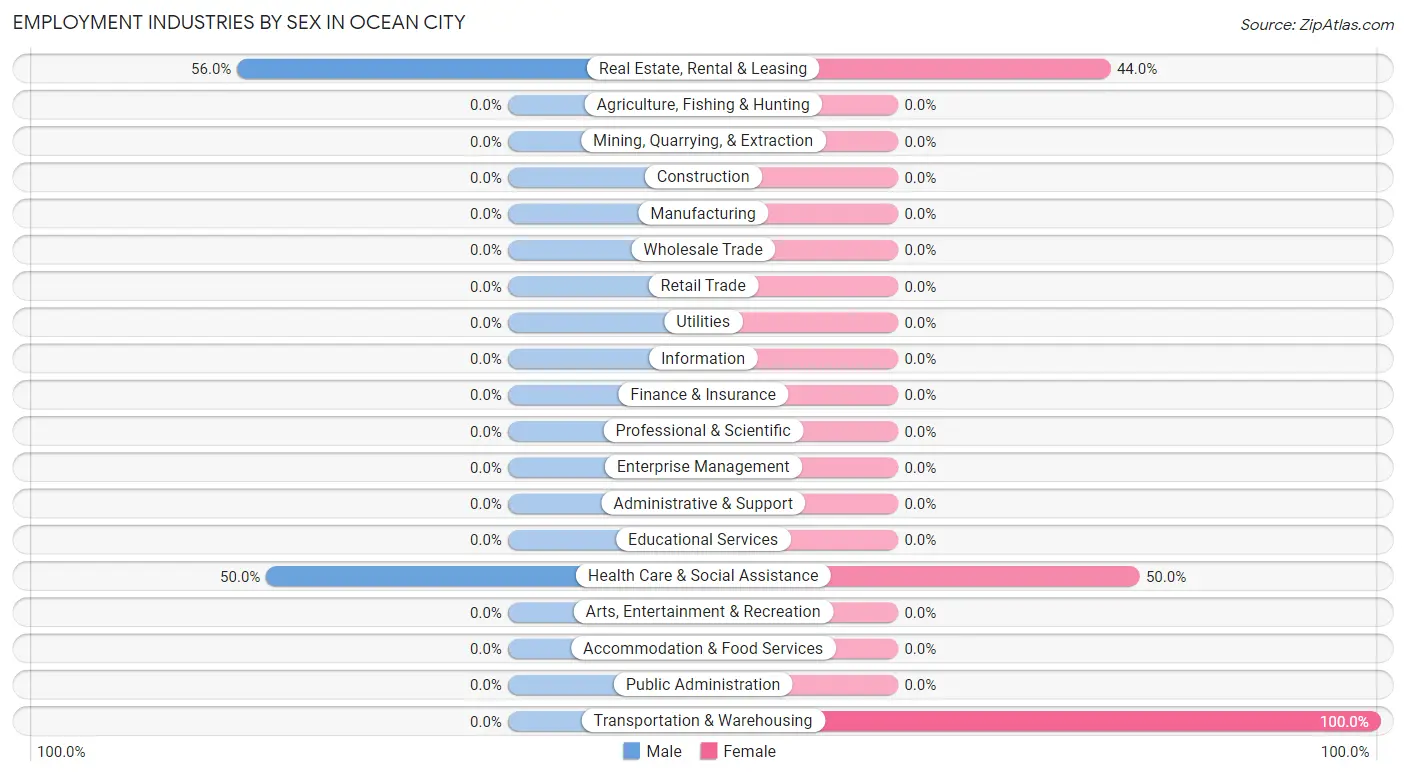
Employment Industries by Sex in Ocean City
The Ocean City industries that see more men than women are Real Estate, Rental & Leasing (56.0%), and Health Care & Social Assistance (50.0%), whereas the industries that tend to have a higher number of women are Transportation & Warehousing (100.0%), Health Care & Social Assistance (50.0%), and Real Estate, Rental & Leasing (44.0%).
| Industry | Male | Female |
| Agriculture, Fishing & Hunting | 0 (0.0%) | 0 (0.0%) |
| Mining, Quarrying, & Extraction | 0 (0.0%) | 0 (0.0%) |
| Construction | 0 (0.0%) | 0 (0.0%) |
| Manufacturing | 0 (0.0%) | 0 (0.0%) |
| Wholesale Trade | 0 (0.0%) | 0 (0.0%) |
| Retail Trade | 0 (0.0%) | 0 (0.0%) |
| Transportation & Warehousing | 0 (0.0%) | 17 (100.0%) |
| Utilities | 0 (0.0%) | 0 (0.0%) |
| Information | 0 (0.0%) | 0 (0.0%) |
| Finance & Insurance | 0 (0.0%) | 0 (0.0%) |
| Real Estate, Rental & Leasing | 14 (56.0%) | 11 (44.0%) |
| Professional & Scientific | 0 (0.0%) | 0 (0.0%) |
| Enterprise Management | 0 (0.0%) | 0 (0.0%) |
| Administrative & Support | 0 (0.0%) | 0 (0.0%) |
| Educational Services | 0 (0.0%) | 0 (0.0%) |
| Health Care & Social Assistance | 2 (50.0%) | 2 (50.0%) |
| Arts, Entertainment & Recreation | 0 (0.0%) | 0 (0.0%) |
| Accommodation & Food Services | 0 (0.0%) | 0 (0.0%) |
| Public Administration | 0 (0.0%) | 0 (0.0%) |
| Total | 16 (34.8%) | 30 (65.2%) |
Education in Ocean City
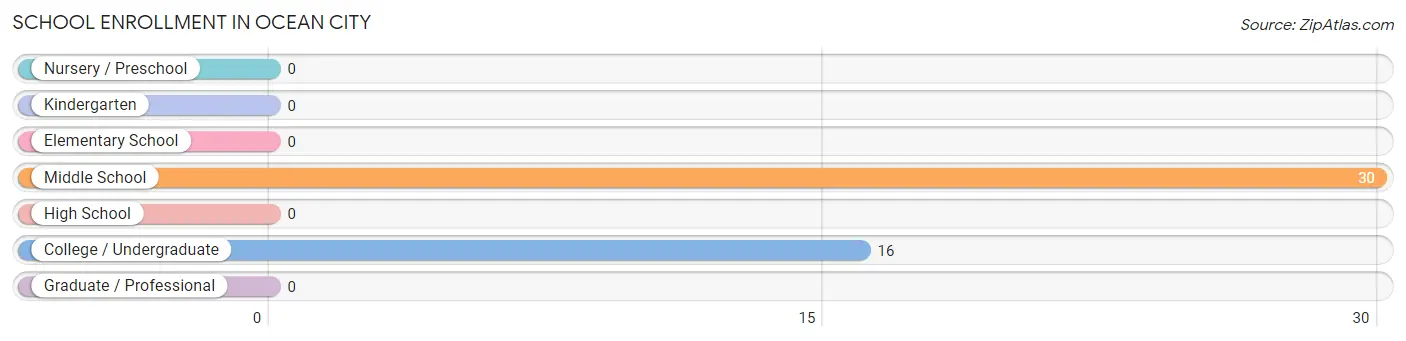
School Enrollment in Ocean City
The most common levels of schooling among the 46 students in Ocean City are middle school (30 | 65.2%), and college / undergraduate (16 | 34.8%).
| School Level | # Students | % Students |
| Nursery / Preschool | 0 | 0.0% |
| Kindergarten | 0 | 0.0% |
| Elementary School | 0 | 0.0% |
| Middle School | 30 | 65.2% |
| High School | 0 | 0.0% |
| College / Undergraduate | 16 | 34.8% |
| Graduate / Professional | 0 | 0.0% |
| Total | 46 | 100.0% |
School Enrollment by Age by Funding Source in Ocean City
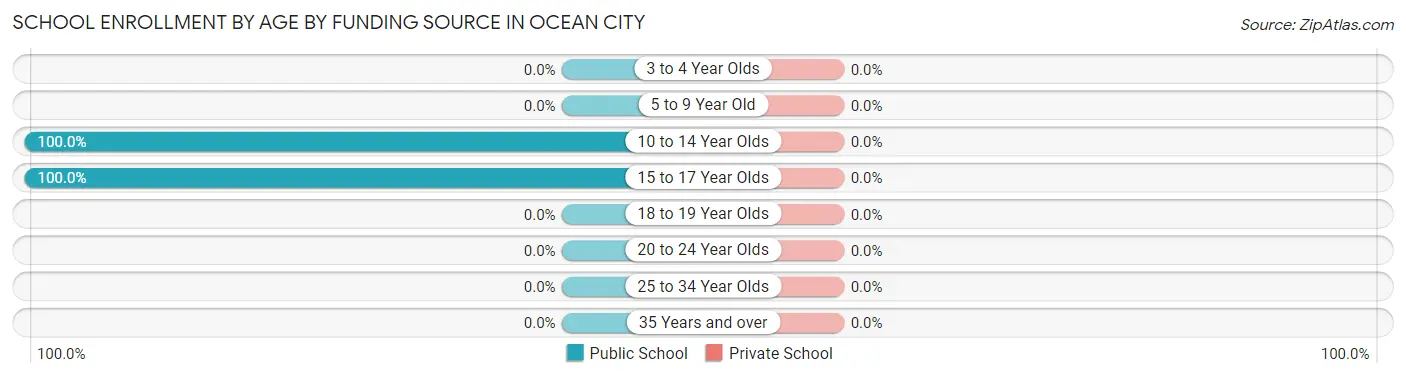
| Age Bracket | Public School | Private School |
| 3 to 4 Year Olds | 0 (0.0%) | 0 (0.0%) |
| 5 to 9 Year Old | 0 (0.0%) | 0 (0.0%) |
| 10 to 14 Year Olds | 30 (100.0%) | 0 (0.0%) |
| 15 to 17 Year Olds | 16 (100.0%) | 0 (0.0%) |
| 18 to 19 Year Olds | 0 (0.0%) | 0 (0.0%) |
| 20 to 24 Year Olds | 0 (0.0%) | 0 (0.0%) |
| 25 to 34 Year Olds | 0 (0.0%) | 0 (0.0%) |
| 35 Years and over | 0 (0.0%) | 0 (0.0%) |
| Total | 46 (100.0%) | 0 (0.0%) |
Educational Attainment by Field of Study in Ocean City
Liberal arts & history (11 | 84.6%), and science & technology (2 | 15.4%) are the most common fields of study among 13 individuals in Ocean City who have obtained a bachelor's degree or higher.
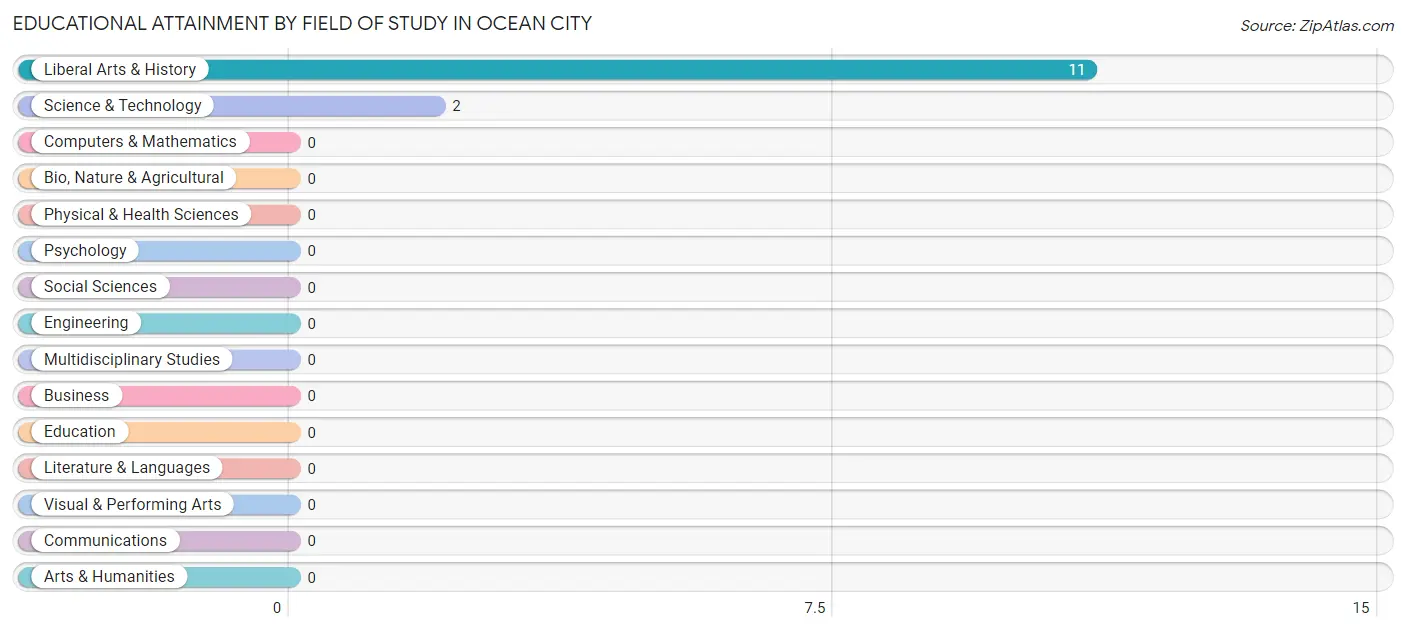
| Field of Study | # Graduates | % Graduates |
| Computers & Mathematics | 0 | 0.0% |
| Bio, Nature & Agricultural | 0 | 0.0% |
| Physical & Health Sciences | 0 | 0.0% |
| Psychology | 0 | 0.0% |
| Social Sciences | 0 | 0.0% |
| Engineering | 0 | 0.0% |
| Multidisciplinary Studies | 0 | 0.0% |
| Science & Technology | 2 | 15.4% |
| Business | 0 | 0.0% |
| Education | 0 | 0.0% |
| Literature & Languages | 0 | 0.0% |
| Liberal Arts & History | 11 | 84.6% |
| Visual & Performing Arts | 0 | 0.0% |
| Communications | 0 | 0.0% |
| Arts & Humanities | 0 | 0.0% |
| Total | 13 | 100.0% |
Transportation & Commute in Ocean City
Vehicle Availability by Sex in Ocean City
The most prevalent vehicle ownership categories in Ocean City are males with 2 vehicles (14, accounting for 87.5%) and females with 2 vehicles (11, making up 46.7%).
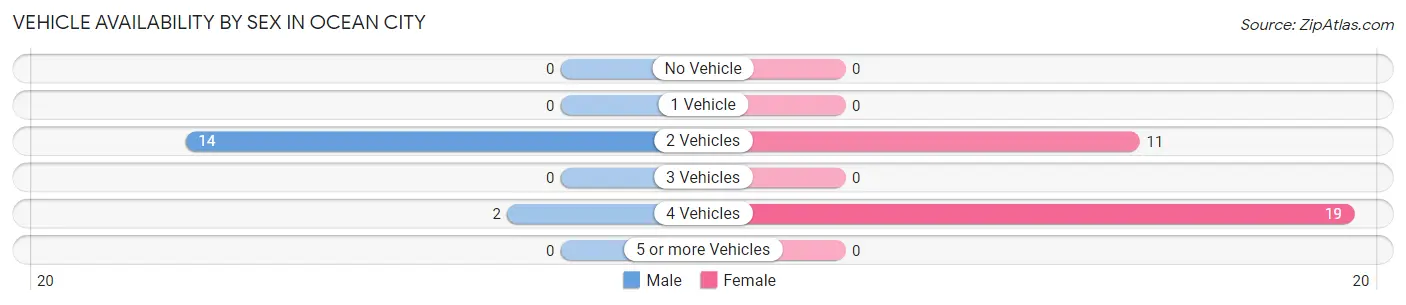
| Vehicles Available | Male | Female |
| No Vehicle | 0 (0.0%) | 0 (0.0%) |
| 1 Vehicle | 0 (0.0%) | 0 (0.0%) |
| 2 Vehicles | 14 (87.5%) | 11 (36.7%) |
| 3 Vehicles | 0 (0.0%) | 0 (0.0%) |
| 4 Vehicles | 2 (12.5%) | 19 (63.3%) |
| 5 or more Vehicles | 0 (0.0%) | 0 (0.0%) |
| Total | 16 (100.0%) | 30 (100.0%) |
Commute Time in Ocean City
The most frequently occuring commute durations in Ocean City are 10 to 14 minutes (25 commuters, 54.3%), 15 to 19 minutes (17 commuters, 37.0%), and 30 to 34 minutes (2 commuters, 4.3%).
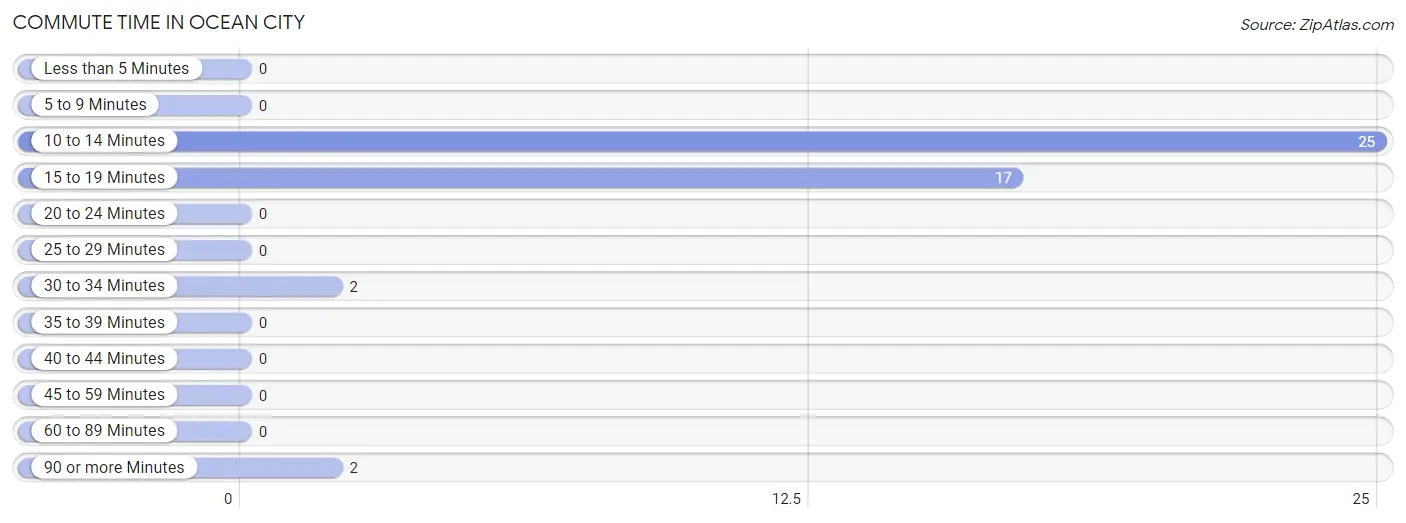
| Commute Time | # Commuters | % Commuters |
| Less than 5 Minutes | 0 | 0.0% |
| 5 to 9 Minutes | 0 | 0.0% |
| 10 to 14 Minutes | 25 | 54.3% |
| 15 to 19 Minutes | 17 | 37.0% |
| 20 to 24 Minutes | 0 | 0.0% |
| 25 to 29 Minutes | 0 | 0.0% |
| 30 to 34 Minutes | 2 | 4.3% |
| 35 to 39 Minutes | 0 | 0.0% |
| 40 to 44 Minutes | 0 | 0.0% |
| 45 to 59 Minutes | 0 | 0.0% |
| 60 to 89 Minutes | 0 | 0.0% |
| 90 or more Minutes | 2 | 4.3% |
Commute Time by Sex in Ocean City
The most common commute times in Ocean City are 10 to 14 minutes (14 commuters, 87.5%) for males and 15 to 19 minutes (17 commuters, 56.7%) for females.
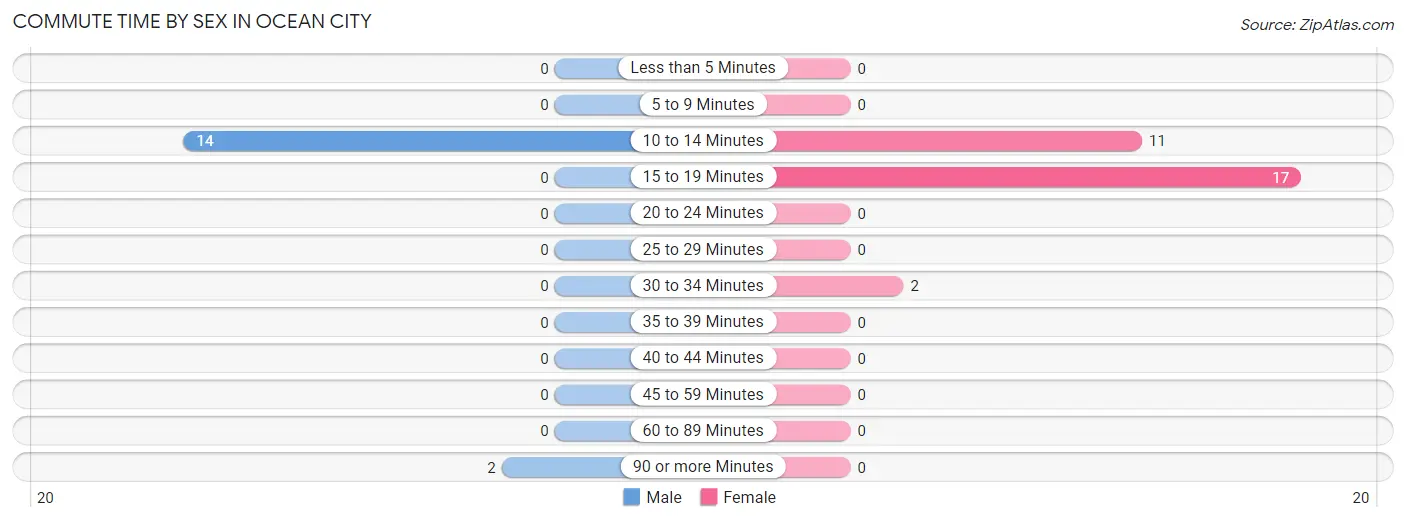
| Commute Time | Male | Female |
| Less than 5 Minutes | 0 (0.0%) | 0 (0.0%) |
| 5 to 9 Minutes | 0 (0.0%) | 0 (0.0%) |
| 10 to 14 Minutes | 14 (87.5%) | 11 (36.7%) |
| 15 to 19 Minutes | 0 (0.0%) | 17 (56.7%) |
| 20 to 24 Minutes | 0 (0.0%) | 0 (0.0%) |
| 25 to 29 Minutes | 0 (0.0%) | 0 (0.0%) |
| 30 to 34 Minutes | 0 (0.0%) | 2 (6.7%) |
| 35 to 39 Minutes | 0 (0.0%) | 0 (0.0%) |
| 40 to 44 Minutes | 0 (0.0%) | 0 (0.0%) |
| 45 to 59 Minutes | 0 (0.0%) | 0 (0.0%) |
| 60 to 89 Minutes | 0 (0.0%) | 0 (0.0%) |
| 90 or more Minutes | 2 (12.5%) | 0 (0.0%) |
Time of Departure to Work by Sex in Ocean City
The most frequent times of departure to work in Ocean City are 8:30 AM to 8:59 AM (14, 87.5%) for males and 6:30 AM to 6:59 AM (17, 56.7%) for females.
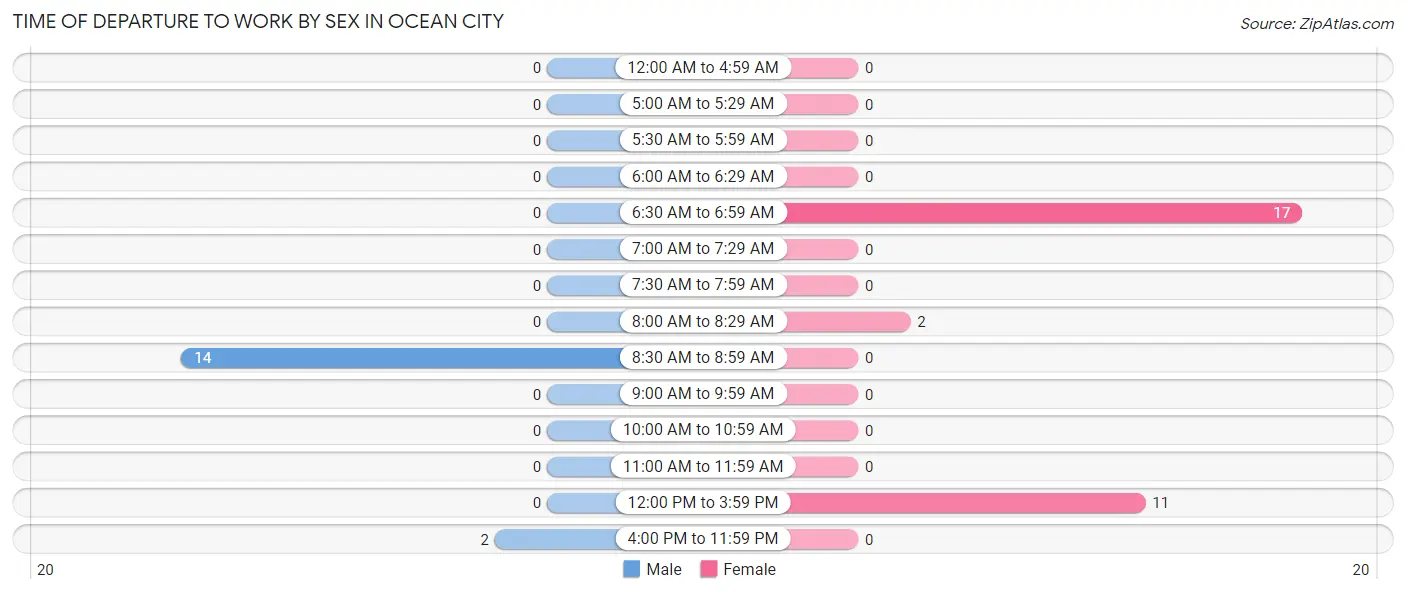
| Time of Departure | Male | Female |
| 12:00 AM to 4:59 AM | 0 (0.0%) | 0 (0.0%) |
| 5:00 AM to 5:29 AM | 0 (0.0%) | 0 (0.0%) |
| 5:30 AM to 5:59 AM | 0 (0.0%) | 0 (0.0%) |
| 6:00 AM to 6:29 AM | 0 (0.0%) | 0 (0.0%) |
| 6:30 AM to 6:59 AM | 0 (0.0%) | 17 (56.7%) |
| 7:00 AM to 7:29 AM | 0 (0.0%) | 0 (0.0%) |
| 7:30 AM to 7:59 AM | 0 (0.0%) | 0 (0.0%) |
| 8:00 AM to 8:29 AM | 0 (0.0%) | 2 (6.7%) |
| 8:30 AM to 8:59 AM | 14 (87.5%) | 0 (0.0%) |
| 9:00 AM to 9:59 AM | 0 (0.0%) | 0 (0.0%) |
| 10:00 AM to 10:59 AM | 0 (0.0%) | 0 (0.0%) |
| 11:00 AM to 11:59 AM | 0 (0.0%) | 0 (0.0%) |
| 12:00 PM to 3:59 PM | 0 (0.0%) | 11 (36.7%) |
| 4:00 PM to 11:59 PM | 2 (12.5%) | 0 (0.0%) |
| Total | 16 (100.0%) | 30 (100.0%) |
Housing Occupancy in Ocean City
Occupancy by Ownership in Ocean City
Of the total 44 dwellings in Ocean City, owner-occupied units account for 44 (100.0%), while renter-occupied units make up 0 (0.0%).
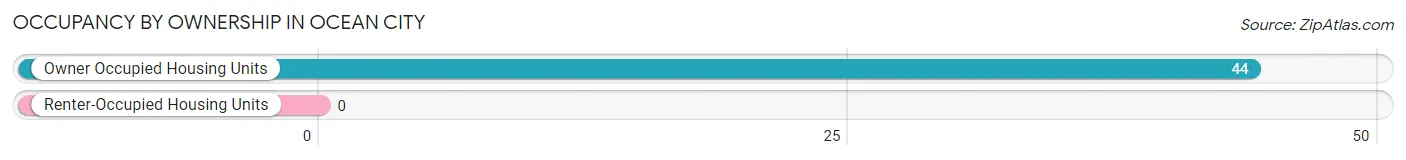
| Occupancy | # Housing Units | % Housing Units |
| Owner Occupied Housing Units | 44 | 100.0% |
| Renter-Occupied Housing Units | 0 | 0.0% |
| Total Occupied Housing Units | 44 | 100.0% |
Occupancy by Household Size in Ocean City
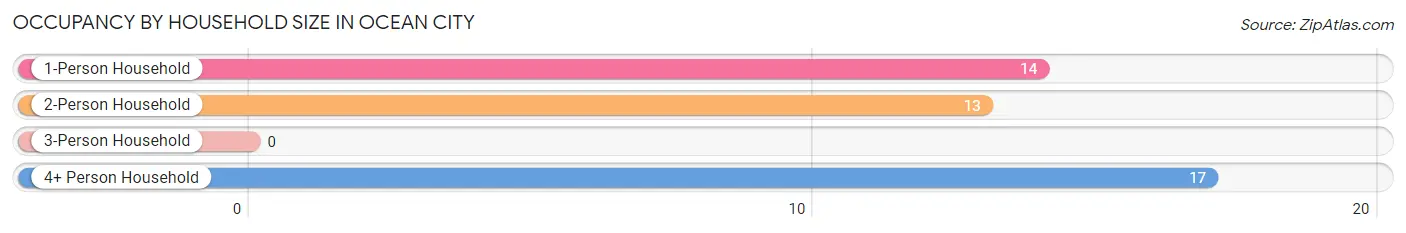
| Household Size | # Housing Units | % Housing Units |
| 1-Person Household | 14 | 31.8% |
| 2-Person Household | 13 | 29.5% |
| 3-Person Household | 0 | 0.0% |
| 4+ Person Household | 17 | 38.6% |
| Total Housing Units | 44 | 100.0% |
Occupancy by Ownership by Household Size in Ocean City
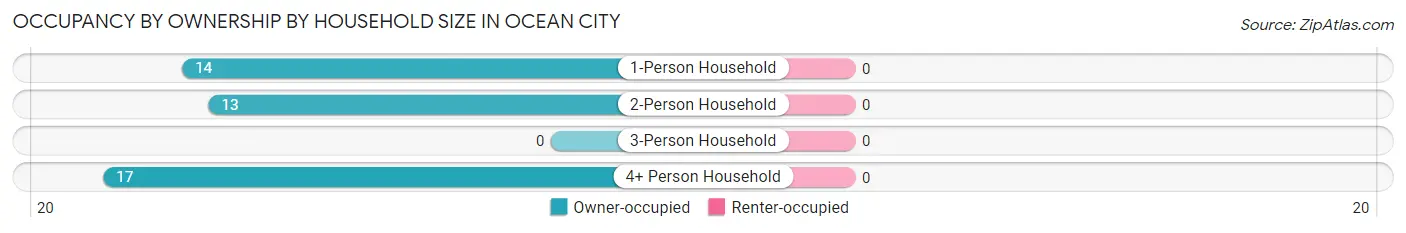
| Household Size | Owner-occupied | Renter-occupied |
| 1-Person Household | 14 (100.0%) | 0 (0.0%) |
| 2-Person Household | 13 (100.0%) | 0 (0.0%) |
| 3-Person Household | 0 (0.0%) | 0 (0.0%) |
| 4+ Person Household | 17 (100.0%) | 0 (0.0%) |
| Total Housing Units | 44 (100.0%) | 0 (0.0%) |
Occupancy by Educational Attainment in Ocean City
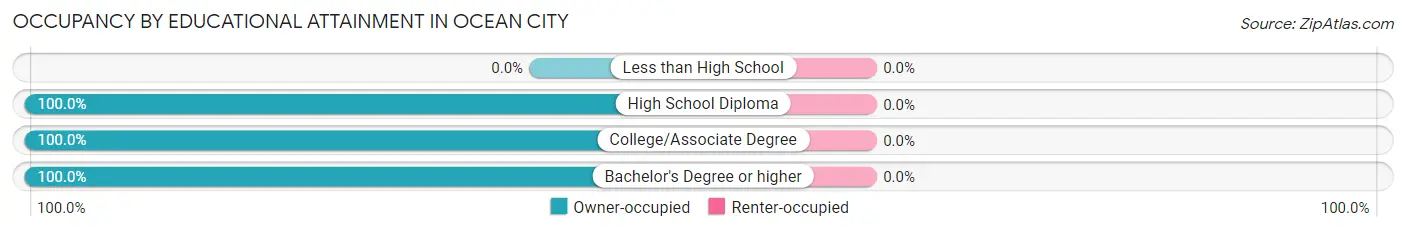
| Household Size | Owner-occupied | Renter-occupied |
| Less than High School | 0 (0.0%) | 0 (0.0%) |
| High School Diploma | 31 (100.0%) | 0 (0.0%) |
| College/Associate Degree | 2 (100.0%) | 0 (0.0%) |
| Bachelor's Degree or higher | 11 (100.0%) | 0 (0.0%) |
Occupancy by Age of Householder in Ocean City
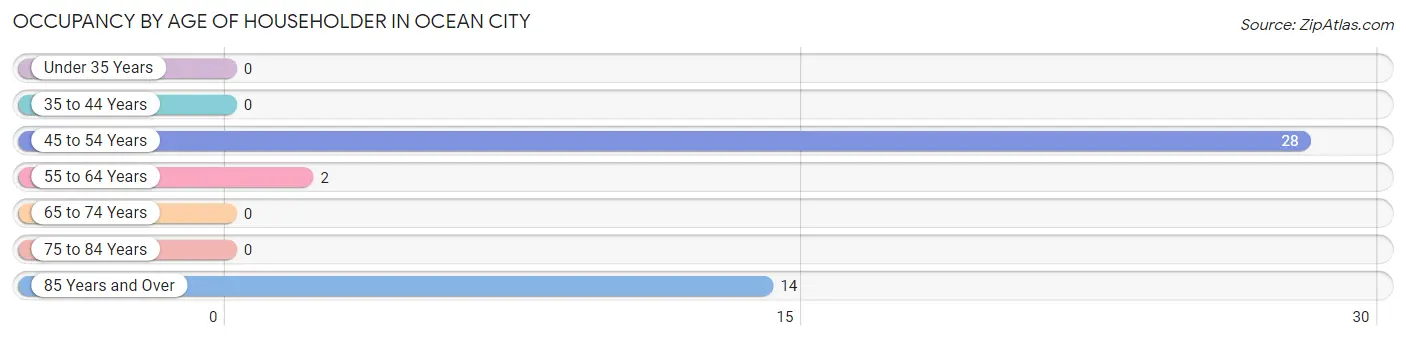
| Age Bracket | # Households | % Households |
| Under 35 Years | 0 | 0.0% |
| 35 to 44 Years | 0 | 0.0% |
| 45 to 54 Years | 28 | 63.6% |
| 55 to 64 Years | 2 | 4.5% |
| 65 to 74 Years | 0 | 0.0% |
| 75 to 84 Years | 0 | 0.0% |
| 85 Years and Over | 14 | 31.8% |
| Total | 44 | 100.0% |
Housing Finances in Ocean City
Median Income by Occupancy in Ocean City
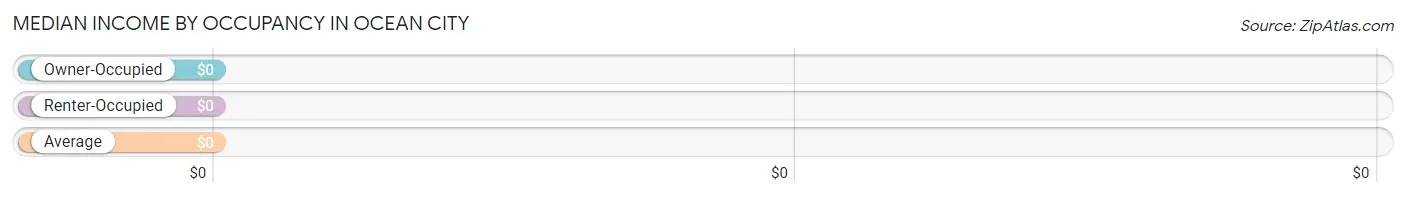
| Occupancy Type | # Households | Median Income |
| Owner-Occupied | 44 (100.0%) | $0 |
| Renter-Occupied | 0 (0.0%) | $0 |
| Average | 44 (100.0%) | $0 |
Occupancy by Householder Income Bracket in Ocean City
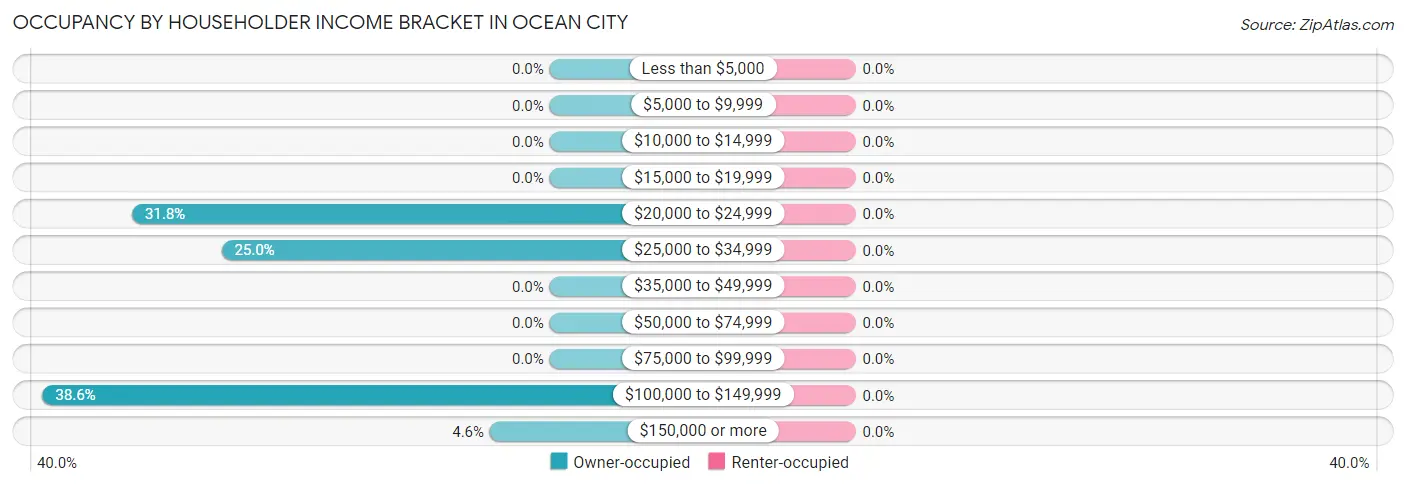
| Income Bracket | Owner-occupied | Renter-occupied |
| Less than $5,000 | 0 (0.0%) | 0 (0.0%) |
| $5,000 to $9,999 | 0 (0.0%) | 0 (0.0%) |
| $10,000 to $14,999 | 0 (0.0%) | 0 (0.0%) |
| $15,000 to $19,999 | 0 (0.0%) | 0 (0.0%) |
| $20,000 to $24,999 | 14 (31.8%) | 0 (0.0%) |
| $25,000 to $34,999 | 11 (25.0%) | 0 (0.0%) |
| $35,000 to $49,999 | 0 (0.0%) | 0 (0.0%) |
| $50,000 to $74,999 | 0 (0.0%) | 0 (0.0%) |
| $75,000 to $99,999 | 0 (0.0%) | 0 (0.0%) |
| $100,000 to $149,999 | 17 (38.6%) | 0 (0.0%) |
| $150,000 or more | 2 (4.5%) | 0 (0.0%) |
| Total | 44 (100.0%) | 0 (0.0%) |
Monthly Housing Cost Tiers in Ocean City
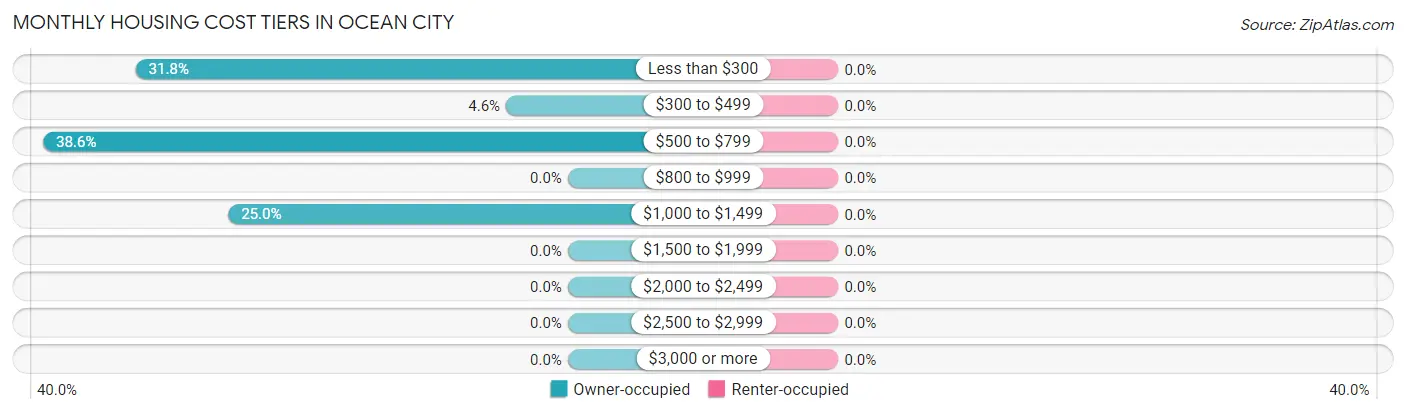
| Monthly Cost | Owner-occupied | Renter-occupied |
| Less than $300 | 14 (31.8%) | 0 (0.0%) |
| $300 to $499 | 2 (4.5%) | 0 (0.0%) |
| $500 to $799 | 17 (38.6%) | 0 (0.0%) |
| $800 to $999 | 0 (0.0%) | 0 (0.0%) |
| $1,000 to $1,499 | 11 (25.0%) | 0 (0.0%) |
| $1,500 to $1,999 | 0 (0.0%) | 0 (0.0%) |
| $2,000 to $2,499 | 0 (0.0%) | 0 (0.0%) |
| $2,500 to $2,999 | 0 (0.0%) | 0 (0.0%) |
| $3,000 or more | 0 (0.0%) | 0 (0.0%) |
| Total | 44 (100.0%) | 0 (0.0%) |
Physical Housing Characteristics in Ocean City
Housing Structures in Ocean City
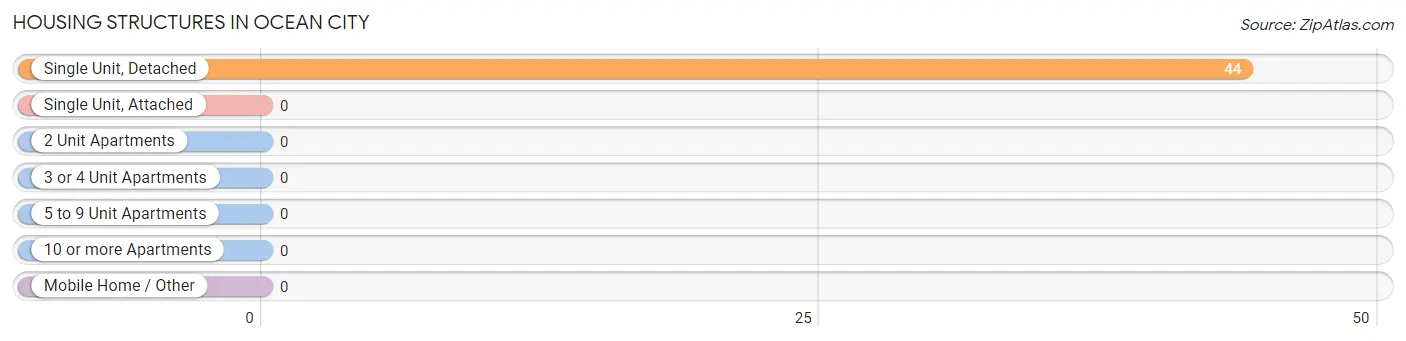
| Structure Type | # Housing Units | % Housing Units |
| Single Unit, Detached | 44 | 100.0% |
| Single Unit, Attached | 0 | 0.0% |
| 2 Unit Apartments | 0 | 0.0% |
| 3 or 4 Unit Apartments | 0 | 0.0% |
| 5 to 9 Unit Apartments | 0 | 0.0% |
| 10 or more Apartments | 0 | 0.0% |
| Mobile Home / Other | 0 | 0.0% |
| Total | 44 | 100.0% |
Housing Structures by Occupancy in Ocean City
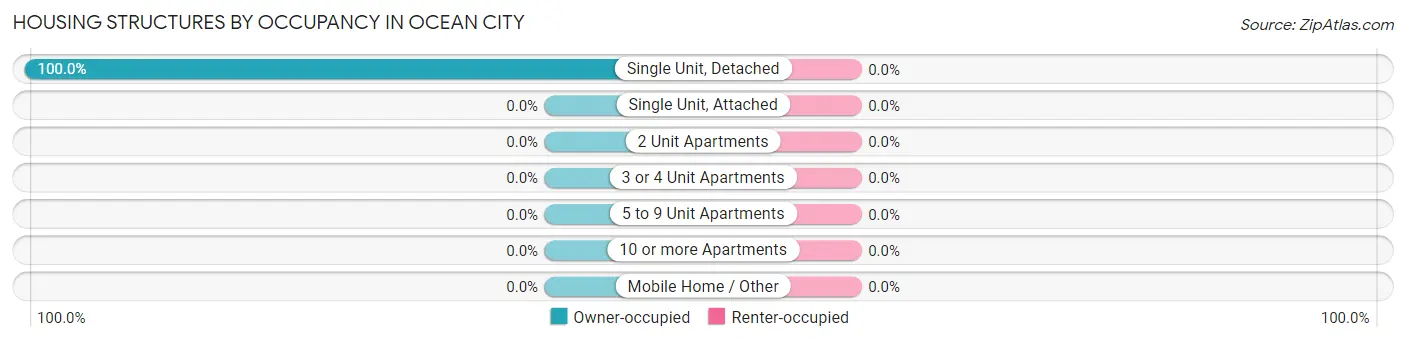
| Structure Type | Owner-occupied | Renter-occupied |
| Single Unit, Detached | 44 (100.0%) | 0 (0.0%) |
| Single Unit, Attached | 0 (0.0%) | 0 (0.0%) |
| 2 Unit Apartments | 0 (0.0%) | 0 (0.0%) |
| 3 or 4 Unit Apartments | 0 (0.0%) | 0 (0.0%) |
| 5 to 9 Unit Apartments | 0 (0.0%) | 0 (0.0%) |
| 10 or more Apartments | 0 (0.0%) | 0 (0.0%) |
| Mobile Home / Other | 0 (0.0%) | 0 (0.0%) |
| Total | 44 (100.0%) | 0 (0.0%) |
Housing Structures by Number of Rooms in Ocean City
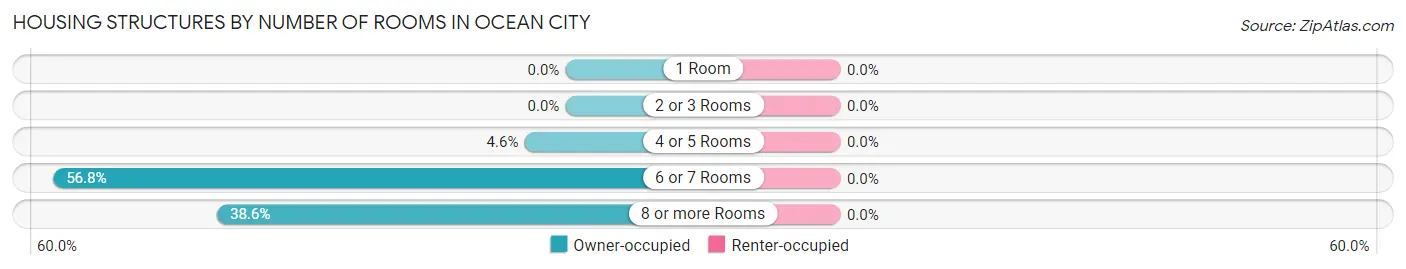
| Number of Rooms | Owner-occupied | Renter-occupied |
| 1 Room | 0 (0.0%) | 0 (0.0%) |
| 2 or 3 Rooms | 0 (0.0%) | 0 (0.0%) |
| 4 or 5 Rooms | 2 (4.5%) | 0 (0.0%) |
| 6 or 7 Rooms | 25 (56.8%) | 0 (0.0%) |
| 8 or more Rooms | 17 (38.6%) | 0 (0.0%) |
| Total | 44 (100.0%) | 0 (0.0%) |
Housing Structure by Heating Type in Ocean City
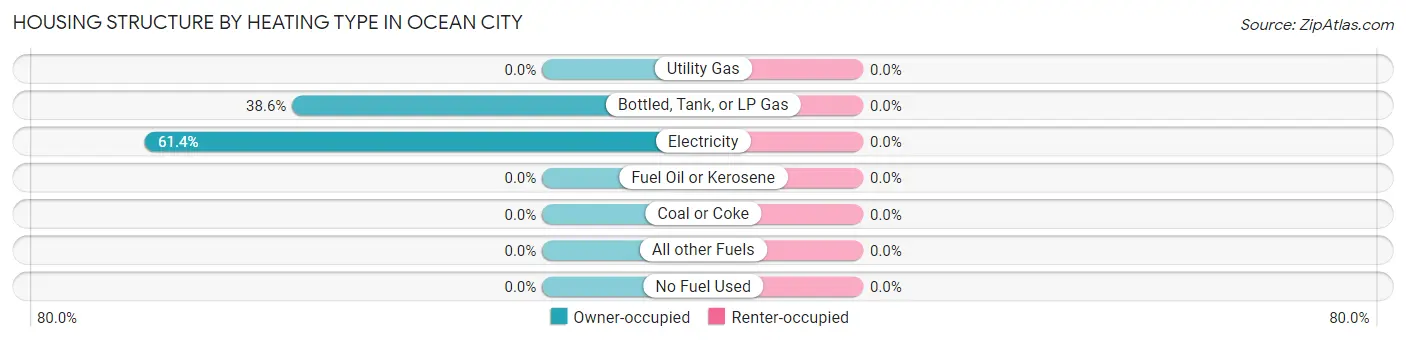
| Heating Type | Owner-occupied | Renter-occupied |
| Utility Gas | 0 (0.0%) | 0 (0.0%) |
| Bottled, Tank, or LP Gas | 17 (38.6%) | 0 (0.0%) |
| Electricity | 27 (61.4%) | 0 (0.0%) |
| Fuel Oil or Kerosene | 0 (0.0%) | 0 (0.0%) |
| Coal or Coke | 0 (0.0%) | 0 (0.0%) |
| All other Fuels | 0 (0.0%) | 0 (0.0%) |
| No Fuel Used | 0 (0.0%) | 0 (0.0%) |
| Total | 44 (100.0%) | 0 (0.0%) |
Household Vehicle Usage in Ocean City
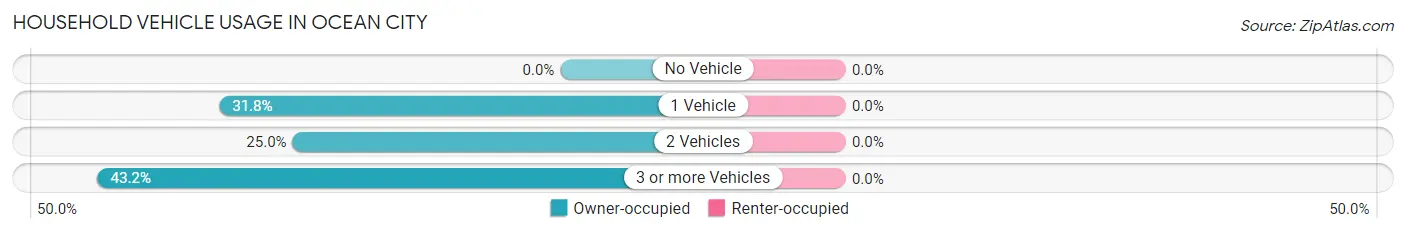
| Vehicles per Household | Owner-occupied | Renter-occupied |
| No Vehicle | 0 (0.0%) | 0 (0.0%) |
| 1 Vehicle | 14 (31.8%) | 0 (0.0%) |
| 2 Vehicles | 11 (25.0%) | 0 (0.0%) |
| 3 or more Vehicles | 19 (43.2%) | 0 (0.0%) |
| Total | 44 (100.0%) | 0 (0.0%) |
Real Estate & Mortgages in Ocean City
Real Estate and Mortgage Overview in Ocean City
| Characteristic | Without Mortgage | With Mortgage |
| Housing Units | 33 | 11 |
| Median Property Value | $256,600 | $0 |
| Median Household Income | - | - |
| Monthly Housing Costs | - | - |
| Real Estate Taxes | - | - |
Property Value by Mortgage Status in Ocean City
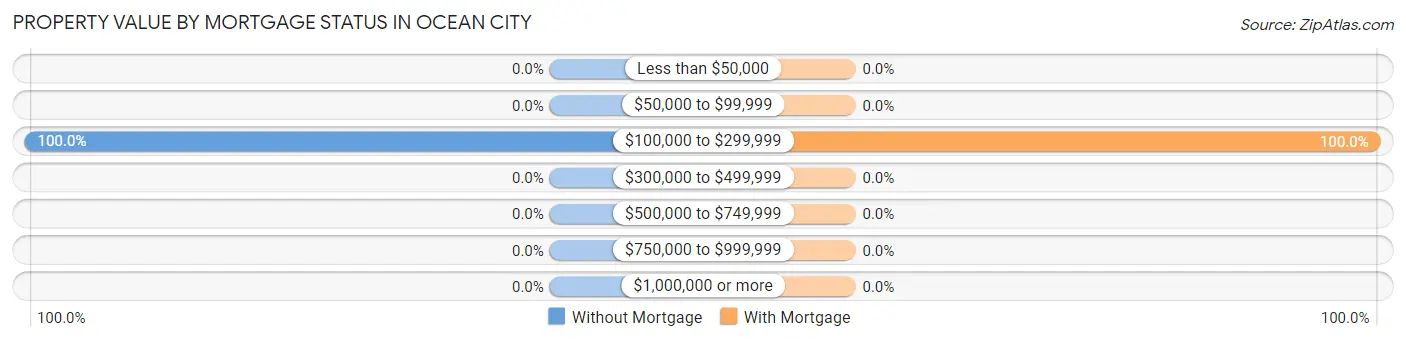
| Property Value | Without Mortgage | With Mortgage |
| Less than $50,000 | 0 (0.0%) | 0 (0.0%) |
| $50,000 to $99,999 | 0 (0.0%) | 0 (0.0%) |
| $100,000 to $299,999 | 33 (100.0%) | 11 (100.0%) |
| $300,000 to $499,999 | 0 (0.0%) | 0 (0.0%) |
| $500,000 to $749,999 | 0 (0.0%) | 0 (0.0%) |
| $750,000 to $999,999 | 0 (0.0%) | 0 (0.0%) |
| $1,000,000 or more | 0 (0.0%) | 0 (0.0%) |
| Total | 33 (100.0%) | 11 (100.0%) |
Household Income by Mortgage Status in Ocean City
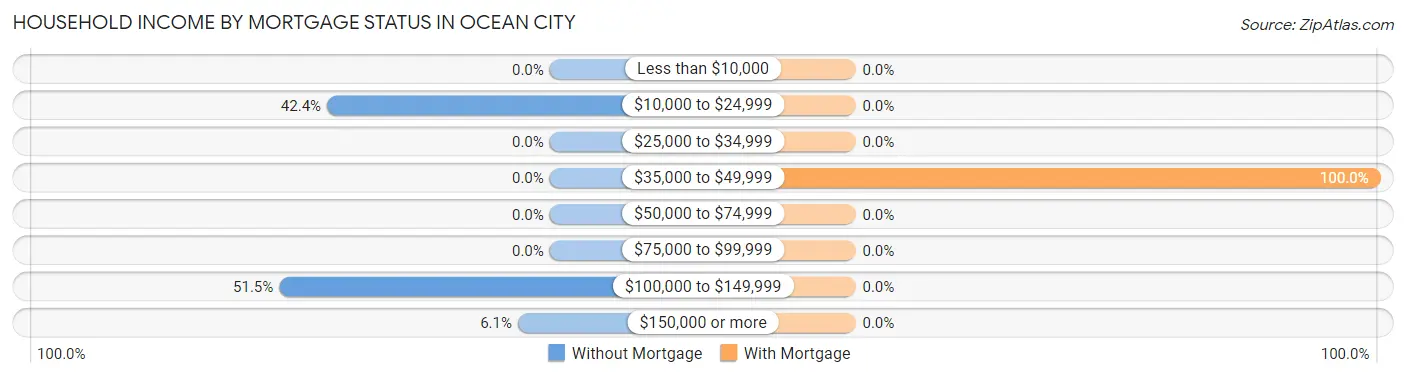
| Household Income | Without Mortgage | With Mortgage |
| Less than $10,000 | 0 (0.0%) | 0 (0.0%) |
| $10,000 to $24,999 | 14 (42.4%) | 0 (0.0%) |
| $25,000 to $34,999 | 0 (0.0%) | 0 (0.0%) |
| $35,000 to $49,999 | 0 (0.0%) | 11 (100.0%) |
| $50,000 to $74,999 | 0 (0.0%) | 0 (0.0%) |
| $75,000 to $99,999 | 0 (0.0%) | 0 (0.0%) |
| $100,000 to $149,999 | 17 (51.5%) | 0 (0.0%) |
| $150,000 or more | 2 (6.1%) | 0 (0.0%) |
| Total | 33 (100.0%) | 11 (100.0%) |
Property Value to Household Income Ratio in Ocean City
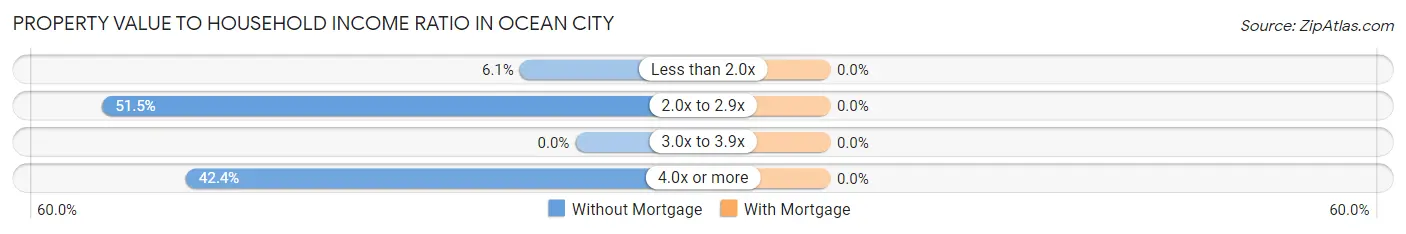
| Value-to-Income Ratio | Without Mortgage | With Mortgage |
| Less than 2.0x | 2 (6.1%) | 0 (0.0%) |
| 2.0x to 2.9x | 17 (51.5%) | 0 (0.0%) |
| 3.0x to 3.9x | 0 (0.0%) | 0 (0.0%) |
| 4.0x or more | 14 (42.4%) | 0 (0.0%) |
| Total | 33 (100.0%) | 11 (100.0%) |
Real Estate Taxes by Mortgage Status in Ocean City
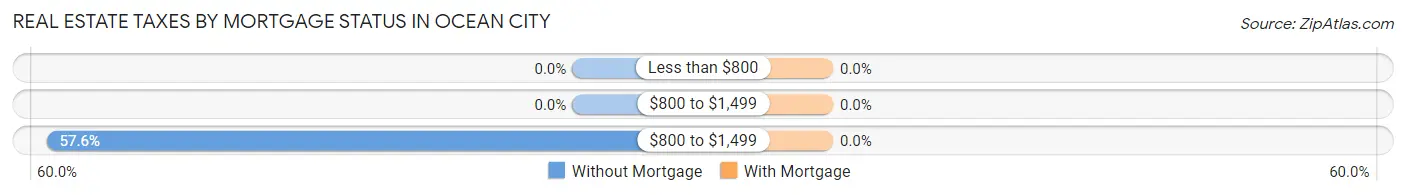
| Property Taxes | Without Mortgage | With Mortgage |
| Less than $800 | 0 (0.0%) | 0 (0.0%) |
| $800 to $1,499 | 0 (0.0%) | 0 (0.0%) |
| $800 to $1,499 | 19 (57.6%) | 0 (0.0%) |
| Total | 33 (100.0%) | 11 (100.0%) |
Health & Disability in Ocean City
Health Insurance Coverage by Age in Ocean City
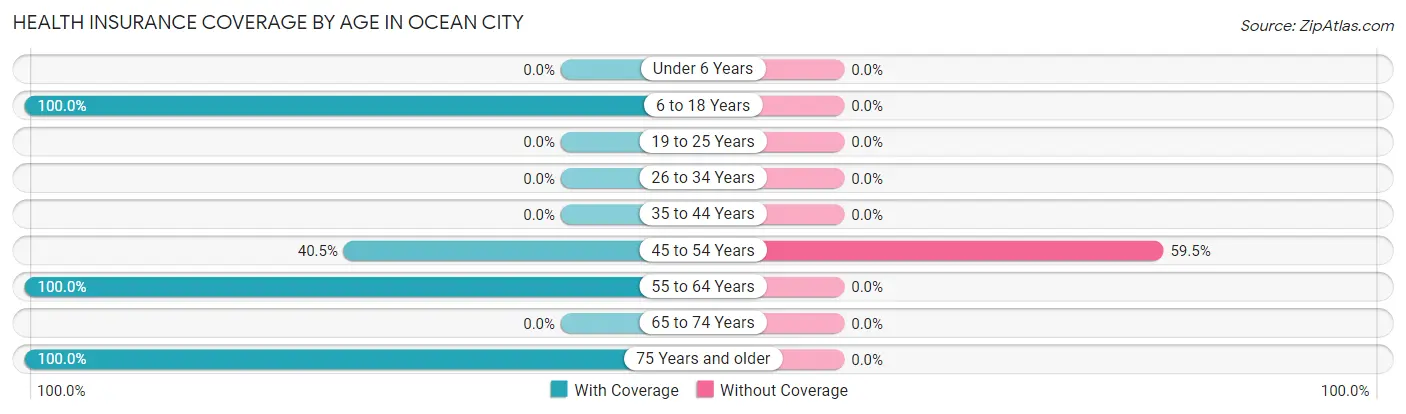
| Age Bracket | With Coverage | Without Coverage |
| Under 6 Years | 0 (0.0%) | 0 (0.0%) |
| 6 to 18 Years | 46 (100.0%) | 0 (0.0%) |
| 19 to 25 Years | 0 (0.0%) | 0 (0.0%) |
| 26 to 34 Years | 0 (0.0%) | 0 (0.0%) |
| 35 to 44 Years | 0 (0.0%) | 0 (0.0%) |
| 45 to 54 Years | 17 (40.5%) | 25 (59.5%) |
| 55 to 64 Years | 4 (100.0%) | 0 (0.0%) |
| 65 to 74 Years | 0 (0.0%) | 0 (0.0%) |
| 75 Years and older | 15 (100.0%) | 0 (0.0%) |
| Total | 82 (76.6%) | 25 (23.4%) |
Health Insurance Coverage by Citizenship Status in Ocean City
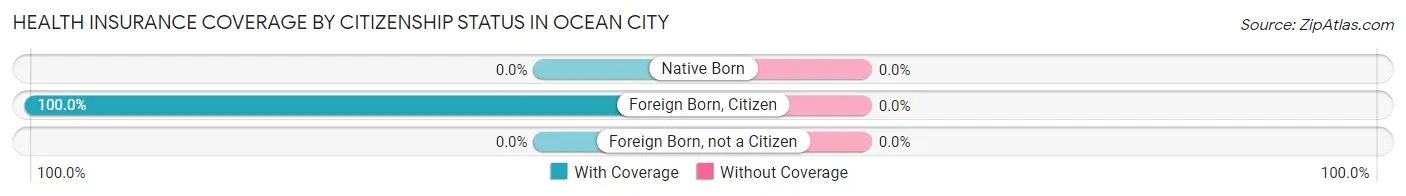
| Citizenship Status | With Coverage | Without Coverage |
| Native Born | 0 (0.0%) | 0 (0.0%) |
| Foreign Born, Citizen | 46 (100.0%) | 0 (0.0%) |
| Foreign Born, not a Citizen | 0 (0.0%) | 0 (0.0%) |
Health Insurance Coverage by Household Income in Ocean City
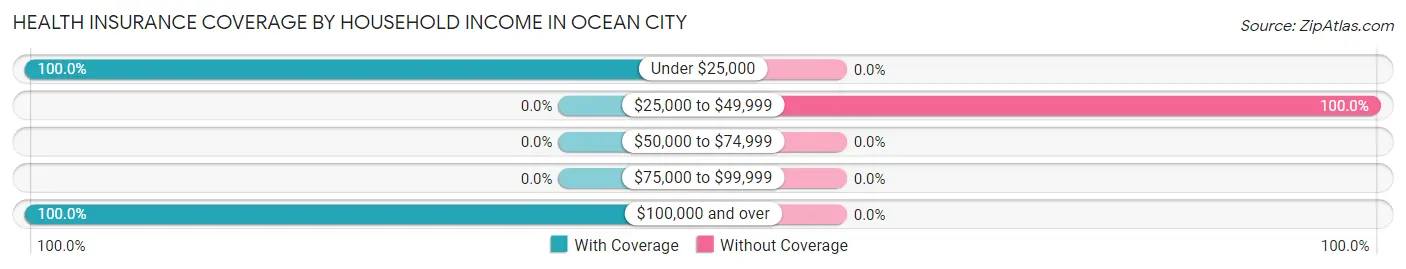
| Household Income | With Coverage | Without Coverage |
| Under $25,000 | 14 (100.0%) | 0 (0.0%) |
| $25,000 to $49,999 | 0 (0.0%) | 25 (100.0%) |
| $50,000 to $74,999 | 0 (0.0%) | 0 (0.0%) |
| $75,000 to $99,999 | 0 (0.0%) | 0 (0.0%) |
| $100,000 and over | 68 (100.0%) | 0 (0.0%) |
Public vs Private Health Insurance Coverage by Age in Ocean City
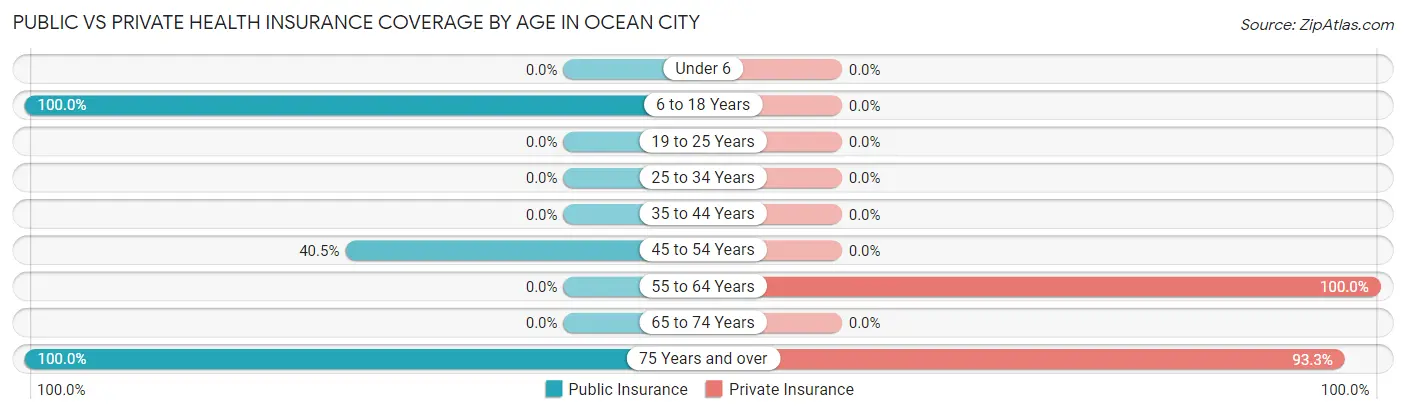
| Age Bracket | Public Insurance | Private Insurance |
| Under 6 | 0 (0.0%) | 0 (0.0%) |
| 6 to 18 Years | 46 (100.0%) | 0 (0.0%) |
| 19 to 25 Years | 0 (0.0%) | 0 (0.0%) |
| 25 to 34 Years | 0 (0.0%) | 0 (0.0%) |
| 35 to 44 Years | 0 (0.0%) | 0 (0.0%) |
| 45 to 54 Years | 17 (40.5%) | 0 (0.0%) |
| 55 to 64 Years | 0 (0.0%) | 4 (100.0%) |
| 65 to 74 Years | 0 (0.0%) | 0 (0.0%) |
| 75 Years and over | 15 (100.0%) | 14 (93.3%) |
| Total | 78 (72.9%) | 18 (16.8%) |
Disability Status by Sex by Age in Ocean City
| Age Bracket | Male | Female |
| Under 5 Years | 0 (0.0%) | 0 (0.0%) |
| 5 to 17 Years | 0 (0.0%) | 0 (0.0%) |
| 18 to 34 Years | 0 (0.0%) | 0 (0.0%) |
| 35 to 64 Years | 0 (0.0%) | 0 (0.0%) |
| 65 to 74 Years | 0 (0.0%) | 0 (0.0%) |
| 75 Years and over | 0 (0.0%) | 0 (0.0%) |
Disability Class by Sex by Age in Ocean City
Disability Class: Hearing Difficulty
| Age Bracket | Male | Female |
| Under 5 Years | 0 (0.0%) | 0 (0.0%) |
| 5 to 17 Years | 0 (0.0%) | 0 (0.0%) |
| 18 to 34 Years | 0 (0.0%) | 0 (0.0%) |
| 35 to 64 Years | 0 (0.0%) | 0 (0.0%) |
| 65 to 74 Years | 0 (0.0%) | 0 (0.0%) |
| 75 Years and over | 0 (0.0%) | 0 (0.0%) |
Disability Class: Vision Difficulty
| Age Bracket | Male | Female |
| Under 5 Years | 0 (0.0%) | 0 (0.0%) |
| 5 to 17 Years | 0 (0.0%) | 0 (0.0%) |
| 18 to 34 Years | 0 (0.0%) | 0 (0.0%) |
| 35 to 64 Years | 0 (0.0%) | 0 (0.0%) |
| 65 to 74 Years | 0 (0.0%) | 0 (0.0%) |
| 75 Years and over | 0 (0.0%) | 0 (0.0%) |
Disability Class: Cognitive Difficulty
| Age Bracket | Male | Female |
| 5 to 17 Years | 0 (0.0%) | 0 (0.0%) |
| 18 to 34 Years | 0 (0.0%) | 0 (0.0%) |
| 35 to 64 Years | 0 (0.0%) | 0 (0.0%) |
| 65 to 74 Years | 0 (0.0%) | 0 (0.0%) |
| 75 Years and over | 0 (0.0%) | 0 (0.0%) |
Disability Class: Ambulatory Difficulty
| Age Bracket | Male | Female |
| 5 to 17 Years | 0 (0.0%) | 0 (0.0%) |
| 18 to 34 Years | 0 (0.0%) | 0 (0.0%) |
| 35 to 64 Years | 0 (0.0%) | 0 (0.0%) |
| 65 to 74 Years | 0 (0.0%) | 0 (0.0%) |
| 75 Years and over | 0 (0.0%) | 0 (0.0%) |
Disability Class: Self-Care Difficulty
| Age Bracket | Male | Female |
| 5 to 17 Years | 0 (0.0%) | 0 (0.0%) |
| 18 to 34 Years | 0 (0.0%) | 0 (0.0%) |
| 35 to 64 Years | 0 (0.0%) | 0 (0.0%) |
| 65 to 74 Years | 0 (0.0%) | 0 (0.0%) |
| 75 Years and over | 0 (0.0%) | 0 (0.0%) |
Technology Access in Ocean City
Computing Device Access in Ocean City
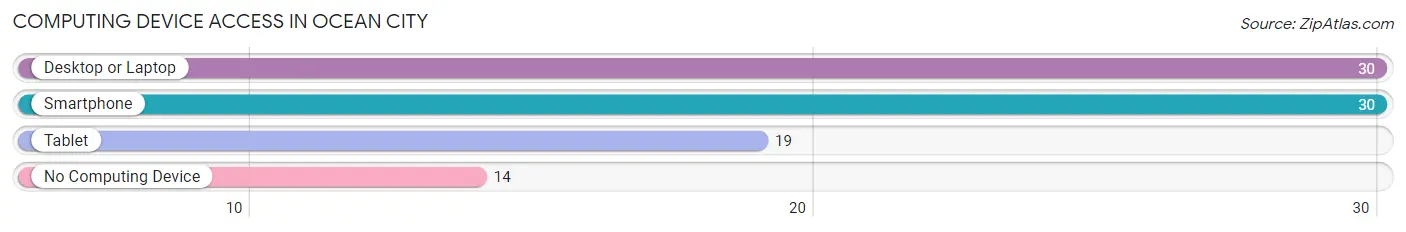
| Device Type | # Households | % Households |
| Desktop or Laptop | 30 | 68.2% |
| Smartphone | 30 | 68.2% |
| Tablet | 19 | 43.2% |
| No Computing Device | 14 | 31.8% |
| Total | 44 | 100.0% |
Internet Access in Ocean City
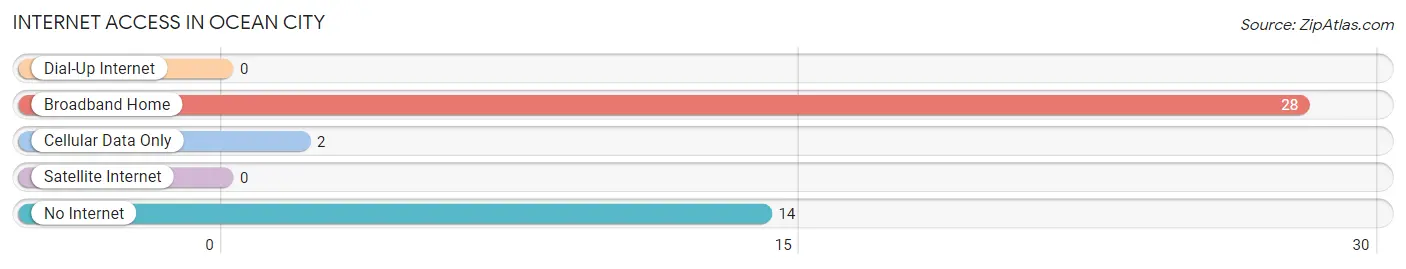
| Internet Type | # Households | % Households |
| Dial-Up Internet | 0 | 0.0% |
| Broadband Home | 28 | 63.6% |
| Cellular Data Only | 2 | 4.5% |
| Satellite Internet | 0 | 0.0% |
| No Internet | 14 | 31.8% |
| Total | 44 | 100.0% |
Ocean City Summary
Introduction
Ocean City is a small town located in Grays Harbor County, Washington, United States. It is situated on the Pacific Ocean, approximately two miles south of the city of Ocean Shores. The town was founded in 1891 and has a population of approximately 1,000 people. The town is known for its beautiful beaches, fishing, and outdoor activities.
History
The area that is now Ocean City was first inhabited by the Quinault Indian Nation. The Quinault people were a fishing and hunting tribe that lived in the area for thousands of years. In 1891, the town of Ocean City was founded by a group of settlers from the East Coast. The settlers were attracted to the area by the abundance of fish and the beautiful beaches.
The town quickly grew and by the early 1900s, it had become a popular tourist destination. The town was known for its fishing, clamming, and beach activities. In the 1920s, the town was home to a number of resorts and hotels. The town also had a boardwalk and a pier.
In the 1950s, the town began to decline as tourists began to flock to nearby Ocean Shores. The town was also hit hard by the Great Depression and World War II. In the 1970s, the town began to experience a resurgence as people began to move to the area for its natural beauty and outdoor activities.
Geography
Ocean City is located in Grays Harbor County, Washington, United States. It is situated on the Pacific Ocean, approximately two miles south of the city of Ocean Shores. The town is located on a peninsula that is surrounded by the Pacific Ocean on three sides. The town is bordered by the Copalis River to the north and the Quinault River to the south.
The town has a total area of 1.2 square miles, all of which is land. The town has a mild climate with temperatures ranging from the mid-50s in the winter to the mid-70s in the summer. The town receives an average of 40 inches of rain per year.
Economy
The economy of Ocean City is largely based on tourism and fishing. The town is home to a number of resorts and hotels that cater to tourists. The town also has a number of restaurants, bars, and shops that cater to tourists. The town is also home to a number of fishing charters that take tourists out to sea to fish for salmon, halibut, and other types of fish.
The town is also home to a number of small businesses, including a grocery store, a hardware store, and a post office. The town is also home to a number of art galleries and antique stores.
Demographics
As of the 2010 census, the population of Ocean City was 1,000 people. The town has a population density of 817 people per square mile. The median age of the population is 44.7 years. The median household income is $41,250 and the median family income is $50,000.
Conclusion
Ocean City is a small town located in Grays Harbor County, Washington, United States. It is situated on the Pacific Ocean, approximately two miles south of the city of Ocean Shores. The town was founded in 1891 and has a population of approximately 1,000 people. The town is known for its beautiful beaches, fishing, and outdoor activities. The economy of Ocean City is largely based on tourism and fishing. The town is home to a number of resorts and hotels that cater to tourists. The town also has a number of restaurants, bars, and shops that cater to tourists. The town is also home to a number of fishing charters that take tourists out to sea to fish for salmon, halibut, and other types of fish. The town is also home to a number of small businesses, including a grocery store, a hardware store, and a post office. The town is also home to a number of art galleries and antique stores. As of the 2010 census, the population of Ocean City was 1,000 people. The town has a population density of 817 people per square mile. The median age of the population is 44.7 years. The median household income is $41,250 and the median family income is $50,000.
Common Questions
What is Per Capita Income in Ocean City?
Per Capita income in Ocean City is $12,821.
What is Inequality or Gini Index in Ocean City?
Inequality or Gini Index in Ocean City is 0.39.
What is the Total Population of Ocean City?
Total Population of Ocean City is 107.
What is the Total Male Population of Ocean City?
Total Male Population of Ocean City is 47.
What is the Total Female Population of Ocean City?
Total Female Population of Ocean City is 60.
What is the Ratio of Males per 100 Females in Ocean City?
There are 78.33 Males per 100 Females in Ocean City.
What is the Ratio of Females per 100 Males in Ocean City?
There are 127.66 Females per 100 Males in Ocean City.
What is the Median Population Age in Ocean City?
Median Population Age in Ocean City is 53.3 Years.
What is the Average Family Size in Ocean City
Average Family Size in Ocean City is 3.1 People.
What is the Average Household Size in Ocean City
Average Household Size in Ocean City is 2.4 People.
How Large is the Labor Force in Ocean City?
There are 46 People in the Labor Forcein in Ocean City.
What is the Percentage of People in the Labor Force in Ocean City?
59.7% of People are in the Labor Force in Ocean City.