Omak, WA Map & Demographics
Omak Map
Omak Overview
$29,756
PER CAPITA INCOME
$75,357
AVG FAMILY INCOME
$70,125
AVG HOUSEHOLD INCOME
11.5%
WAGE / INCOME GAP [ % ]
88.5¢/ $1
WAGE / INCOME GAP [ $ ]
0.39
INEQUALITY / GINI INDEX
4,877
TOTAL POPULATION
2,133
MALE POPULATION
2,744
FEMALE POPULATION
77.73
MALES / 100 FEMALES
128.65
FEMALES / 100 MALES
36.9
MEDIAN AGE
2.9
AVG FAMILY SIZE
2.6
AVG HOUSEHOLD SIZE
2,202
LABOR FORCE [ PEOPLE ]
62.3%
PERCENT IN LABOR FORCE
4.9%
UNEMPLOYMENT RATE
Omak Zip Codes
Omak Area Codes
Income in Omak
Income Overview in Omak
Per Capita Income in Omak is $29,756, while median incomes of families and households are $75,357 and $70,125 respectively.
| Characteristic | Number | Measure |
| Per Capita Income | 4,877 | $29,756 |
| Median Family Income | 1,346 | $75,357 |
| Mean Family Income | 1,346 | $84,835 |
| Median Household Income | 1,832 | $70,125 |
| Mean Household Income | 1,832 | $77,236 |
| Income Deficit | 1,346 | $0 |
| Wage / Income Gap (%) | 4,877 | 11.46% |
| Wage / Income Gap ($) | 4,877 | 88.54¢ per $1 |
| Gini / Inequality Index | 4,877 | 0.39 |
Earnings by Sex in Omak
Average Earnings in Omak are $37,708, $41,059 for men and $36,352 for women, a difference of 11.5%.
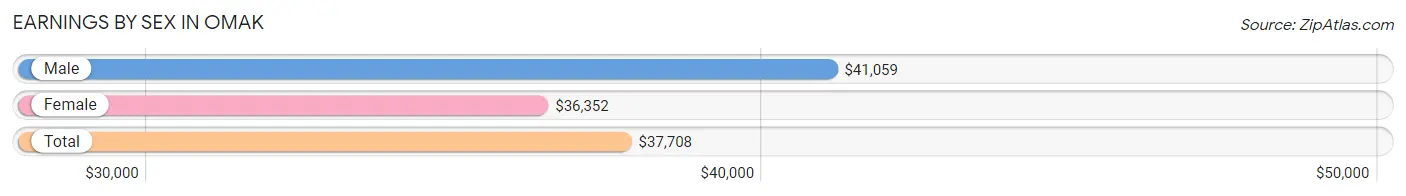
| Sex | Number | Average Earnings |
| Male | 1,077 (46.1%) | $41,059 |
| Female | 1,259 (53.9%) | $36,352 |
| Total | 2,336 (100.0%) | $37,708 |
Earnings by Sex by Income Bracket in Omak
The most common earnings brackets in Omak are $65,000 to $74,999 for men (134 | 12.4%) and $100,000+ for women (217 | 17.2%).
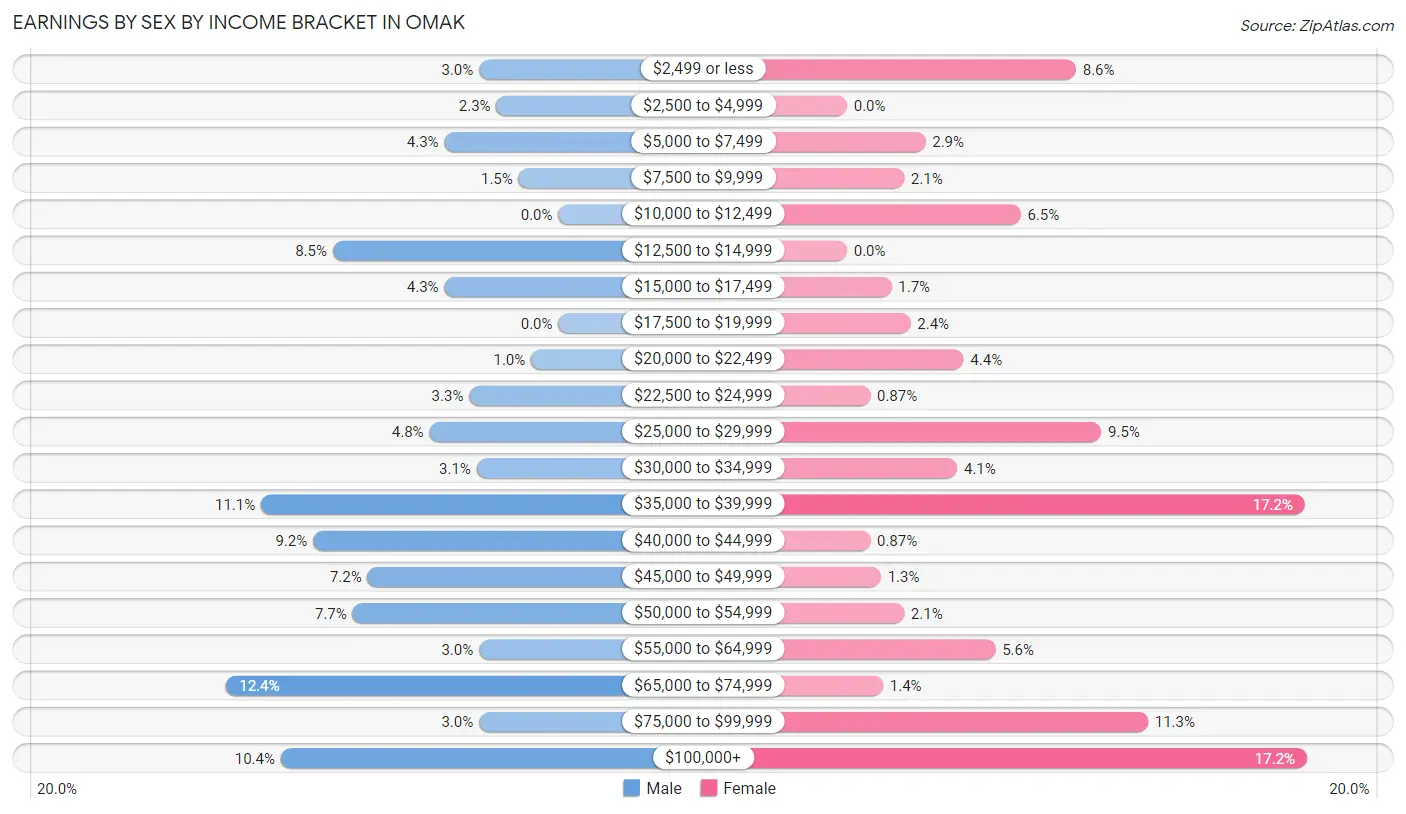
| Income | Male | Female |
| $2,499 or less | 32 (3.0%) | 108 (8.6%) |
| $2,500 to $4,999 | 25 (2.3%) | 0 (0.0%) |
| $5,000 to $7,499 | 46 (4.3%) | 37 (2.9%) |
| $7,500 to $9,999 | 16 (1.5%) | 27 (2.1%) |
| $10,000 to $12,499 | 0 (0.0%) | 82 (6.5%) |
| $12,500 to $14,999 | 91 (8.5%) | 0 (0.0%) |
| $15,000 to $17,499 | 46 (4.3%) | 21 (1.7%) |
| $17,500 to $19,999 | 0 (0.0%) | 30 (2.4%) |
| $20,000 to $22,499 | 11 (1.0%) | 55 (4.4%) |
| $22,500 to $24,999 | 36 (3.3%) | 11 (0.9%) |
| $25,000 to $29,999 | 52 (4.8%) | 120 (9.5%) |
| $30,000 to $34,999 | 33 (3.1%) | 52 (4.1%) |
| $35,000 to $39,999 | 120 (11.1%) | 216 (17.2%) |
| $40,000 to $44,999 | 99 (9.2%) | 11 (0.9%) |
| $45,000 to $49,999 | 77 (7.1%) | 16 (1.3%) |
| $50,000 to $54,999 | 83 (7.7%) | 27 (2.1%) |
| $55,000 to $64,999 | 32 (3.0%) | 70 (5.6%) |
| $65,000 to $74,999 | 134 (12.4%) | 17 (1.3%) |
| $75,000 to $99,999 | 32 (3.0%) | 142 (11.3%) |
| $100,000+ | 112 (10.4%) | 217 (17.2%) |
| Total | 1,077 (100.0%) | 1,259 (100.0%) |
Earnings by Sex by Educational Attainment in Omak
Average earnings in Omak are $49,401 for men and $36,891 for women, a difference of 25.3%. Men with an educational attainment of bachelor's degree enjoy the highest average annual earnings of $83,203, while those with college or associate's degree education earn the least with $40,427. Women with an educational attainment of graduate degree earn the most with the average annual earnings of $58,125, while those with high school diploma education have the smallest earnings of $33,906.
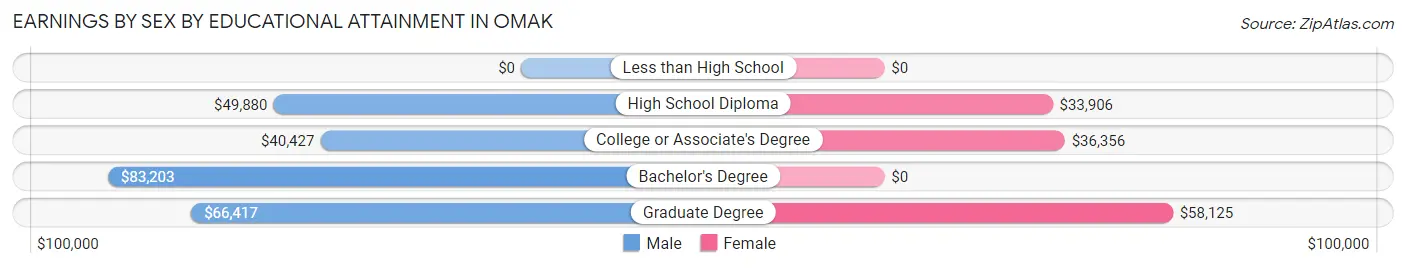
| Educational Attainment | Male Income | Female Income |
| Less than High School | - | - |
| High School Diploma | $49,880 | $33,906 |
| College or Associate's Degree | $40,427 | $36,356 |
| Bachelor's Degree | $83,203 | $0 |
| Graduate Degree | $66,417 | $58,125 |
| Total | $49,401 | $36,891 |
Family Income in Omak
Family Income Brackets in Omak
According to the Omak family income data, there are 276 families falling into the $100,000 to $149,999 income range, which is the most common income bracket and makes up 20.5% of all families. Conversely, the $25,000 to $34,999 income bracket is the least frequent group with only 9 families (0.7%) belonging to this category.
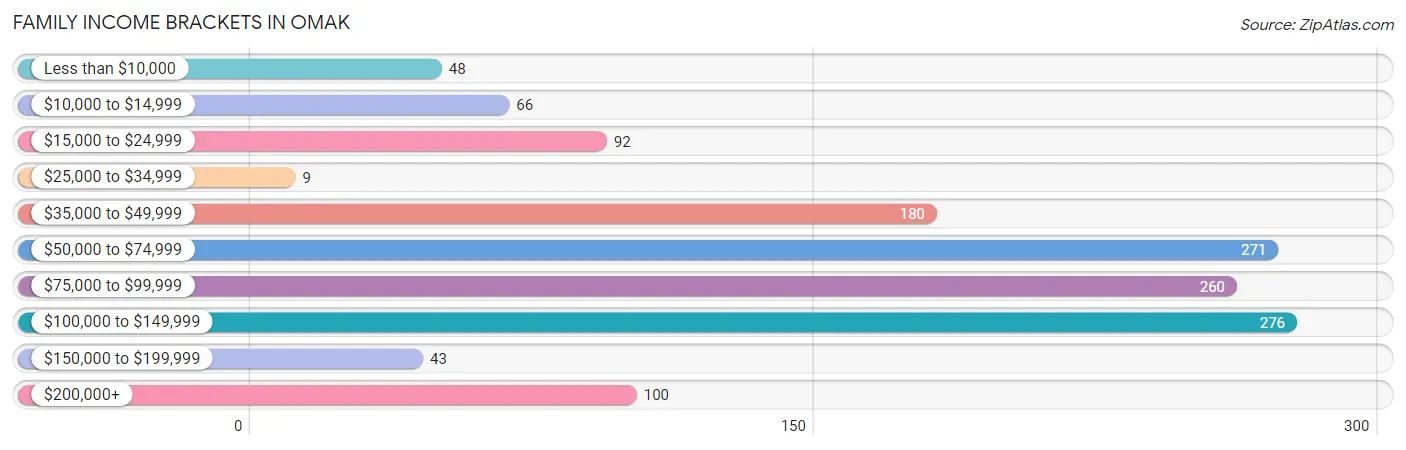
| Income Bracket | # Families | % Families |
| Less than $10,000 | 48 | 3.6% |
| $10,000 to $14,999 | 66 | 4.9% |
| $15,000 to $24,999 | 92 | 6.8% |
| $25,000 to $34,999 | 9 | 0.7% |
| $35,000 to $49,999 | 180 | 13.4% |
| $50,000 to $74,999 | 271 | 20.1% |
| $75,000 to $99,999 | 260 | 19.3% |
| $100,000 to $149,999 | 276 | 20.5% |
| $150,000 to $199,999 | 43 | 3.2% |
| $200,000+ | 100 | 7.4% |
Family Income by Famaliy Size in Omak
4-person families (389 | 28.9%) account for the highest median family income in Omak with $105,232 per family, while 2-person families (622 | 46.2%) have the highest median income of $28,969 per family member.
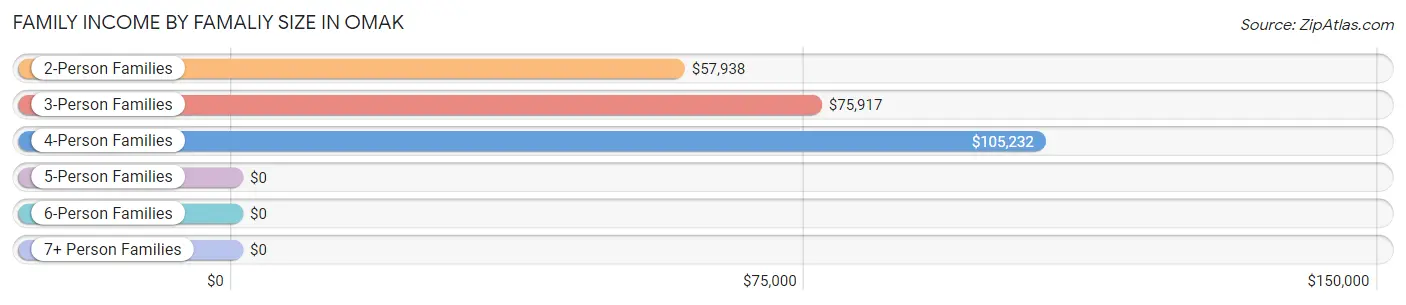
| Income Bracket | # Families | Median Income |
| 2-Person Families | 622 (46.2%) | $57,938 |
| 3-Person Families | 267 (19.8%) | $75,917 |
| 4-Person Families | 389 (28.9%) | $105,232 |
| 5-Person Families | 27 (2.0%) | $0 |
| 6-Person Families | 8 (0.6%) | $0 |
| 7+ Person Families | 33 (2.5%) | $0 |
| Total | 1,346 (100.0%) | $75,357 |
Family Income by Number of Earners in Omak
The median family income in Omak is $75,357, with families comprising 3+ earners (79) having the highest median family income of $241,836, while families with no earners (207) have the lowest median family income of $49,097, accounting for 5.9% and 15.4% of families, respectively.
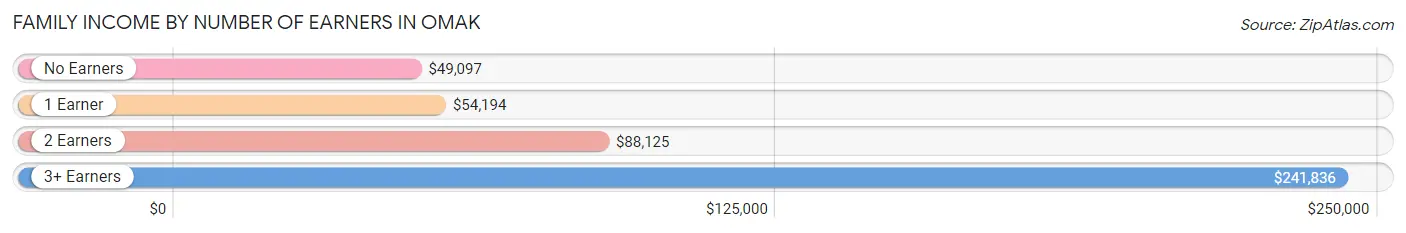
| Number of Earners | # Families | Median Income |
| No Earners | 207 (15.4%) | $49,097 |
| 1 Earner | 661 (49.1%) | $54,194 |
| 2 Earners | 399 (29.6%) | $88,125 |
| 3+ Earners | 79 (5.9%) | $241,836 |
| Total | 1,346 (100.0%) | $75,357 |
Household Income in Omak
Household Income Brackets in Omak
With 398 households falling in the category, the $50,000 to $74,999 income range is the most frequent in Omak, accounting for 21.7% of all households. In contrast, only 42 households (2.3%) fall into the $10,000 to $14,999 income bracket, making it the least populous group.
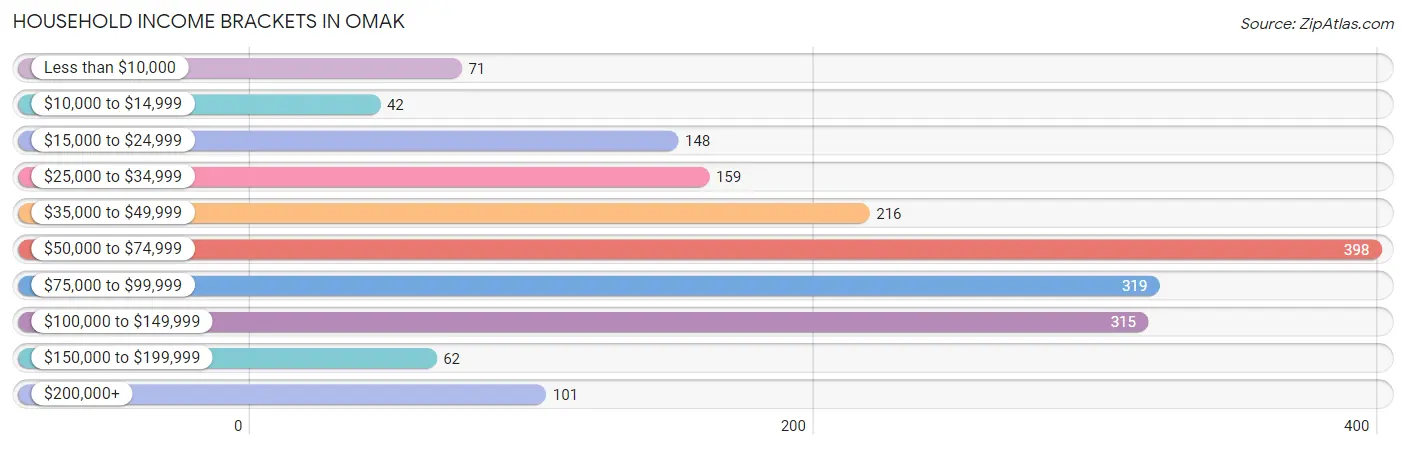
| Income Bracket | # Households | % Households |
| Less than $10,000 | 71 | 3.9% |
| $10,000 to $14,999 | 42 | 2.3% |
| $15,000 to $24,999 | 148 | 8.1% |
| $25,000 to $34,999 | 159 | 8.7% |
| $35,000 to $49,999 | 216 | 11.8% |
| $50,000 to $74,999 | 398 | 21.7% |
| $75,000 to $99,999 | 319 | 17.4% |
| $100,000 to $149,999 | 315 | 17.2% |
| $150,000 to $199,999 | 62 | 3.4% |
| $200,000+ | 101 | 5.5% |
Household Income by Householder Age in Omak
The median household income in Omak is $70,125, with the highest median household income of $78,684 found in the 25 to 44 years age bracket for the primary householder. A total of 716 households (39.1%) fall into this category. Meanwhile, the 15 to 24 years age bracket for the primary householder has the lowest median household income of $0, with 21 households (1.1%) in this group.
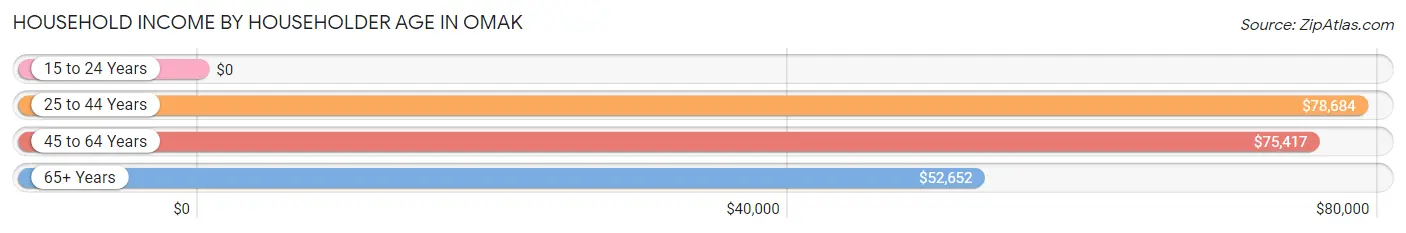
| Income Bracket | # Households | Median Income |
| 15 to 24 Years | 21 (1.1%) | $0 |
| 25 to 44 Years | 716 (39.1%) | $78,684 |
| 45 to 64 Years | 629 (34.3%) | $75,417 |
| 65+ Years | 466 (25.4%) | $52,652 |
| Total | 1,832 (100.0%) | $70,125 |
Poverty in Omak
Income Below Poverty by Sex and Age in Omak
With 13.1% poverty level for males and 21.6% for females among the residents of Omak, 12 to 14 year old males and 16 and 17 year old females are the most vulnerable to poverty, with 33 males (47.1%) and 5 females (100.0%) in their respective age groups living below the poverty level.
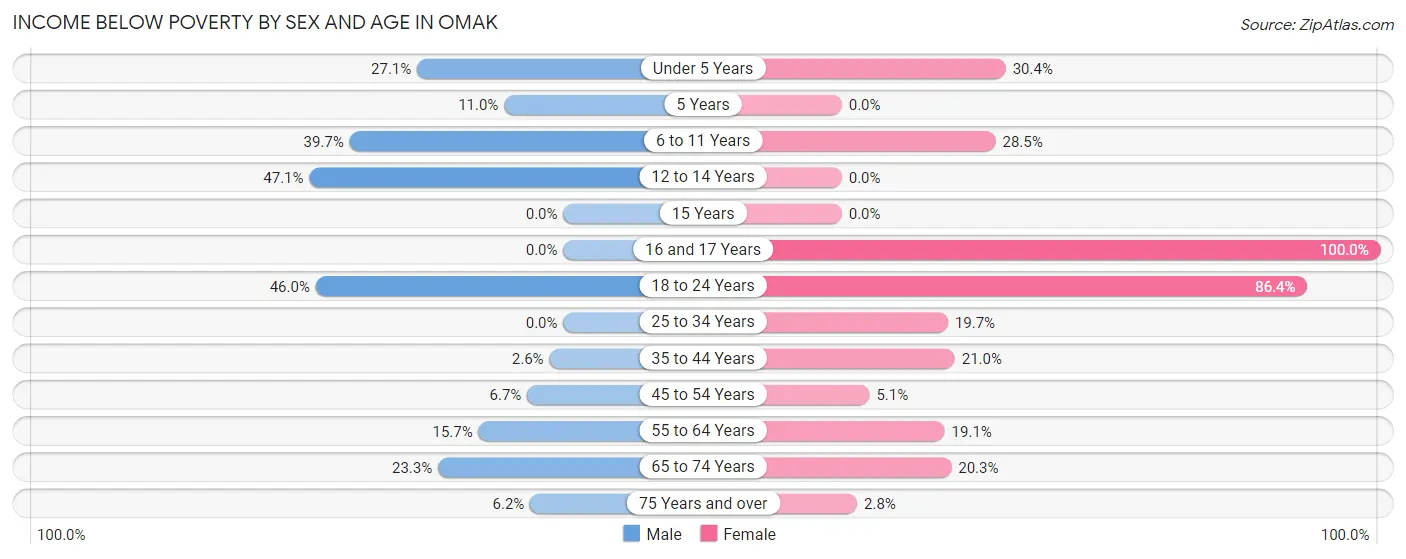
| Age Bracket | Male | Female |
| Under 5 Years | 19 (27.1%) | 56 (30.4%) |
| 5 Years | 18 (11.0%) | 0 (0.0%) |
| 6 to 11 Years | 25 (39.7%) | 135 (28.5%) |
| 12 to 14 Years | 33 (47.1%) | 0 (0.0%) |
| 15 Years | 0 (0.0%) | 0 (0.0%) |
| 16 and 17 Years | 0 (0.0%) | 5 (100.0%) |
| 18 to 24 Years | 91 (46.0%) | 89 (86.4%) |
| 25 to 34 Years | 0 (0.0%) | 52 (19.7%) |
| 35 to 44 Years | 12 (2.6%) | 90 (21.0%) |
| 45 to 54 Years | 10 (6.7%) | 11 (5.1%) |
| 55 to 64 Years | 37 (15.7%) | 71 (19.1%) |
| 65 to 74 Years | 10 (23.3%) | 61 (20.3%) |
| 75 Years and over | 13 (6.2%) | 5 (2.8%) |
| Total | 268 (13.1%) | 575 (21.6%) |
Income Above Poverty by Sex and Age in Omak
According to the poverty statistics in Omak, males aged 15 years and females aged 12 to 14 years are the age groups that are most secure financially, with 100.0% of males and 100.0% of females in these age groups living above the poverty line.
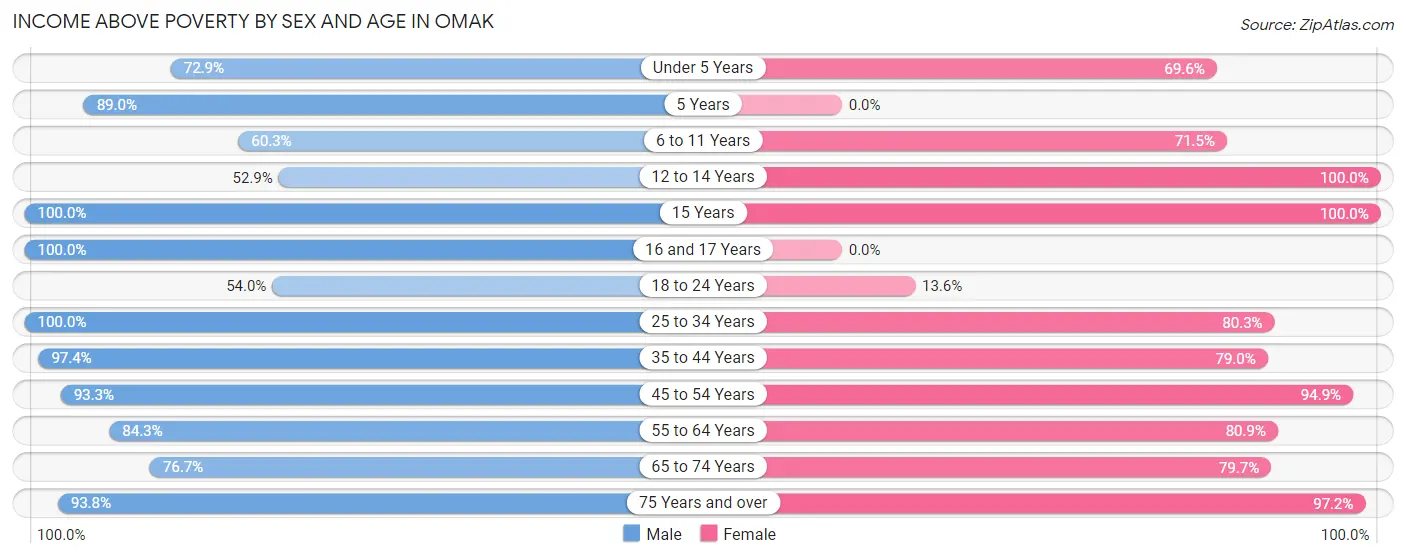
| Age Bracket | Male | Female |
| Under 5 Years | 51 (72.9%) | 128 (69.6%) |
| 5 Years | 146 (89.0%) | 0 (0.0%) |
| 6 to 11 Years | 38 (60.3%) | 338 (71.5%) |
| 12 to 14 Years | 37 (52.9%) | 76 (100.0%) |
| 15 Years | 50 (100.0%) | 65 (100.0%) |
| 16 and 17 Years | 68 (100.0%) | 0 (0.0%) |
| 18 to 24 Years | 107 (54.0%) | 14 (13.6%) |
| 25 to 34 Years | 257 (100.0%) | 212 (80.3%) |
| 35 to 44 Years | 453 (97.4%) | 339 (79.0%) |
| 45 to 54 Years | 139 (93.3%) | 203 (94.9%) |
| 55 to 64 Years | 198 (84.3%) | 301 (80.9%) |
| 65 to 74 Years | 33 (76.7%) | 239 (79.7%) |
| 75 Years and over | 198 (93.8%) | 171 (97.2%) |
| Total | 1,775 (86.9%) | 2,086 (78.4%) |
Income Below Poverty Among Married-Couple Families in Omak
The poverty statistics for married-couple families in Omak show that 2.1% or 17 of the total 803 families live below the poverty line. Families with no children have the highest poverty rate of 4.4%, comprising of 17 families. On the other hand, families with 1 or 2 children have the lowest poverty rate of 0.0%, which includes 0 families.
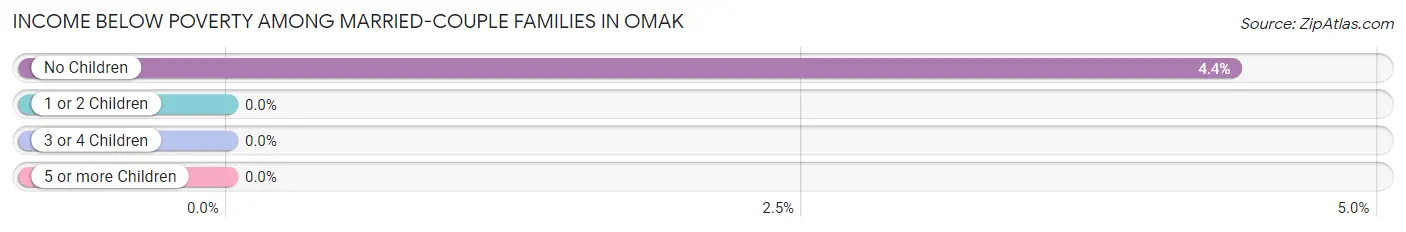
| Children | Above Poverty | Below Poverty |
| No Children | 372 (95.6%) | 17 (4.4%) |
| 1 or 2 Children | 406 (100.0%) | 0 (0.0%) |
| 3 or 4 Children | 8 (100.0%) | 0 (0.0%) |
| 5 or more Children | 0 (0.0%) | 0 (0.0%) |
| Total | 786 (97.9%) | 17 (2.1%) |
Income Below Poverty Among Single-Parent Households in Omak
According to the poverty data in Omak, 6.5% or 12 single-father households and 45.1% or 161 single-mother households are living below the poverty line. Among single-father households, those with 1 or 2 children have the highest poverty rate, with 12 households (12.0%) experiencing poverty. Likewise, among single-mother households, those with 1 or 2 children have the highest poverty rate, with 128 households (60.1%) falling below the poverty line.
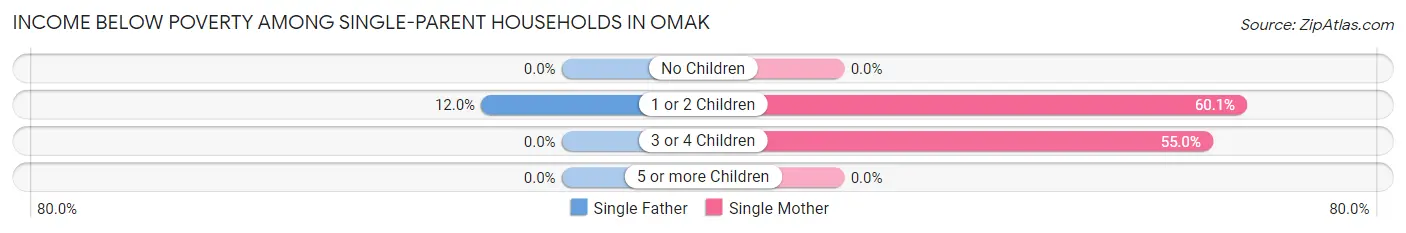
| Children | Single Father | Single Mother |
| No Children | 0 (0.0%) | 0 (0.0%) |
| 1 or 2 Children | 12 (12.0%) | 128 (60.1%) |
| 3 or 4 Children | 0 (0.0%) | 33 (55.0%) |
| 5 or more Children | 0 (0.0%) | 0 (0.0%) |
| Total | 12 (6.5%) | 161 (45.1%) |
Income Below Poverty Among Married-Couple vs Single-Parent Households in Omak
The poverty data for Omak shows that 17 of the married-couple family households (2.1%) and 173 of the single-parent households (31.9%) are living below the poverty level. Within the married-couple family households, those with no children have the highest poverty rate, with 17 households (4.4%) falling below the poverty line. Among the single-parent households, those with 3 or 4 children have the highest poverty rate, with 33 household (55.0%) living below poverty.
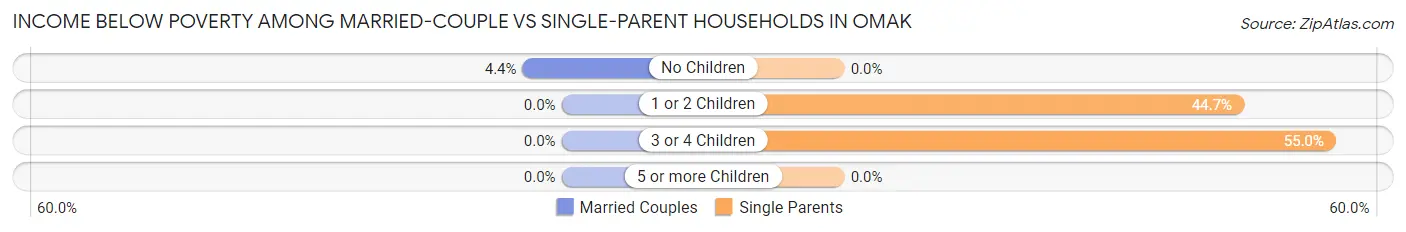
| Children | Married-Couple Families | Single-Parent Households |
| No Children | 17 (4.4%) | 0 (0.0%) |
| 1 or 2 Children | 0 (0.0%) | 140 (44.7%) |
| 3 or 4 Children | 0 (0.0%) | 33 (55.0%) |
| 5 or more Children | 0 (0.0%) | 0 (0.0%) |
| Total | 17 (2.1%) | 173 (31.9%) |
Race in Omak
The most populous races in Omak are White / Caucasian (3,772 | 77.3%), Hispanic or Latino (616 | 12.6%), and Two or more Races (494 | 10.1%).
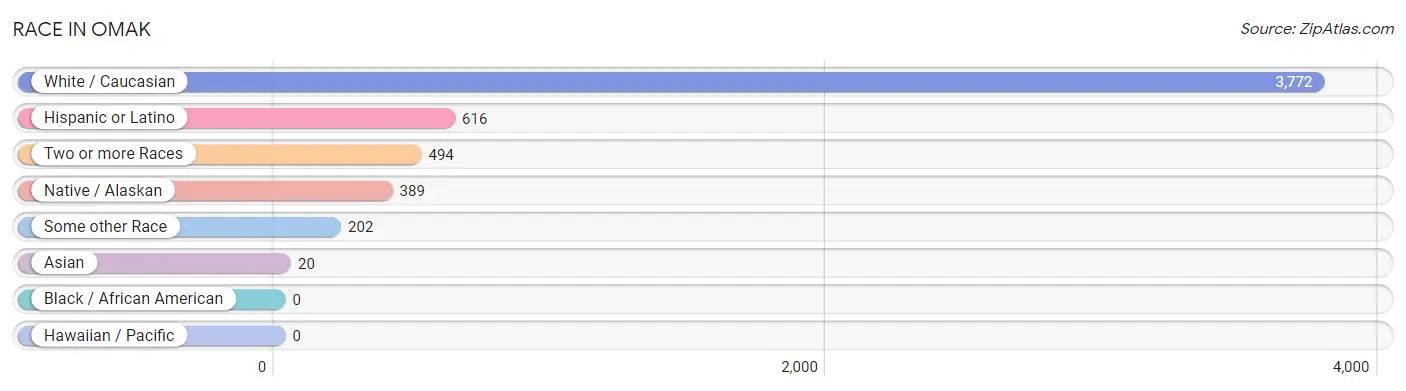
| Race | # Population | % Population |
| Asian | 20 | 0.4% |
| Black / African American | 0 | 0.0% |
| Hawaiian / Pacific | 0 | 0.0% |
| Hispanic or Latino | 616 | 12.6% |
| Native / Alaskan | 389 | 8.0% |
| White / Caucasian | 3,772 | 77.3% |
| Two or more Races | 494 | 10.1% |
| Some other Race | 202 | 4.1% |
| Total | 4,877 | 100.0% |
Ancestry in Omak
The most populous ancestries reported in Omak are American (821 | 16.8%), Irish (589 | 12.1%), German (525 | 10.8%), Mexican (380 | 7.8%), and Colville (319 | 6.5%), together accounting for 54.0% of all Omak residents.
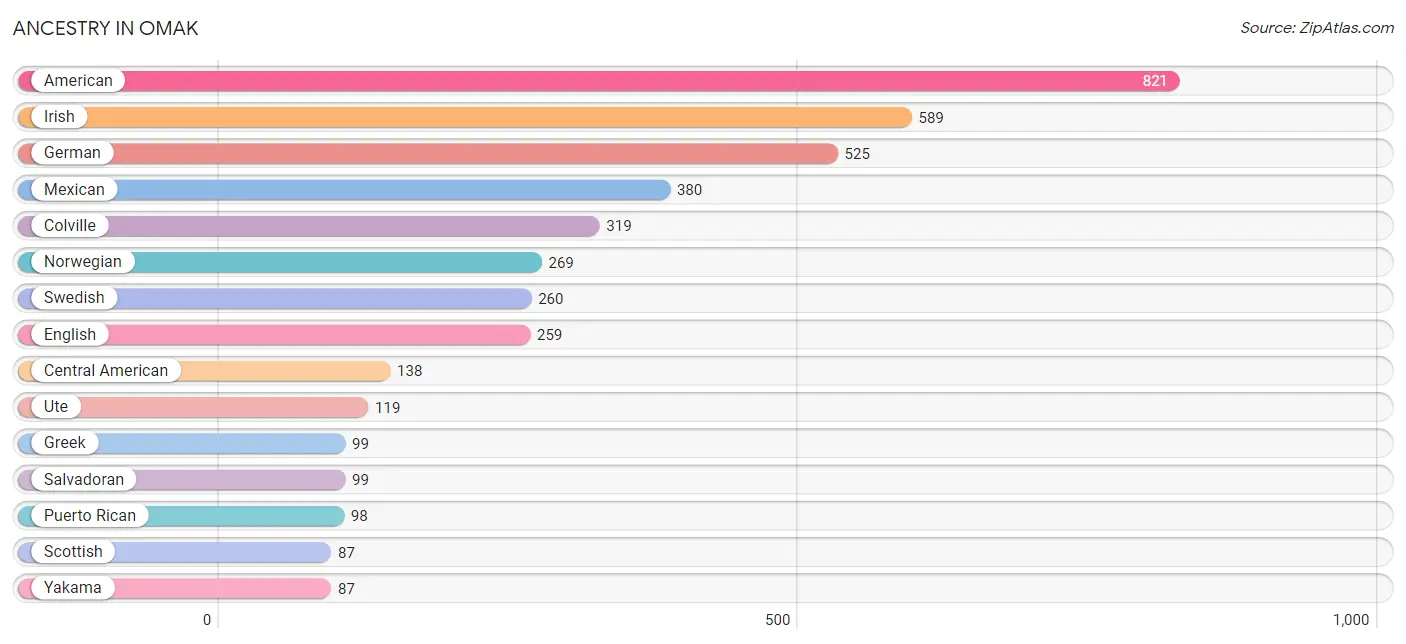
| Ancestry | # Population | % Population |
| American | 821 | 16.8% |
| Austrian | 5 | 0.1% |
| Bhutanese | 11 | 0.2% |
| Blackfeet | 27 | 0.5% |
| British | 20 | 0.4% |
| Central American | 138 | 2.8% |
| Cherokee | 13 | 0.3% |
| Colville | 319 | 6.5% |
| Costa Rican | 27 | 0.5% |
| Czechoslovakian | 11 | 0.2% |
| Dutch | 13 | 0.3% |
| Eastern European | 19 | 0.4% |
| English | 259 | 5.3% |
| European | 67 | 1.4% |
| Finnish | 19 | 0.4% |
| French | 85 | 1.7% |
| German | 525 | 10.8% |
| Greek | 99 | 2.0% |
| Guatemalan | 12 | 0.3% |
| Hungarian | 10 | 0.2% |
| Irish | 589 | 12.1% |
| Italian | 42 | 0.9% |
| Korean | 20 | 0.4% |
| Mexican | 380 | 7.8% |
| Native Hawaiian | 11 | 0.2% |
| Norwegian | 269 | 5.5% |
| Polish | 12 | 0.3% |
| Puerto Rican | 98 | 2.0% |
| Puget Sound Salish | 15 | 0.3% |
| Salvadoran | 99 | 2.0% |
| Scottish | 87 | 1.8% |
| Sioux | 4 | 0.1% |
| Slovak | 9 | 0.2% |
| Swedish | 260 | 5.3% |
| Ute | 119 | 2.4% |
| Welsh | 51 | 1.1% |
| Yakama | 87 | 1.8% |
| Yugoslavian | 7 | 0.1% |
| Yup'ik | 34 | 0.7% | View All 39 Rows |
Immigrants in Omak
The most numerous immigrant groups reported in Omak came from Central America (176 | 3.6%), Latin America (176 | 3.6%), El Salvador (99 | 2.0%), Mexico (65 | 1.3%), and Europe (23 | 0.5%), together accounting for 11.1% of all Omak residents.
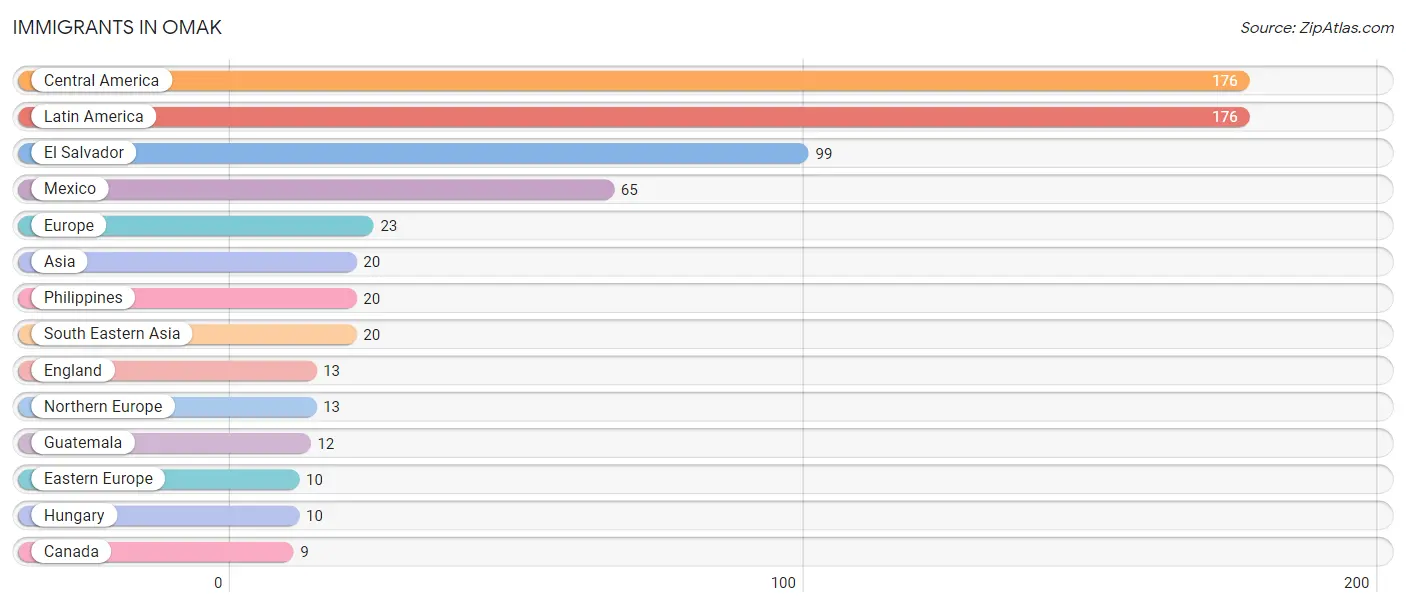
| Immigration Origin | # Population | % Population |
| Asia | 20 | 0.4% |
| Canada | 9 | 0.2% |
| Central America | 176 | 3.6% |
| Eastern Europe | 10 | 0.2% |
| El Salvador | 99 | 2.0% |
| England | 13 | 0.3% |
| Europe | 23 | 0.5% |
| Guatemala | 12 | 0.3% |
| Hungary | 10 | 0.2% |
| Latin America | 176 | 3.6% |
| Mexico | 65 | 1.3% |
| Northern Europe | 13 | 0.3% |
| Philippines | 20 | 0.4% |
| South Eastern Asia | 20 | 0.4% | View All 14 Rows |
Sex and Age in Omak
Sex and Age in Omak
The most populous age groups in Omak are 5 to 9 Years (300 | 14.1%) for men and 10 to 14 Years (305 | 11.1%) for women.
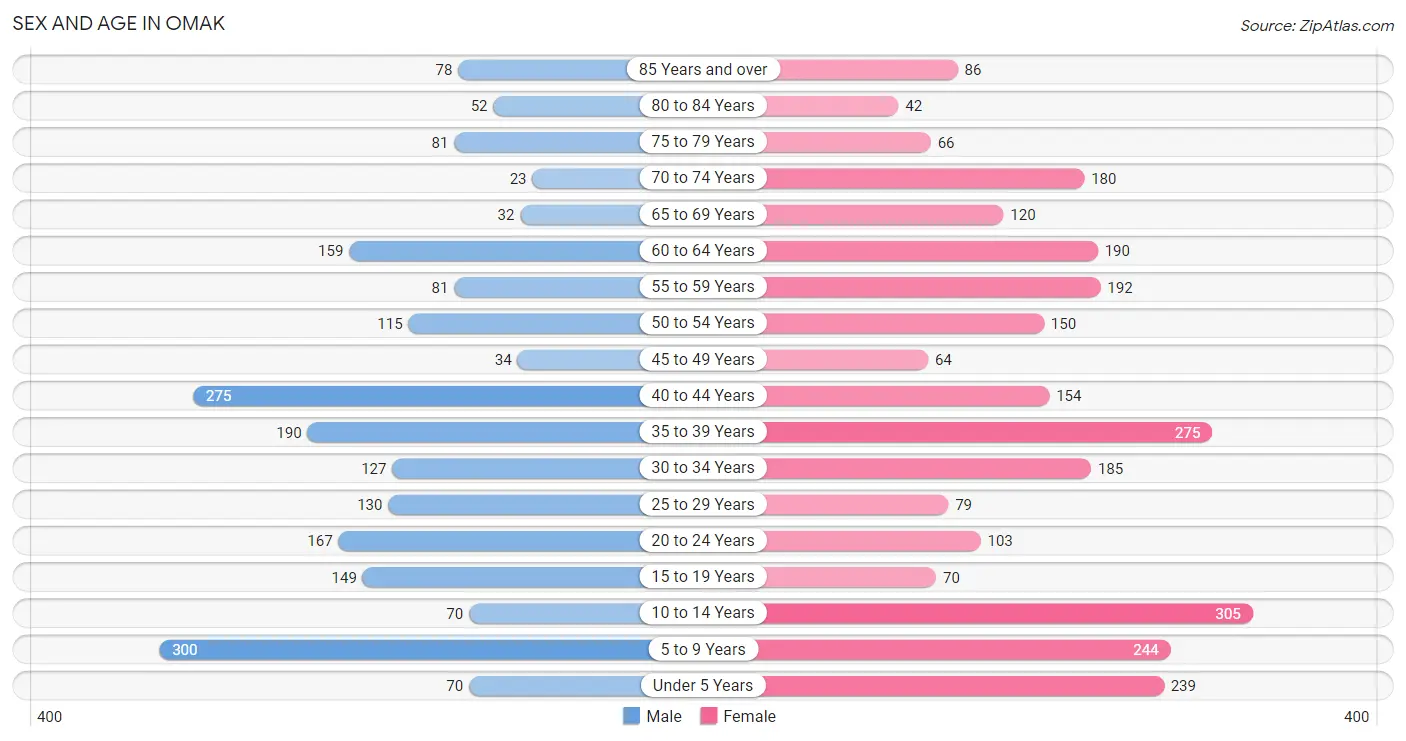
| Age Bracket | Male | Female |
| Under 5 Years | 70 (3.3%) | 239 (8.7%) |
| 5 to 9 Years | 300 (14.1%) | 244 (8.9%) |
| 10 to 14 Years | 70 (3.3%) | 305 (11.1%) |
| 15 to 19 Years | 149 (7.0%) | 70 (2.5%) |
| 20 to 24 Years | 167 (7.8%) | 103 (3.7%) |
| 25 to 29 Years | 130 (6.1%) | 79 (2.9%) |
| 30 to 34 Years | 127 (5.9%) | 185 (6.7%) |
| 35 to 39 Years | 190 (8.9%) | 275 (10.0%) |
| 40 to 44 Years | 275 (12.9%) | 154 (5.6%) |
| 45 to 49 Years | 34 (1.6%) | 64 (2.3%) |
| 50 to 54 Years | 115 (5.4%) | 150 (5.5%) |
| 55 to 59 Years | 81 (3.8%) | 192 (7.0%) |
| 60 to 64 Years | 159 (7.4%) | 190 (6.9%) |
| 65 to 69 Years | 32 (1.5%) | 120 (4.4%) |
| 70 to 74 Years | 23 (1.1%) | 180 (6.6%) |
| 75 to 79 Years | 81 (3.8%) | 66 (2.4%) |
| 80 to 84 Years | 52 (2.4%) | 42 (1.5%) |
| 85 Years and over | 78 (3.7%) | 86 (3.1%) |
| Total | 2,133 (100.0%) | 2,744 (100.0%) |
Families and Households in Omak
Median Family Size in Omak
The median family size in Omak is 2.85 persons per family, with single female/mother families (357 | 26.5%) accounting for the largest median family size of 3.04 persons per family. On the other hand, single male/father families (186 | 13.8%) represent the smallest median family size with 2.26 persons per family.
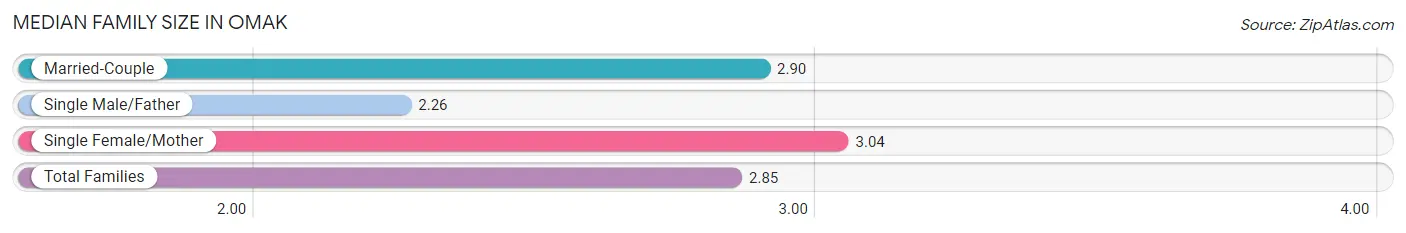
| Family Type | # Families | Family Size |
| Married-Couple | 803 (59.7%) | 2.90 |
| Single Male/Father | 186 (13.8%) | 2.26 |
| Single Female/Mother | 357 (26.5%) | 3.04 |
| Total Families | 1,346 (100.0%) | 2.85 |
Median Household Size in Omak
The median household size in Omak is 2.61 persons per household, with single female/mother households (357 | 19.5%) accounting for the largest median household size of 3.51 persons per household. non-family households (486 | 26.5%) represent the smallest median household size with 1.13 persons per household.
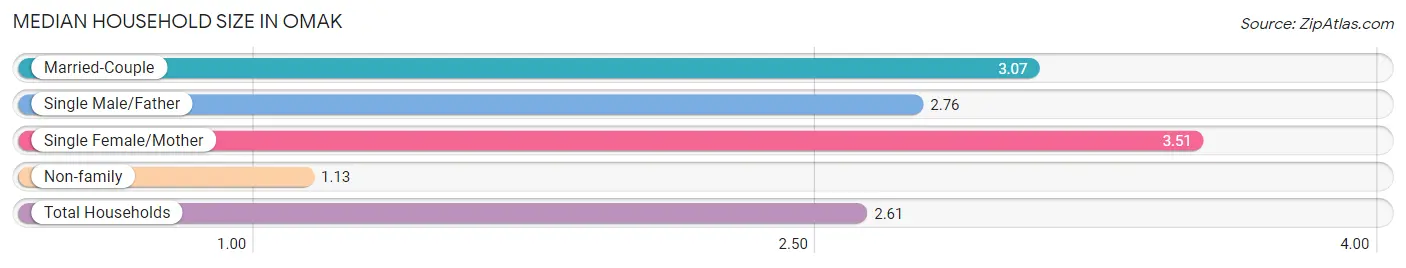
| Household Type | # Households | Household Size |
| Married-Couple | 803 (43.8%) | 3.07 |
| Single Male/Father | 186 (10.2%) | 2.76 |
| Single Female/Mother | 357 (19.5%) | 3.51 |
| Non-family | 486 (26.5%) | 1.13 |
| Total Households | 1,832 (100.0%) | 2.61 |
Household Size by Marriage Status in Omak
Out of a total of 1,832 households in Omak, 1,346 (73.5%) are family households, while 486 (26.5%) are nonfamily households. The most numerous type of family households are 2-person households, comprising 510, and the most common type of nonfamily households are 1-person households, comprising 438.
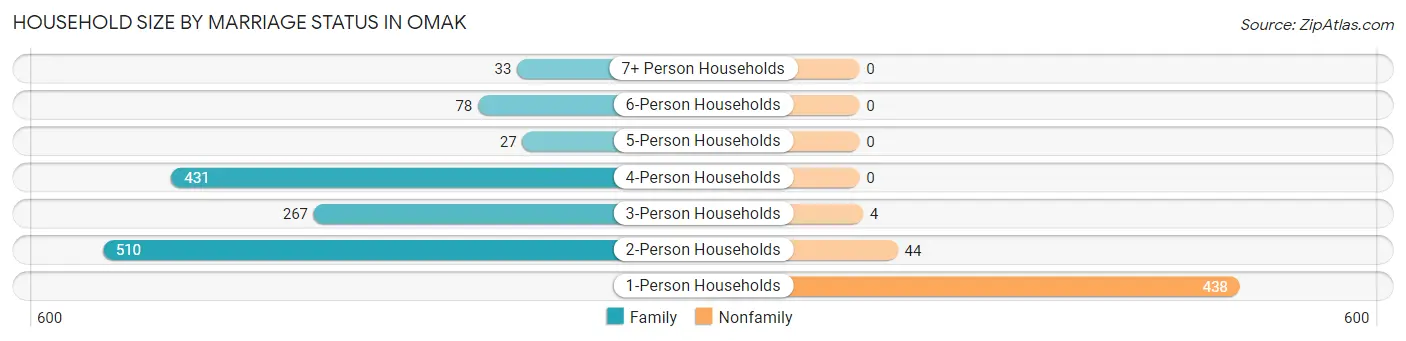
| Household Size | Family Households | Nonfamily Households |
| 1-Person Households | - | 438 (23.9%) |
| 2-Person Households | 510 (27.8%) | 44 (2.4%) |
| 3-Person Households | 267 (14.6%) | 4 (0.2%) |
| 4-Person Households | 431 (23.5%) | 0 (0.0%) |
| 5-Person Households | 27 (1.5%) | 0 (0.0%) |
| 6-Person Households | 78 (4.3%) | 0 (0.0%) |
| 7+ Person Households | 33 (1.8%) | 0 (0.0%) |
| Total | 1,346 (73.5%) | 486 (26.5%) |
Female Fertility in Omak
Fertility by Age in Omak
Average fertility rate in Omak is 26.0 births per 1,000 women. Women in the age bracket of 35 to 50 years have the highest fertility rate with 46.0 births per 1,000 women. Women in the age bracket of 35 to 50 years acount for 100.0% of all women with births.
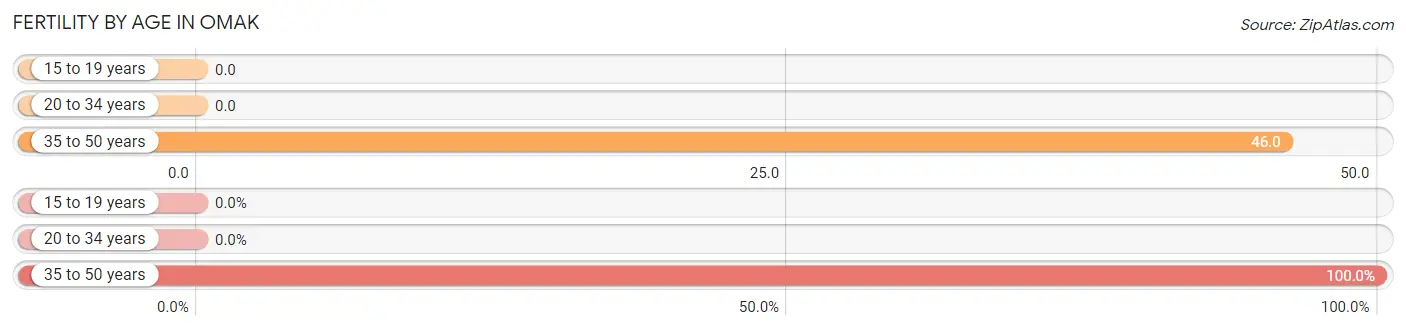
| Age Bracket | Women with Births | Births / 1,000 Women |
| 15 to 19 years | 0 (0.0%) | 0.0 |
| 20 to 34 years | 0 (0.0%) | 0.0 |
| 35 to 50 years | 27 (100.0%) | 46.0 |
| Total | 27 (100.0%) | 26.0 |
Fertility by Age by Marriage Status in Omak
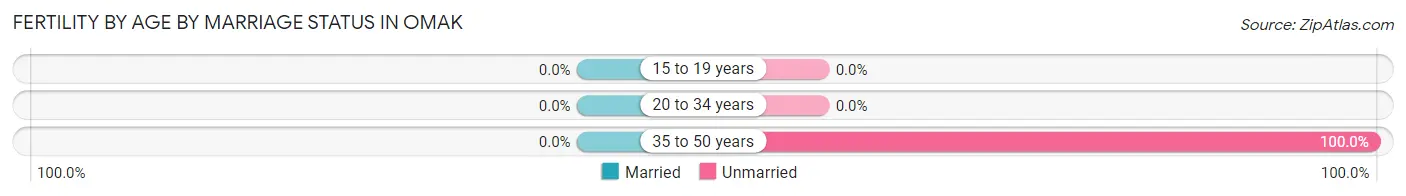
| Age Bracket | Married | Unmarried |
| 15 to 19 years | 0 (0.0%) | 0 (0.0%) |
| 20 to 34 years | 0 (0.0%) | 0 (0.0%) |
| 35 to 50 years | 0 (0.0%) | 27 (100.0%) |
| Total | 0 (0.0%) | 27 (100.0%) |
Fertility by Education in Omak
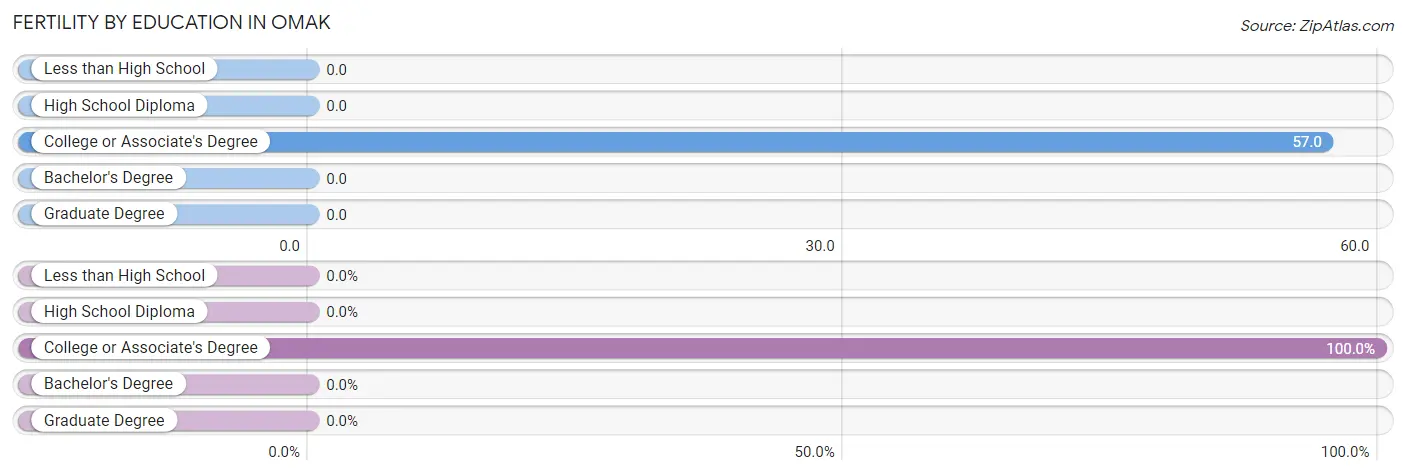
| Educational Attainment | Women with Births | Births / 1,000 Women |
| Less than High School | 0 (0.0%) | 0.0 |
| High School Diploma | 0 (0.0%) | 0.0 |
| College or Associate's Degree | 27 (100.0%) | 57.0 |
| Bachelor's Degree | 0 (0.0%) | 0.0 |
| Graduate Degree | 0 (0.0%) | 0.0 |
| Total | 27 (100.0%) | 26.0 |
Fertility by Education by Marriage Status in Omak
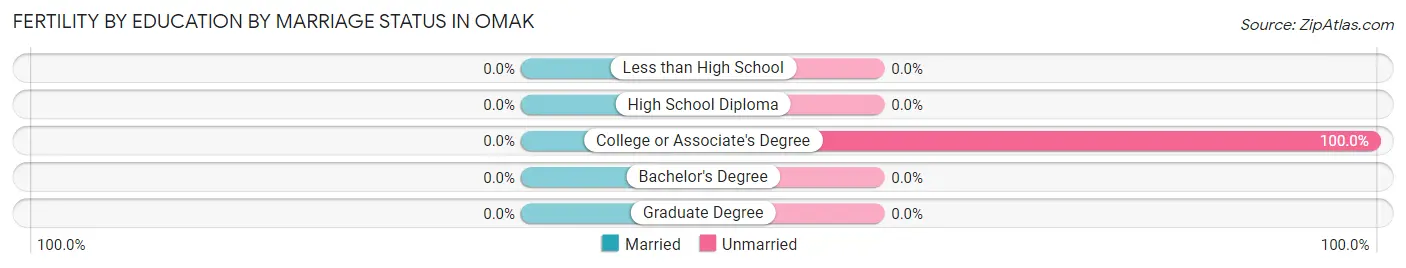
| Educational Attainment | Married | Unmarried |
| Less than High School | 0 (0.0%) | 0 (0.0%) |
| High School Diploma | 0 (0.0%) | 0 (0.0%) |
| College or Associate's Degree | 0 (0.0%) | 27 (100.0%) |
| Bachelor's Degree | 0 (0.0%) | 0 (0.0%) |
| Graduate Degree | 0 (0.0%) | 0 (0.0%) |
| Total | 0 (0.0%) | 27 (100.0%) |
Employment Characteristics in Omak
Employment by Class of Employer in Omak
Among the 2,077 employed individuals in Omak, private company employees (885 | 42.6%), not-for-profit organizations (439 | 21.1%), and local government employees (392 | 18.9%) make up the most common classes of employment.
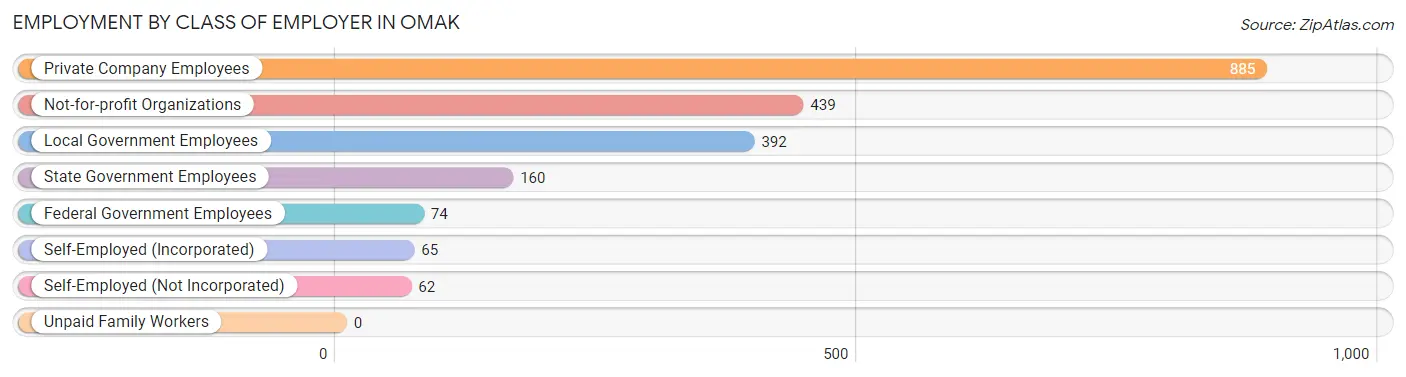
| Employer Class | # Employees | % Employees |
| Private Company Employees | 885 | 42.6% |
| Self-Employed (Incorporated) | 65 | 3.1% |
| Self-Employed (Not Incorporated) | 62 | 3.0% |
| Not-for-profit Organizations | 439 | 21.1% |
| Local Government Employees | 392 | 18.9% |
| State Government Employees | 160 | 7.7% |
| Federal Government Employees | 74 | 3.6% |
| Unpaid Family Workers | 0 | 0.0% |
| Total | 2,077 | 100.0% |
Employment Status by Age in Omak
According to the labor force statistics for Omak, out of the total population over 16 years of age (3,534), 62.3% or 2,202 individuals are in the labor force, with 4.9% or 108 of them unemployed. The age group with the highest labor force participation rate is 16 to 19 years, with 100.0% or 104 individuals in the labor force. Within the labor force, the 16 to 19 years age range has the highest percentage of unemployed individuals, with 20.2% or 21 of them being unemployed.
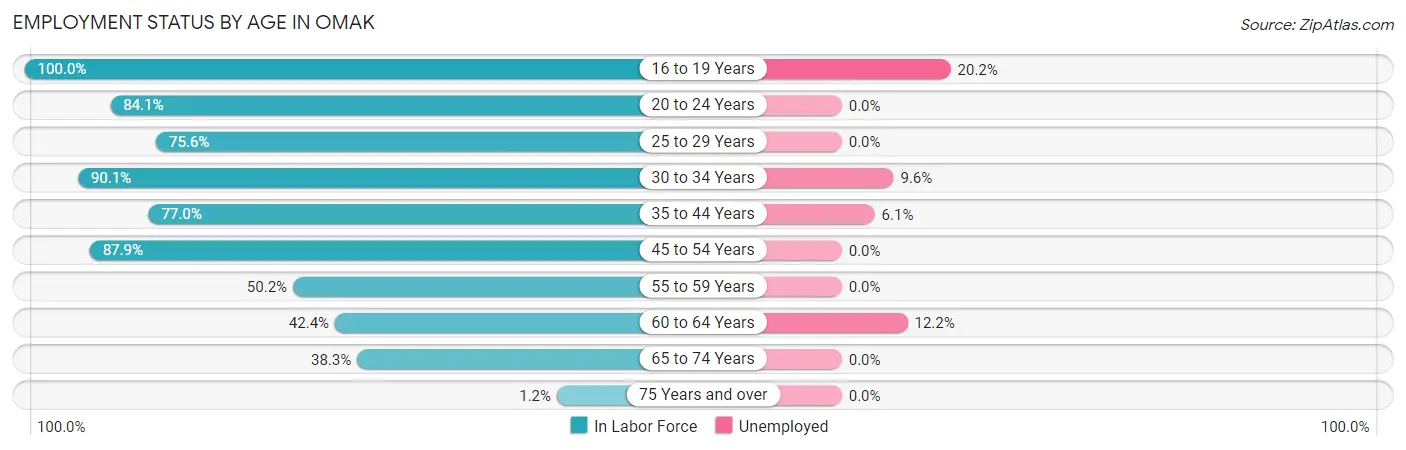
| Age Bracket | In Labor Force | Unemployed |
| 16 to 19 Years | 104 (100.0%) | 21 (20.2%) |
| 20 to 24 Years | 227 (84.1%) | 0 (0.0%) |
| 25 to 29 Years | 158 (75.6%) | 0 (0.0%) |
| 30 to 34 Years | 281 (90.1%) | 27 (9.6%) |
| 35 to 44 Years | 688 (77.0%) | 42 (6.1%) |
| 45 to 54 Years | 319 (87.9%) | 0 (0.0%) |
| 55 to 59 Years | 137 (50.2%) | 0 (0.0%) |
| 60 to 64 Years | 148 (42.4%) | 18 (12.2%) |
| 65 to 74 Years | 136 (38.3%) | 0 (0.0%) |
| 75 Years and over | 5 (1.2%) | 0 (0.0%) |
| Total | 2,202 (62.3%) | 108 (4.9%) |
Employment Status by Educational Attainment in Omak
According to labor force statistics for Omak, 72.1% of individuals (1,730) out of the total population between 25 and 64 years of age (2,400) are in the labor force, with 5.0% or 86 of them being unemployed. The group with the highest labor force participation rate are those with the educational attainment of bachelor's degree or higher, with 84.6% or 405 individuals in the labor force. Within the labor force, individuals with college / associate degree education have the highest percentage of unemployment, with 8.6% or 58 of them being unemployed.
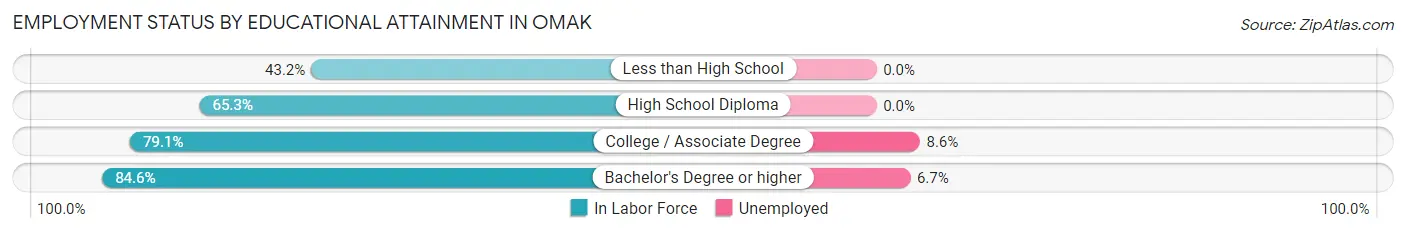
| Educational Attainment | In Labor Force | Unemployed |
| Less than High School | 89 (43.2%) | 0 (0.0%) |
| High School Diploma | 564 (65.3%) | 0 (0.0%) |
| College / Associate Degree | 673 (79.1%) | 73 (8.6%) |
| Bachelor's Degree or higher | 405 (84.6%) | 32 (6.7%) |
| Total | 1,730 (72.1%) | 120 (5.0%) |
Employment Occupations by Sex in Omak
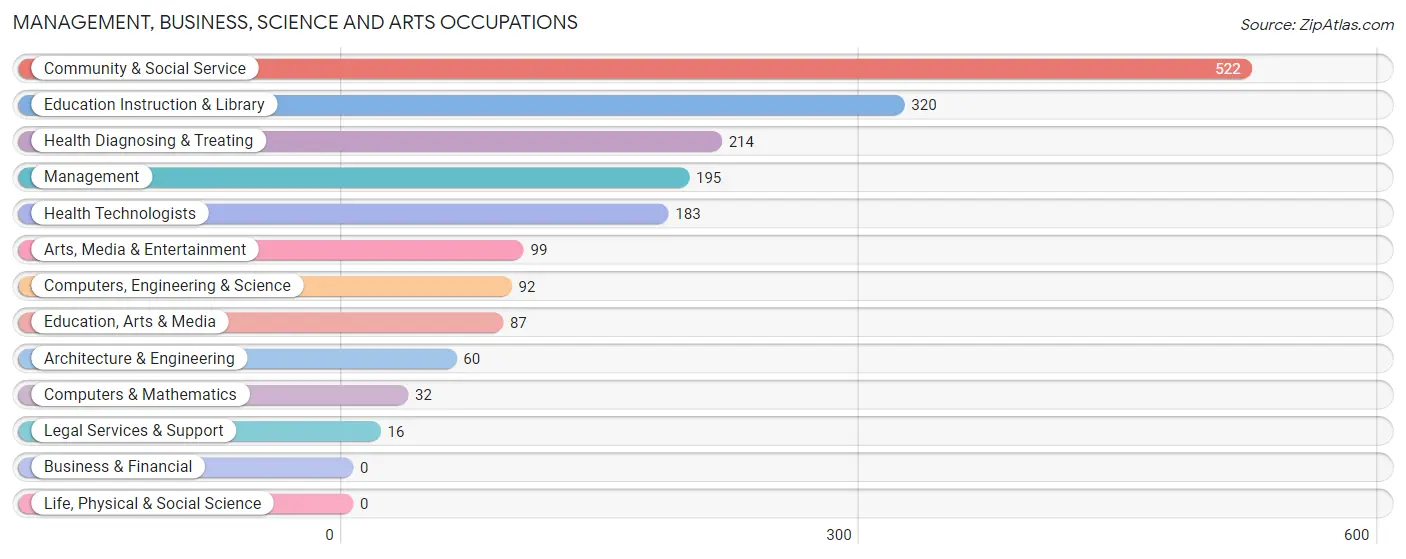
Management, Business, Science and Arts Occupations
The most common Management, Business, Science and Arts occupations in Omak are Community & Social Service (522 | 25.3%), Education Instruction & Library (320 | 15.5%), Health Diagnosing & Treating (214 | 10.4%), Management (195 | 9.4%), and Health Technologists (183 | 8.9%).
Management, Business, Science and Arts Occupations by Sex
Within the Management, Business, Science and Arts occupations in Omak, the most male-oriented occupations are Computers, Engineering & Science (100.0%), Computers & Mathematics (100.0%), and Architecture & Engineering (100.0%), while the most female-oriented occupations are Legal Services & Support (100.0%), Arts, Media & Entertainment (100.0%), and Health Diagnosing & Treating (100.0%).
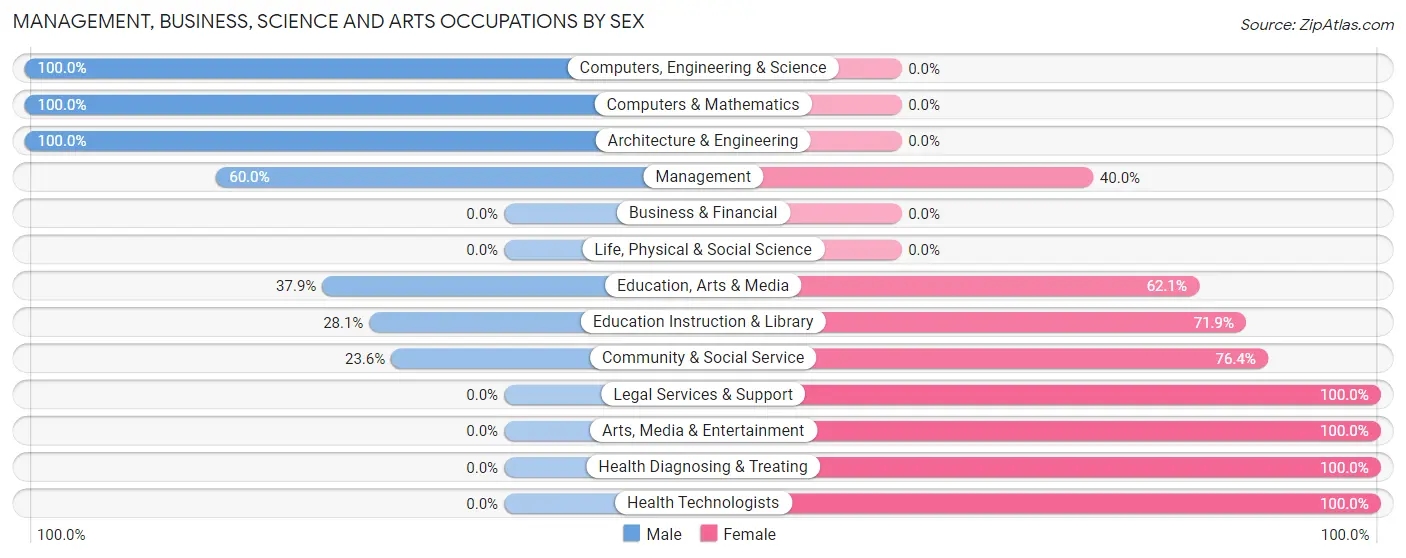
| Occupation | Male | Female |
| Management | 117 (60.0%) | 78 (40.0%) |
| Business & Financial | 0 (0.0%) | 0 (0.0%) |
| Computers, Engineering & Science | 92 (100.0%) | 0 (0.0%) |
| Computers & Mathematics | 32 (100.0%) | 0 (0.0%) |
| Architecture & Engineering | 60 (100.0%) | 0 (0.0%) |
| Life, Physical & Social Science | 0 (0.0%) | 0 (0.0%) |
| Community & Social Service | 123 (23.6%) | 399 (76.4%) |
| Education, Arts & Media | 33 (37.9%) | 54 (62.1%) |
| Legal Services & Support | 0 (0.0%) | 16 (100.0%) |
| Education Instruction & Library | 90 (28.1%) | 230 (71.9%) |
| Arts, Media & Entertainment | 0 (0.0%) | 99 (100.0%) |
| Health Diagnosing & Treating | 0 (0.0%) | 214 (100.0%) |
| Health Technologists | 0 (0.0%) | 183 (100.0%) |
| Total (Category) | 332 (32.5%) | 691 (67.5%) |
| Total (Overall) | 958 (46.4%) | 1,108 (53.6%) |
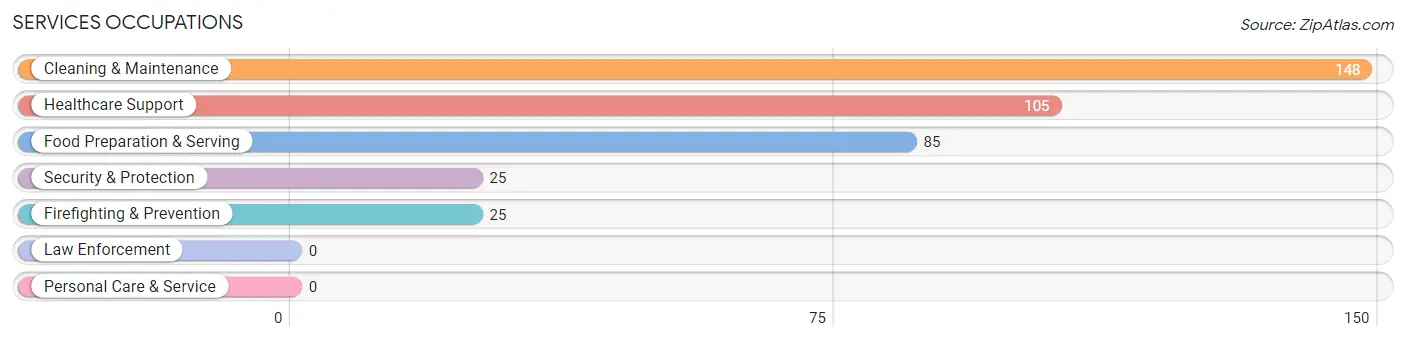
Services Occupations
The most common Services occupations in Omak are Cleaning & Maintenance (148 | 7.2%), Healthcare Support (105 | 5.1%), Food Preparation & Serving (85 | 4.1%), Security & Protection (25 | 1.2%), and Firefighting & Prevention (25 | 1.2%).
Services Occupations by Sex
Within the Services occupations in Omak, the most male-oriented occupations are Food Preparation & Serving (50.6%), Security & Protection (44.0%), and Firefighting & Prevention (44.0%), while the most female-oriented occupations are Healthcare Support (68.6%), Cleaning & Maintenance (66.2%), and Security & Protection (56.0%).
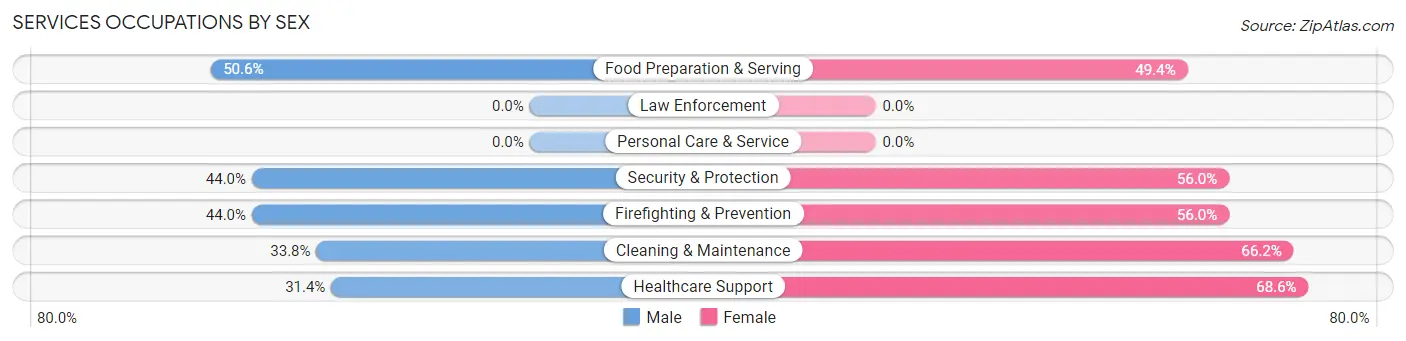
| Occupation | Male | Female |
| Healthcare Support | 33 (31.4%) | 72 (68.6%) |
| Security & Protection | 11 (44.0%) | 14 (56.0%) |
| Firefighting & Prevention | 11 (44.0%) | 14 (56.0%) |
| Law Enforcement | 0 (0.0%) | 0 (0.0%) |
| Food Preparation & Serving | 43 (50.6%) | 42 (49.4%) |
| Cleaning & Maintenance | 50 (33.8%) | 98 (66.2%) |
| Personal Care & Service | 0 (0.0%) | 0 (0.0%) |
| Total (Category) | 137 (37.7%) | 226 (62.3%) |
| Total (Overall) | 958 (46.4%) | 1,108 (53.6%) |
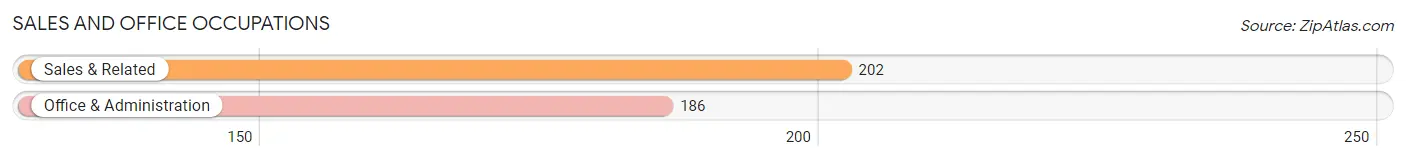
Sales and Office Occupations
The most common Sales and Office occupations in Omak are Sales & Related (202 | 9.8%), and Office & Administration (186 | 9.0%).
Sales and Office Occupations by Sex
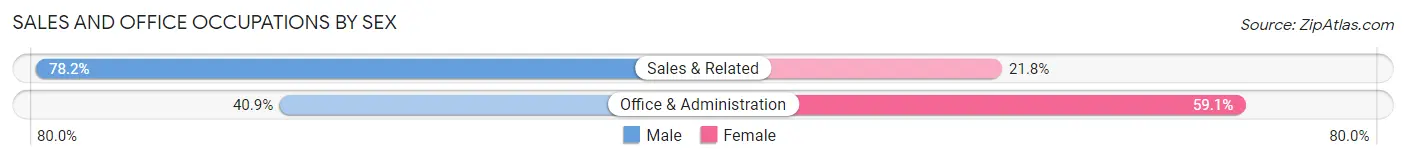
| Occupation | Male | Female |
| Sales & Related | 158 (78.2%) | 44 (21.8%) |
| Office & Administration | 76 (40.9%) | 110 (59.1%) |
| Total (Category) | 234 (60.3%) | 154 (39.7%) |
| Total (Overall) | 958 (46.4%) | 1,108 (53.6%) |
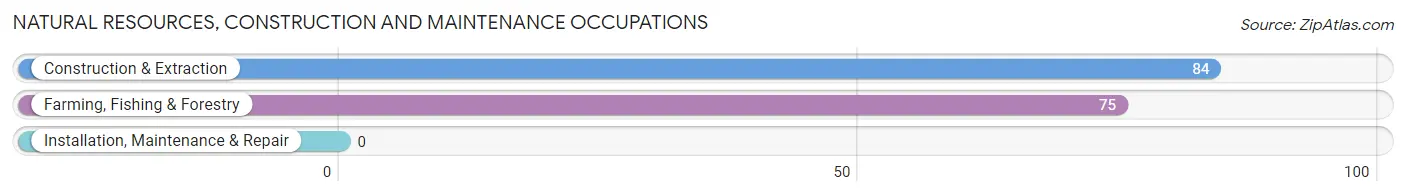
Natural Resources, Construction and Maintenance Occupations
The most common Natural Resources, Construction and Maintenance occupations in Omak are Construction & Extraction (84 | 4.1%), and Farming, Fishing & Forestry (75 | 3.6%).
Natural Resources, Construction and Maintenance Occupations by Sex
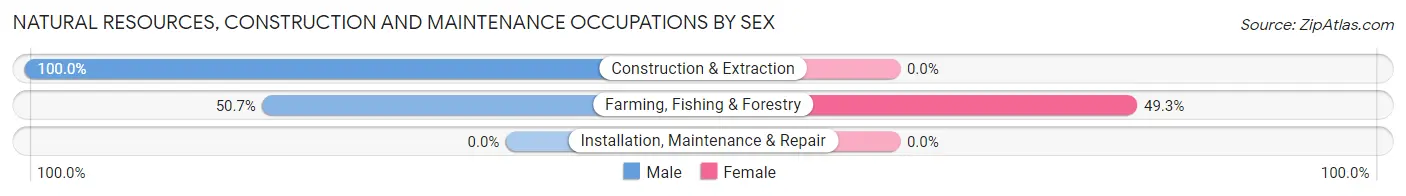
| Occupation | Male | Female |
| Farming, Fishing & Forestry | 38 (50.7%) | 37 (49.3%) |
| Construction & Extraction | 84 (100.0%) | 0 (0.0%) |
| Installation, Maintenance & Repair | 0 (0.0%) | 0 (0.0%) |
| Total (Category) | 122 (76.7%) | 37 (23.3%) |
| Total (Overall) | 958 (46.4%) | 1,108 (53.6%) |
Production, Transportation and Moving Occupations
The most common Production, Transportation and Moving occupations in Omak are Production (81 | 3.9%), Material Moving (44 | 2.1%), and Transportation (8 | 0.4%).
Production, Transportation and Moving Occupations by Sex
| Occupation | Male | Female |
| Production | 81 (100.0%) | 0 (0.0%) |
| Transportation | 8 (100.0%) | 0 (0.0%) |
| Material Moving | 44 (100.0%) | 0 (0.0%) |
| Total (Category) | 133 (100.0%) | 0 (0.0%) |
| Total (Overall) | 958 (46.4%) | 1,108 (53.6%) |
Employment Industries by Sex in Omak
Employment Industries in Omak
The major employment industries in Omak include Health Care & Social Assistance (600 | 29.0%), Educational Services (429 | 20.8%), Retail Trade (212 | 10.3%), Construction (144 | 7.0%), and Wholesale Trade (137 | 6.6%).
Employment Industries by Sex in Omak
The Omak industries that see more men than women are Construction (100.0%), Manufacturing (100.0%), and Transportation & Warehousing (100.0%), whereas the industries that tend to have a higher number of women are Finance & Insurance (100.0%), Health Care & Social Assistance (81.7%), and Information (80.8%).
| Industry | Male | Female |
| Agriculture, Fishing & Hunting | 38 (50.7%) | 37 (49.3%) |
| Mining, Quarrying, & Extraction | 0 (0.0%) | 0 (0.0%) |
| Construction | 144 (100.0%) | 0 (0.0%) |
| Manufacturing | 5 (100.0%) | 0 (0.0%) |
| Wholesale Trade | 71 (51.8%) | 66 (48.2%) |
| Retail Trade | 194 (91.5%) | 18 (8.5%) |
| Transportation & Warehousing | 10 (100.0%) | 0 (0.0%) |
| Utilities | 119 (100.0%) | 0 (0.0%) |
| Information | 10 (19.2%) | 42 (80.8%) |
| Finance & Insurance | 0 (0.0%) | 58 (100.0%) |
| Real Estate, Rental & Leasing | 0 (0.0%) | 0 (0.0%) |
| Professional & Scientific | 17 (100.0%) | 0 (0.0%) |
| Enterprise Management | 0 (0.0%) | 0 (0.0%) |
| Administrative & Support | 20 (100.0%) | 0 (0.0%) |
| Educational Services | 131 (30.5%) | 298 (69.5%) |
| Health Care & Social Assistance | 110 (18.3%) | 490 (81.7%) |
| Arts, Entertainment & Recreation | 25 (71.4%) | 10 (28.6%) |
| Accommodation & Food Services | 43 (89.6%) | 5 (10.4%) |
| Public Administration | 21 (25.3%) | 62 (74.7%) |
| Total | 958 (46.4%) | 1,108 (53.6%) |
Education in Omak
School Enrollment in Omak
The most common levels of schooling among the 1,452 students in Omak are elementary school (308 | 21.2%), college / undergraduate (285 | 19.6%), and middle school (274 | 18.9%).
| School Level | # Students | % Students |
| Nursery / Preschool | 110 | 7.6% |
| Kindergarten | 217 | 14.9% |
| Elementary School | 308 | 21.2% |
| Middle School | 274 | 18.9% |
| High School | 199 | 13.7% |
| College / Undergraduate | 285 | 19.6% |
| Graduate / Professional | 59 | 4.1% |
| Total | 1,452 | 100.0% |
School Enrollment by Age by Funding Source in Omak
Out of a total of 1,452 students who are enrolled in schools in Omak, 128 (8.8%) attend a private institution, while the remaining 1,324 (91.2%) are enrolled in public schools. The age group of 3 to 4 year olds has the highest likelihood of being enrolled in private schools, with 37 (100.0% in the age bracket) enrolled. Conversely, the age group of 20 to 24 year olds has the lowest likelihood of being enrolled in a private school, with 16 (100.0% in the age bracket) attending a public institution.
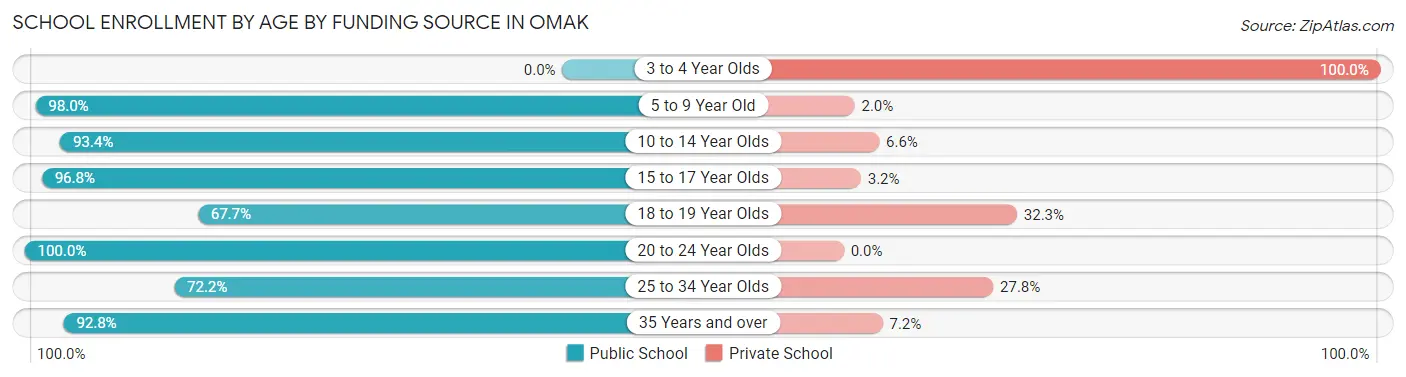
| Age Bracket | Public School | Private School |
| 3 to 4 Year Olds | 0 (0.0%) | 37 (100.0%) |
| 5 to 9 Year Old | 533 (98.0%) | 11 (2.0%) |
| 10 to 14 Year Olds | 297 (93.4%) | 21 (6.6%) |
| 15 to 17 Year Olds | 182 (96.8%) | 6 (3.2%) |
| 18 to 19 Year Olds | 21 (67.7%) | 10 (32.3%) |
| 20 to 24 Year Olds | 16 (100.0%) | 0 (0.0%) |
| 25 to 34 Year Olds | 70 (72.2%) | 27 (27.8%) |
| 35 Years and over | 205 (92.8%) | 16 (7.2%) |
| Total | 1,324 (91.2%) | 128 (8.8%) |
Educational Attainment by Field of Study in Omak
Education (134 | 22.6%), business (120 | 20.3%), psychology (82 | 13.9%), science & technology (79 | 13.3%), and social sciences (48 | 8.1%) are the most common fields of study among 592 individuals in Omak who have obtained a bachelor's degree or higher.
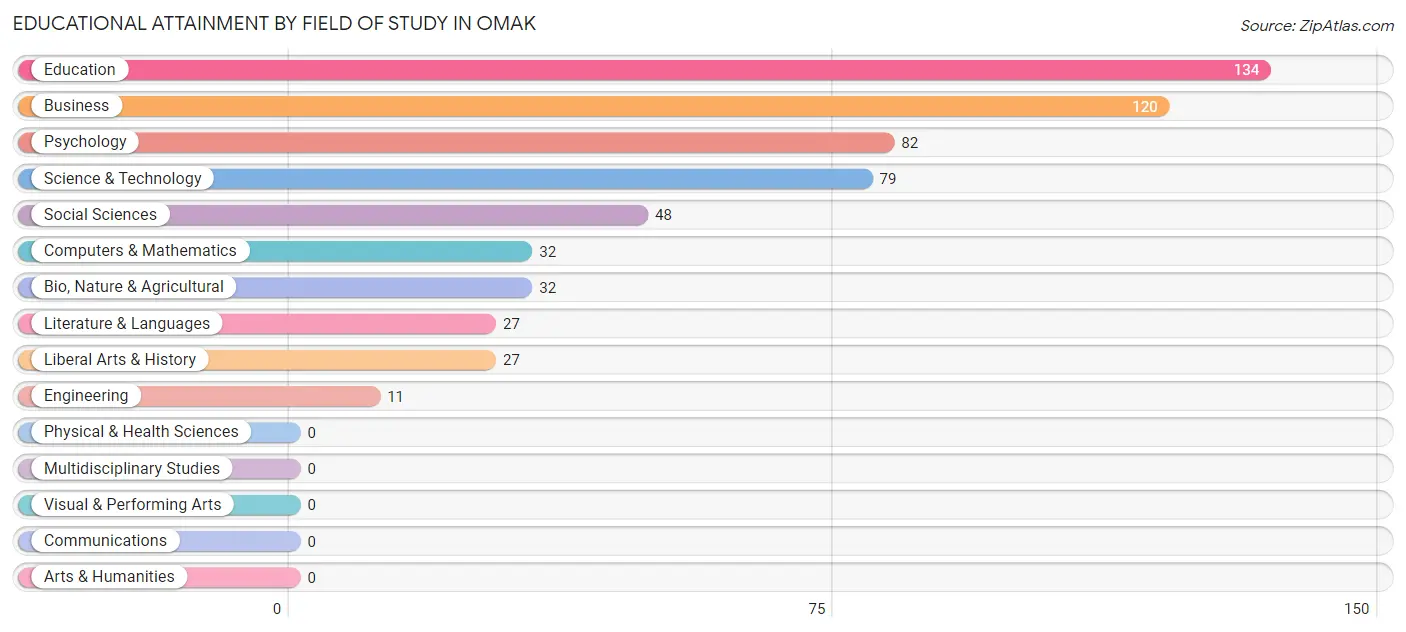
| Field of Study | # Graduates | % Graduates |
| Computers & Mathematics | 32 | 5.4% |
| Bio, Nature & Agricultural | 32 | 5.4% |
| Physical & Health Sciences | 0 | 0.0% |
| Psychology | 82 | 13.9% |
| Social Sciences | 48 | 8.1% |
| Engineering | 11 | 1.9% |
| Multidisciplinary Studies | 0 | 0.0% |
| Science & Technology | 79 | 13.3% |
| Business | 120 | 20.3% |
| Education | 134 | 22.6% |
| Literature & Languages | 27 | 4.6% |
| Liberal Arts & History | 27 | 4.6% |
| Visual & Performing Arts | 0 | 0.0% |
| Communications | 0 | 0.0% |
| Arts & Humanities | 0 | 0.0% |
| Total | 592 | 100.0% |
Transportation & Commute in Omak
Vehicle Availability by Sex in Omak
The most prevalent vehicle ownership categories in Omak are males with 3 vehicles (360, accounting for 39.8%) and females with 3 vehicles (297, making up 31.6%).
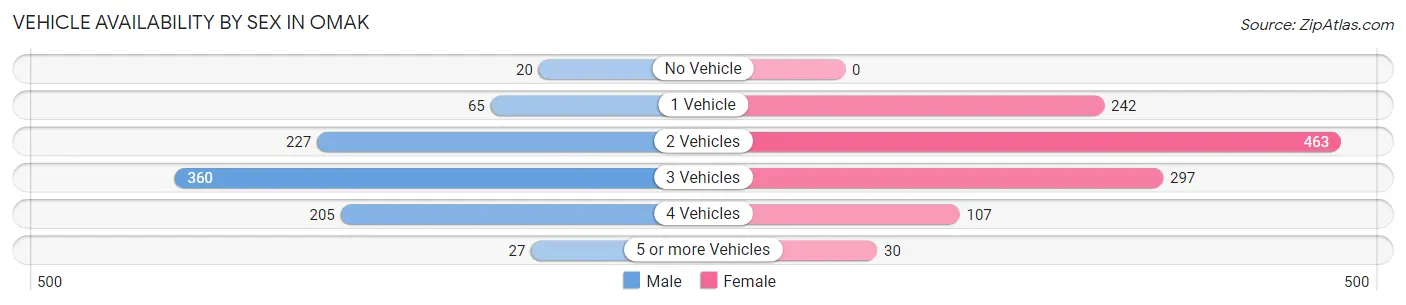
| Vehicles Available | Male | Female |
| No Vehicle | 20 (2.2%) | 0 (0.0%) |
| 1 Vehicle | 65 (7.2%) | 242 (21.2%) |
| 2 Vehicles | 227 (25.1%) | 463 (40.6%) |
| 3 Vehicles | 360 (39.8%) | 297 (26.1%) |
| 4 Vehicles | 205 (22.7%) | 107 (9.4%) |
| 5 or more Vehicles | 27 (3.0%) | 30 (2.6%) |
| Total | 904 (100.0%) | 1,139 (100.0%) |
Commute Time in Omak
The most frequently occuring commute durations in Omak are 5 to 9 minutes (579 commuters, 29.5%), 10 to 14 minutes (577 commuters, 29.4%), and less than 5 minutes (410 commuters, 20.9%).
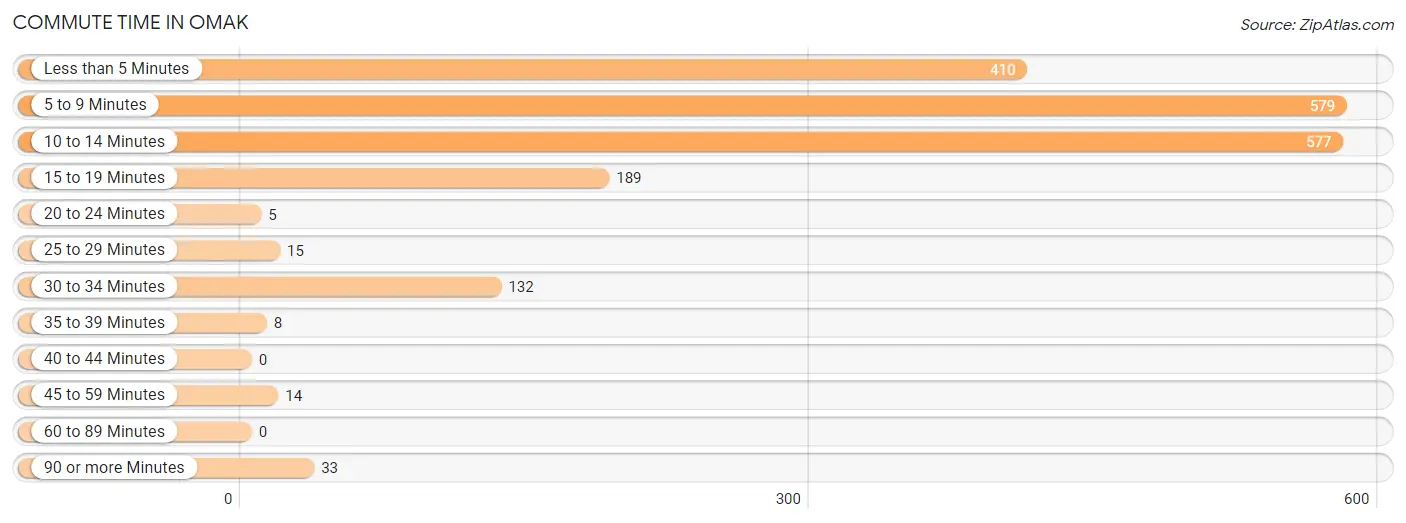
| Commute Time | # Commuters | % Commuters |
| Less than 5 Minutes | 410 | 20.9% |
| 5 to 9 Minutes | 579 | 29.5% |
| 10 to 14 Minutes | 577 | 29.4% |
| 15 to 19 Minutes | 189 | 9.6% |
| 20 to 24 Minutes | 5 | 0.3% |
| 25 to 29 Minutes | 15 | 0.8% |
| 30 to 34 Minutes | 132 | 6.7% |
| 35 to 39 Minutes | 8 | 0.4% |
| 40 to 44 Minutes | 0 | 0.0% |
| 45 to 59 Minutes | 14 | 0.7% |
| 60 to 89 Minutes | 0 | 0.0% |
| 90 or more Minutes | 33 | 1.7% |
Commute Time by Sex in Omak
The most common commute times in Omak are 10 to 14 minutes (263 commuters, 30.8%) for males and 5 to 9 minutes (334 commuters, 30.1%) for females.
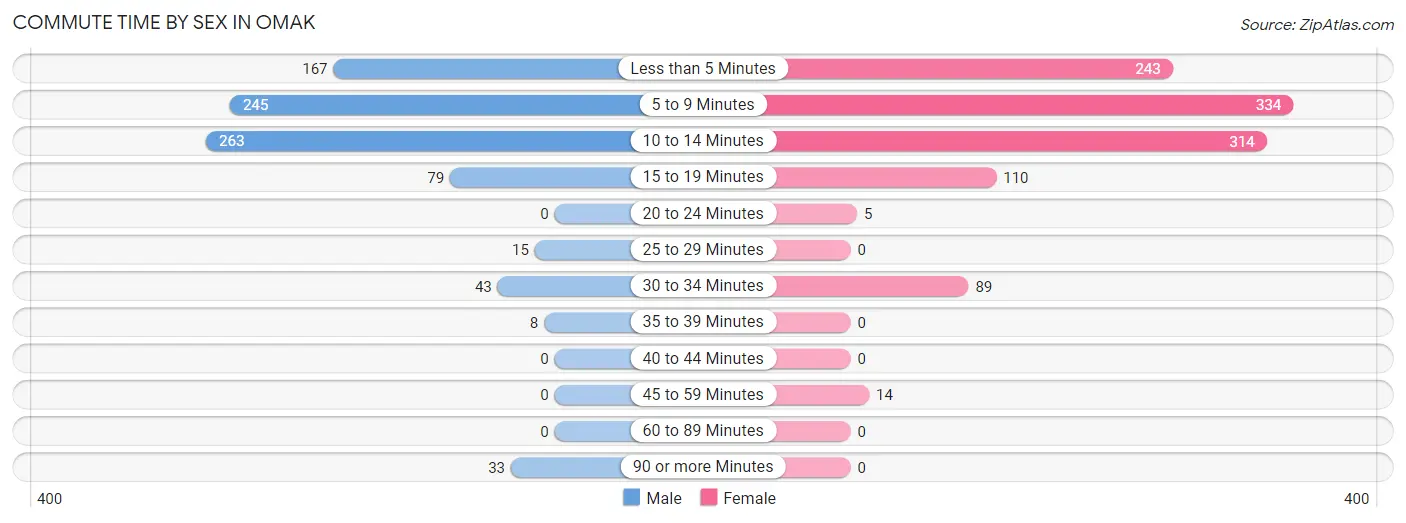
| Commute Time | Male | Female |
| Less than 5 Minutes | 167 (19.6%) | 243 (21.9%) |
| 5 to 9 Minutes | 245 (28.7%) | 334 (30.1%) |
| 10 to 14 Minutes | 263 (30.8%) | 314 (28.3%) |
| 15 to 19 Minutes | 79 (9.3%) | 110 (9.9%) |
| 20 to 24 Minutes | 0 (0.0%) | 5 (0.4%) |
| 25 to 29 Minutes | 15 (1.8%) | 0 (0.0%) |
| 30 to 34 Minutes | 43 (5.0%) | 89 (8.0%) |
| 35 to 39 Minutes | 8 (0.9%) | 0 (0.0%) |
| 40 to 44 Minutes | 0 (0.0%) | 0 (0.0%) |
| 45 to 59 Minutes | 0 (0.0%) | 14 (1.3%) |
| 60 to 89 Minutes | 0 (0.0%) | 0 (0.0%) |
| 90 or more Minutes | 33 (3.9%) | 0 (0.0%) |
Time of Departure to Work by Sex in Omak
The most frequent times of departure to work in Omak are 7:30 AM to 7:59 AM (185, 21.7%) for males and 7:30 AM to 7:59 AM (348, 31.4%) for females.
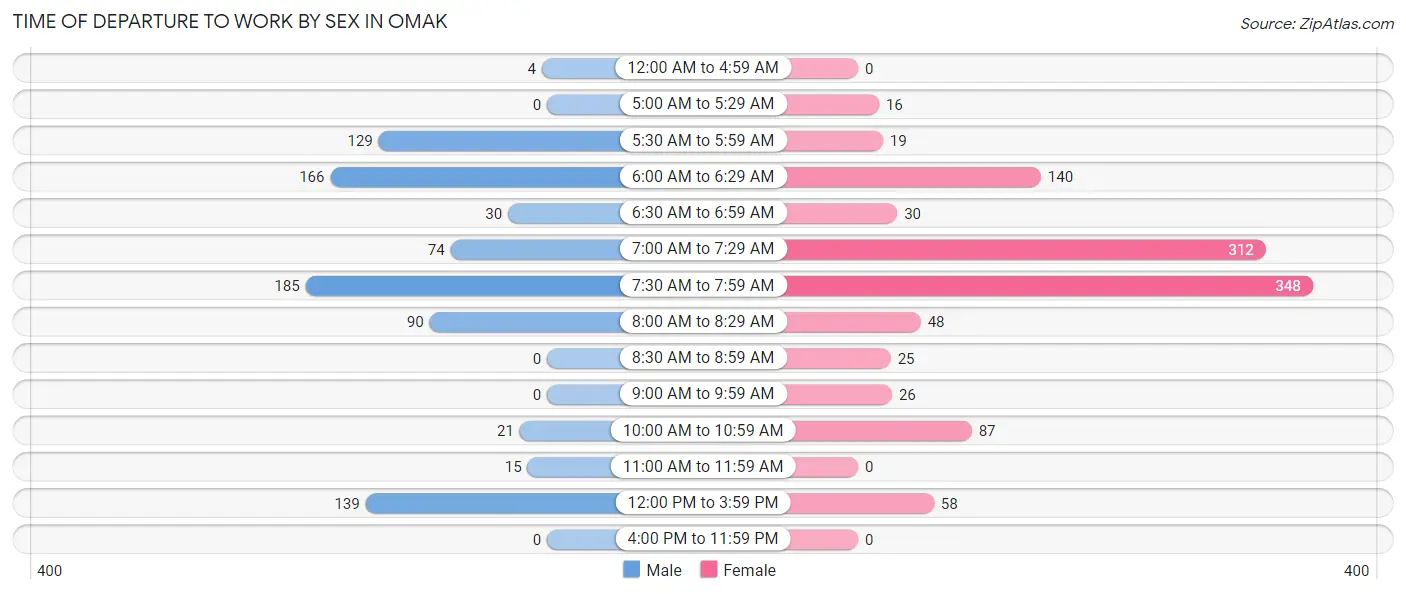
| Time of Departure | Male | Female |
| 12:00 AM to 4:59 AM | 4 (0.5%) | 0 (0.0%) |
| 5:00 AM to 5:29 AM | 0 (0.0%) | 16 (1.4%) |
| 5:30 AM to 5:59 AM | 129 (15.1%) | 19 (1.7%) |
| 6:00 AM to 6:29 AM | 166 (19.5%) | 140 (12.6%) |
| 6:30 AM to 6:59 AM | 30 (3.5%) | 30 (2.7%) |
| 7:00 AM to 7:29 AM | 74 (8.7%) | 312 (28.1%) |
| 7:30 AM to 7:59 AM | 185 (21.7%) | 348 (31.4%) |
| 8:00 AM to 8:29 AM | 90 (10.5%) | 48 (4.3%) |
| 8:30 AM to 8:59 AM | 0 (0.0%) | 25 (2.2%) |
| 9:00 AM to 9:59 AM | 0 (0.0%) | 26 (2.3%) |
| 10:00 AM to 10:59 AM | 21 (2.5%) | 87 (7.8%) |
| 11:00 AM to 11:59 AM | 15 (1.8%) | 0 (0.0%) |
| 12:00 PM to 3:59 PM | 139 (16.3%) | 58 (5.2%) |
| 4:00 PM to 11:59 PM | 0 (0.0%) | 0 (0.0%) |
| Total | 853 (100.0%) | 1,109 (100.0%) |
Housing Occupancy in Omak
Occupancy by Ownership in Omak
Of the total 1,832 dwellings in Omak, owner-occupied units account for 1,186 (64.7%), while renter-occupied units make up 646 (35.3%).
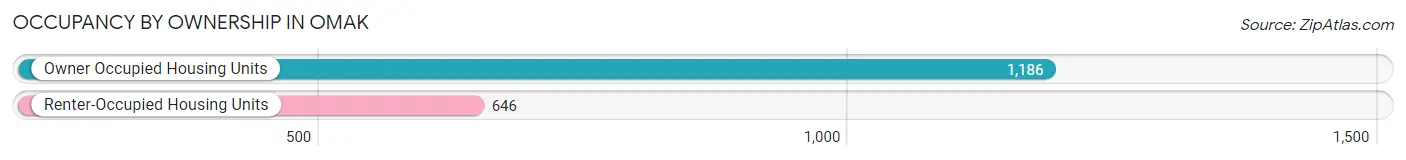
| Occupancy | # Housing Units | % Housing Units |
| Owner Occupied Housing Units | 1,186 | 64.7% |
| Renter-Occupied Housing Units | 646 | 35.3% |
| Total Occupied Housing Units | 1,832 | 100.0% |
Occupancy by Household Size in Omak
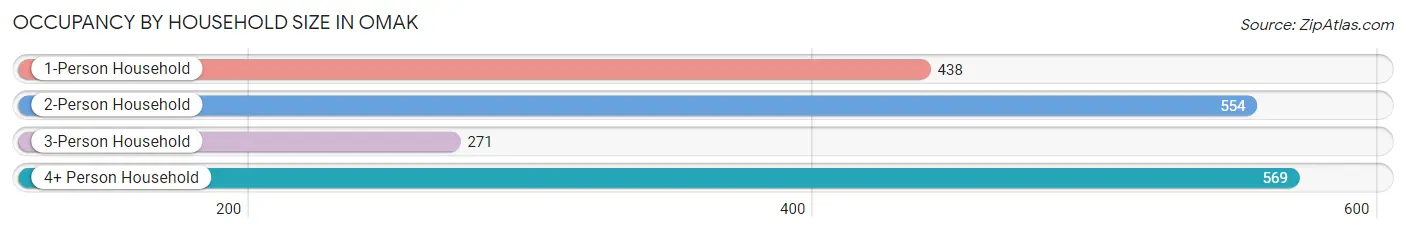
| Household Size | # Housing Units | % Housing Units |
| 1-Person Household | 438 | 23.9% |
| 2-Person Household | 554 | 30.2% |
| 3-Person Household | 271 | 14.8% |
| 4+ Person Household | 569 | 31.1% |
| Total Housing Units | 1,832 | 100.0% |
Occupancy by Ownership by Household Size in Omak
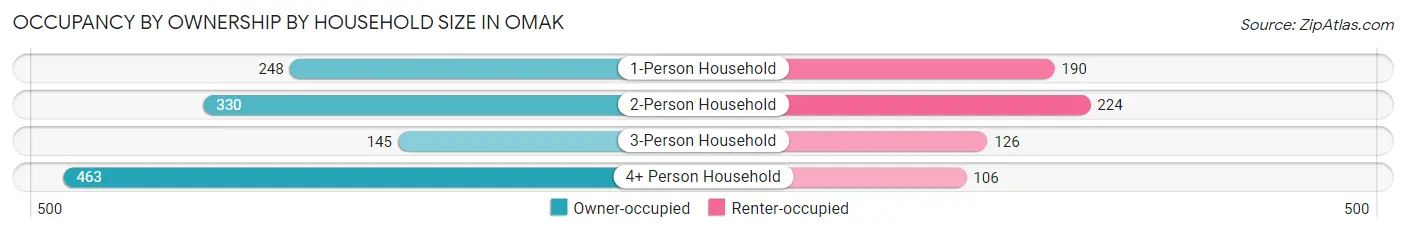
| Household Size | Owner-occupied | Renter-occupied |
| 1-Person Household | 248 (56.6%) | 190 (43.4%) |
| 2-Person Household | 330 (59.6%) | 224 (40.4%) |
| 3-Person Household | 145 (53.5%) | 126 (46.5%) |
| 4+ Person Household | 463 (81.4%) | 106 (18.6%) |
| Total Housing Units | 1,186 (64.7%) | 646 (35.3%) |
Occupancy by Educational Attainment in Omak
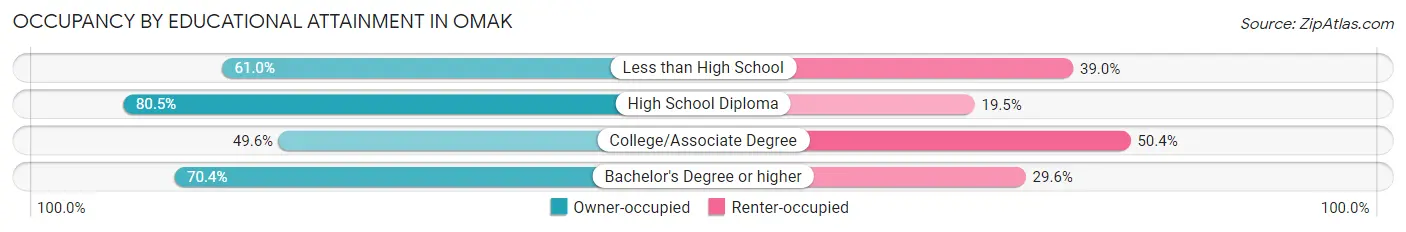
| Household Size | Owner-occupied | Renter-occupied |
| Less than High School | 114 (61.0%) | 73 (39.0%) |
| High School Diploma | 487 (80.5%) | 118 (19.5%) |
| College/Associate Degree | 350 (49.6%) | 356 (50.4%) |
| Bachelor's Degree or higher | 235 (70.4%) | 99 (29.6%) |
Occupancy by Age of Householder in Omak
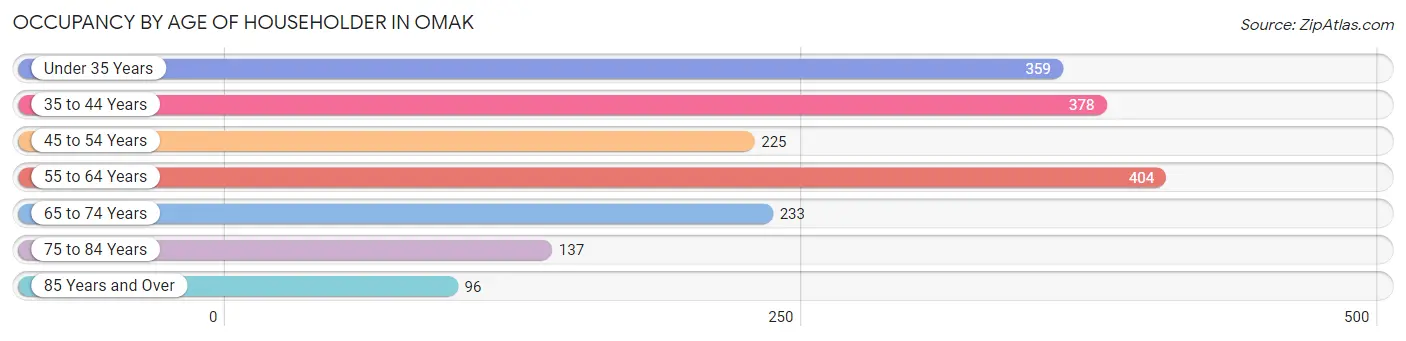
| Age Bracket | # Households | % Households |
| Under 35 Years | 359 | 19.6% |
| 35 to 44 Years | 378 | 20.6% |
| 45 to 54 Years | 225 | 12.3% |
| 55 to 64 Years | 404 | 22.1% |
| 65 to 74 Years | 233 | 12.7% |
| 75 to 84 Years | 137 | 7.5% |
| 85 Years and Over | 96 | 5.2% |
| Total | 1,832 | 100.0% |
Housing Finances in Omak
Median Income by Occupancy in Omak
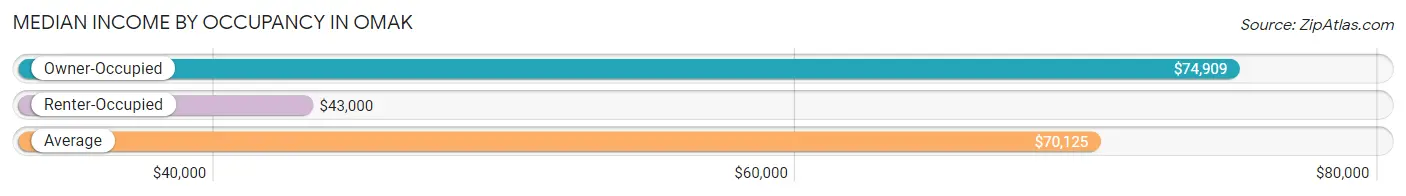
| Occupancy Type | # Households | Median Income |
| Owner-Occupied | 1,186 (64.7%) | $74,909 |
| Renter-Occupied | 646 (35.3%) | $43,000 |
| Average | 1,832 (100.0%) | $70,125 |
Occupancy by Householder Income Bracket in Omak
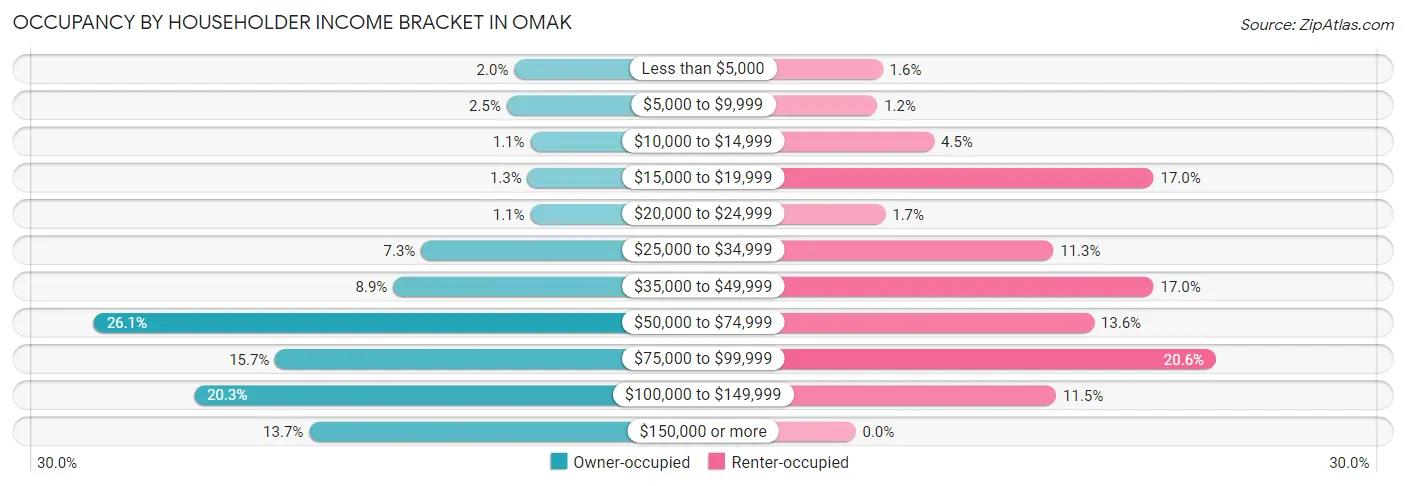
| Income Bracket | Owner-occupied | Renter-occupied |
| Less than $5,000 | 24 (2.0%) | 10 (1.5%) |
| $5,000 to $9,999 | 29 (2.5%) | 8 (1.2%) |
| $10,000 to $14,999 | 13 (1.1%) | 29 (4.5%) |
| $15,000 to $19,999 | 15 (1.3%) | 110 (17.0%) |
| $20,000 to $24,999 | 13 (1.1%) | 11 (1.7%) |
| $25,000 to $34,999 | 87 (7.3%) | 73 (11.3%) |
| $35,000 to $49,999 | 106 (8.9%) | 110 (17.0%) |
| $50,000 to $74,999 | 309 (26.1%) | 88 (13.6%) |
| $75,000 to $99,999 | 186 (15.7%) | 133 (20.6%) |
| $100,000 to $149,999 | 241 (20.3%) | 74 (11.5%) |
| $150,000 or more | 163 (13.7%) | 0 (0.0%) |
| Total | 1,186 (100.0%) | 646 (100.0%) |
Monthly Housing Cost Tiers in Omak
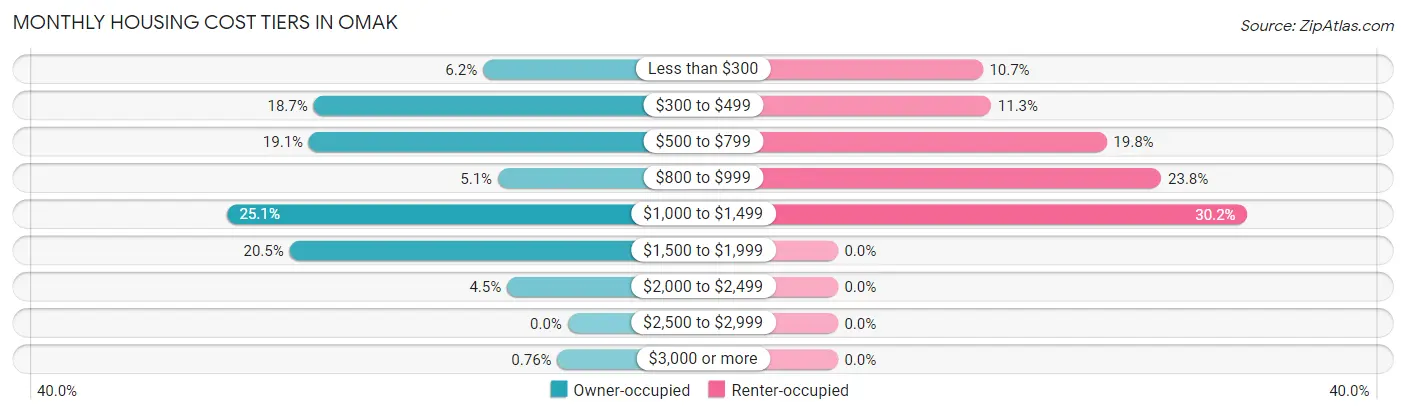
| Monthly Cost | Owner-occupied | Renter-occupied |
| Less than $300 | 74 (6.2%) | 69 (10.7%) |
| $300 to $499 | 222 (18.7%) | 73 (11.3%) |
| $500 to $799 | 226 (19.1%) | 128 (19.8%) |
| $800 to $999 | 61 (5.1%) | 154 (23.8%) |
| $1,000 to $1,499 | 298 (25.1%) | 195 (30.2%) |
| $1,500 to $1,999 | 243 (20.5%) | 0 (0.0%) |
| $2,000 to $2,499 | 53 (4.5%) | 0 (0.0%) |
| $2,500 to $2,999 | 0 (0.0%) | 0 (0.0%) |
| $3,000 or more | 9 (0.8%) | 0 (0.0%) |
| Total | 1,186 (100.0%) | 646 (100.0%) |
Physical Housing Characteristics in Omak
Housing Structures in Omak
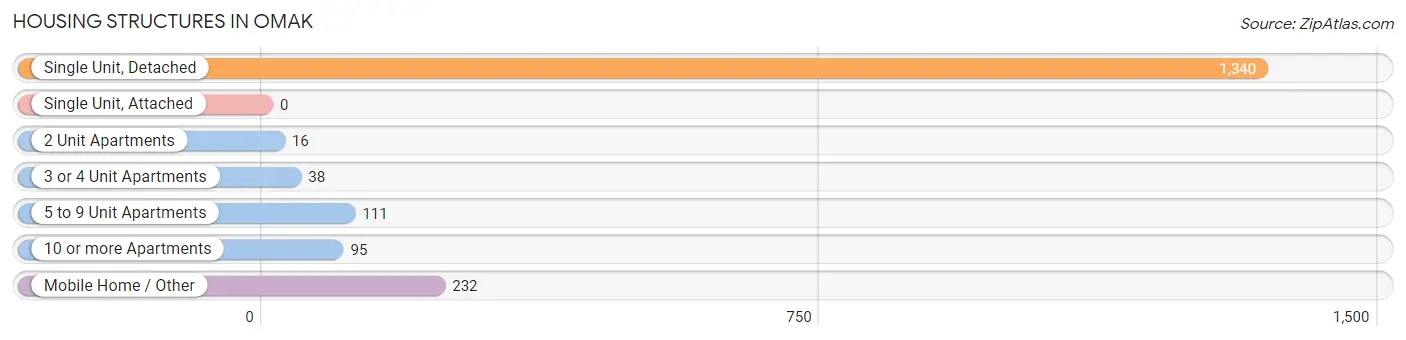
| Structure Type | # Housing Units | % Housing Units |
| Single Unit, Detached | 1,340 | 73.1% |
| Single Unit, Attached | 0 | 0.0% |
| 2 Unit Apartments | 16 | 0.9% |
| 3 or 4 Unit Apartments | 38 | 2.1% |
| 5 to 9 Unit Apartments | 111 | 6.1% |
| 10 or more Apartments | 95 | 5.2% |
| Mobile Home / Other | 232 | 12.7% |
| Total | 1,832 | 100.0% |
Housing Structures by Occupancy in Omak
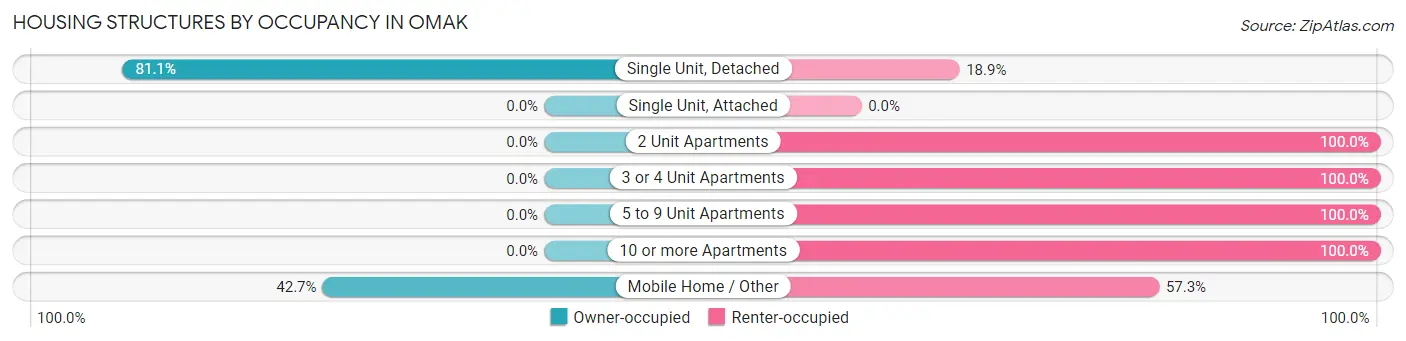
| Structure Type | Owner-occupied | Renter-occupied |
| Single Unit, Detached | 1,087 (81.1%) | 253 (18.9%) |
| Single Unit, Attached | 0 (0.0%) | 0 (0.0%) |
| 2 Unit Apartments | 0 (0.0%) | 16 (100.0%) |
| 3 or 4 Unit Apartments | 0 (0.0%) | 38 (100.0%) |
| 5 to 9 Unit Apartments | 0 (0.0%) | 111 (100.0%) |
| 10 or more Apartments | 0 (0.0%) | 95 (100.0%) |
| Mobile Home / Other | 99 (42.7%) | 133 (57.3%) |
| Total | 1,186 (64.7%) | 646 (35.3%) |
Housing Structures by Number of Rooms in Omak
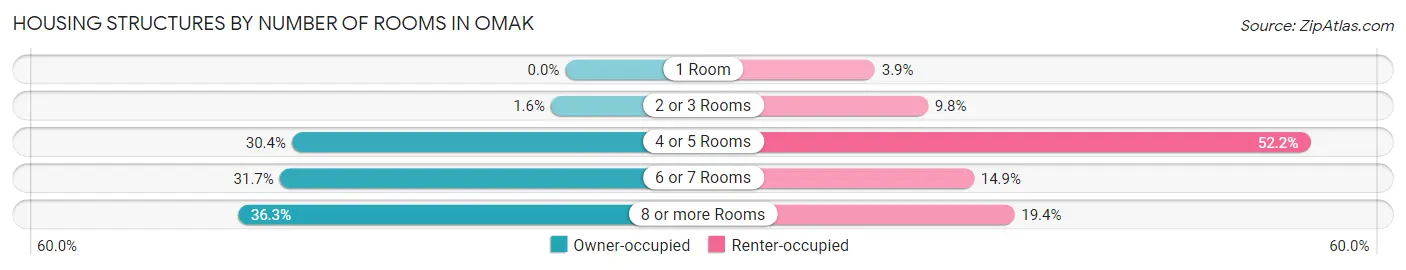
| Number of Rooms | Owner-occupied | Renter-occupied |
| 1 Room | 0 (0.0%) | 25 (3.9%) |
| 2 or 3 Rooms | 19 (1.6%) | 63 (9.8%) |
| 4 or 5 Rooms | 360 (30.3%) | 337 (52.2%) |
| 6 or 7 Rooms | 376 (31.7%) | 96 (14.9%) |
| 8 or more Rooms | 431 (36.3%) | 125 (19.4%) |
| Total | 1,186 (100.0%) | 646 (100.0%) |
Housing Structure by Heating Type in Omak
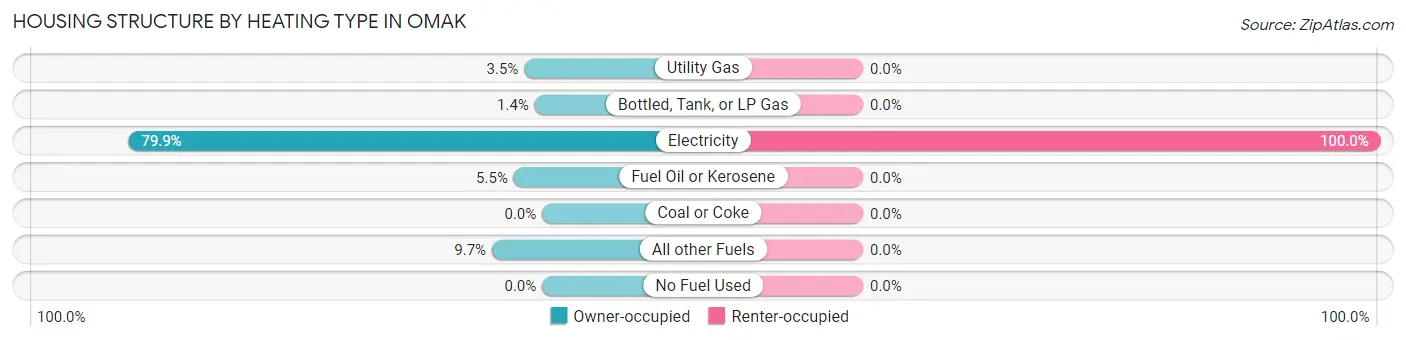
| Heating Type | Owner-occupied | Renter-occupied |
| Utility Gas | 41 (3.5%) | 0 (0.0%) |
| Bottled, Tank, or LP Gas | 17 (1.4%) | 0 (0.0%) |
| Electricity | 948 (79.9%) | 646 (100.0%) |
| Fuel Oil or Kerosene | 65 (5.5%) | 0 (0.0%) |
| Coal or Coke | 0 (0.0%) | 0 (0.0%) |
| All other Fuels | 115 (9.7%) | 0 (0.0%) |
| No Fuel Used | 0 (0.0%) | 0 (0.0%) |
| Total | 1,186 (100.0%) | 646 (100.0%) |
Household Vehicle Usage in Omak
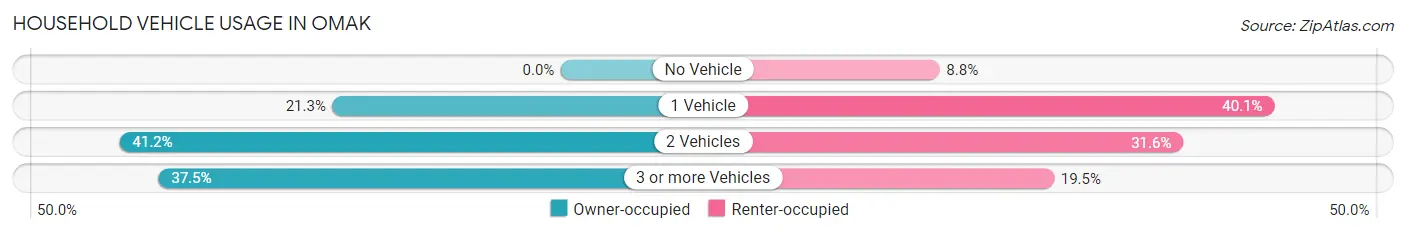
| Vehicles per Household | Owner-occupied | Renter-occupied |
| No Vehicle | 0 (0.0%) | 57 (8.8%) |
| 1 Vehicle | 253 (21.3%) | 259 (40.1%) |
| 2 Vehicles | 488 (41.1%) | 204 (31.6%) |
| 3 or more Vehicles | 445 (37.5%) | 126 (19.5%) |
| Total | 1,186 (100.0%) | 646 (100.0%) |
Real Estate & Mortgages in Omak
Real Estate and Mortgage Overview in Omak
| Characteristic | Without Mortgage | With Mortgage |
| Housing Units | 547 | 639 |
| Median Property Value | - | - |
| Median Household Income | $53,093 | $163 |
| Monthly Housing Costs | $484 | $9 |
| Real Estate Taxes | $1,112 | $0 |
Property Value by Mortgage Status in Omak
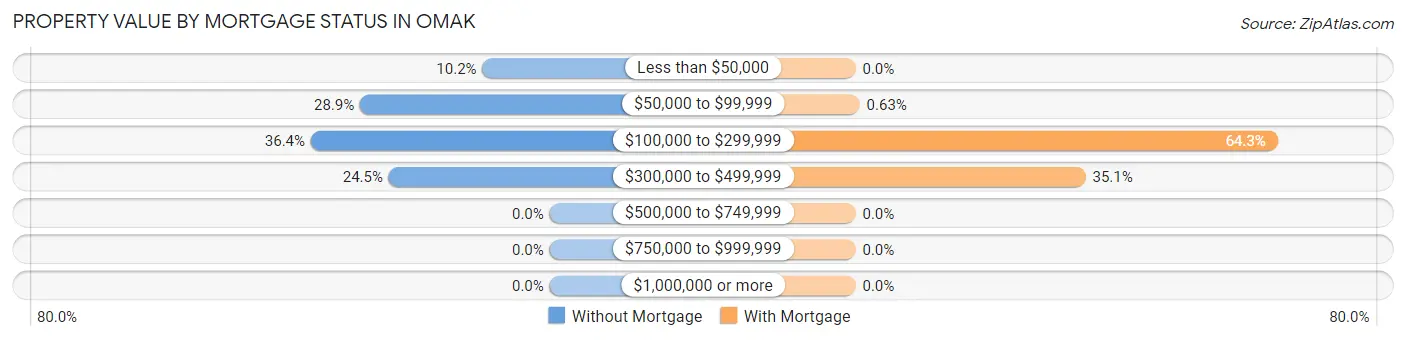
| Property Value | Without Mortgage | With Mortgage |
| Less than $50,000 | 56 (10.2%) | 0 (0.0%) |
| $50,000 to $99,999 | 158 (28.9%) | 4 (0.6%) |
| $100,000 to $299,999 | 199 (36.4%) | 411 (64.3%) |
| $300,000 to $499,999 | 134 (24.5%) | 224 (35.0%) |
| $500,000 to $749,999 | 0 (0.0%) | 0 (0.0%) |
| $750,000 to $999,999 | 0 (0.0%) | 0 (0.0%) |
| $1,000,000 or more | 0 (0.0%) | 0 (0.0%) |
| Total | 547 (100.0%) | 639 (100.0%) |
Household Income by Mortgage Status in Omak
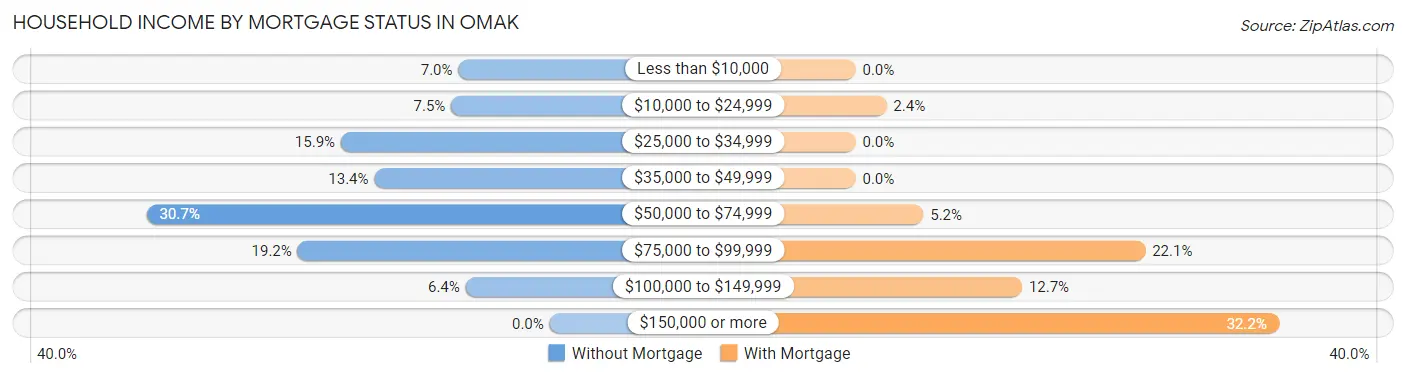
| Household Income | Without Mortgage | With Mortgage |
| Less than $10,000 | 38 (7.0%) | 0 (0.0%) |
| $10,000 to $24,999 | 41 (7.5%) | 15 (2.4%) |
| $25,000 to $34,999 | 87 (15.9%) | 0 (0.0%) |
| $35,000 to $49,999 | 73 (13.4%) | 0 (0.0%) |
| $50,000 to $74,999 | 168 (30.7%) | 33 (5.2%) |
| $75,000 to $99,999 | 105 (19.2%) | 141 (22.1%) |
| $100,000 to $149,999 | 35 (6.4%) | 81 (12.7%) |
| $150,000 or more | 0 (0.0%) | 206 (32.2%) |
| Total | 547 (100.0%) | 639 (100.0%) |
Property Value to Household Income Ratio in Omak
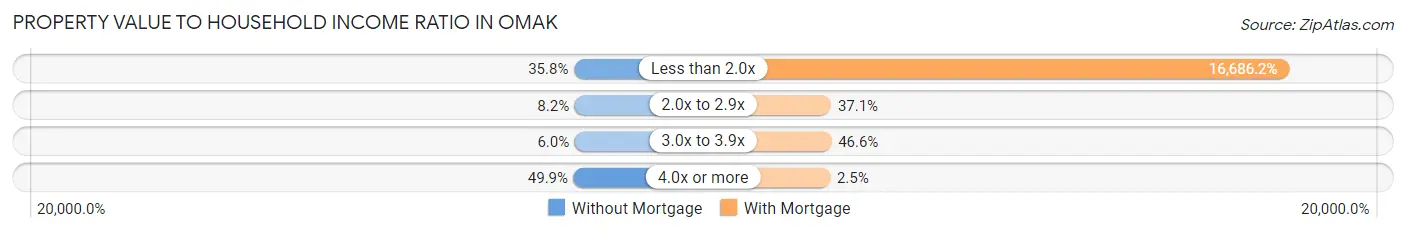
| Value-to-Income Ratio | Without Mortgage | With Mortgage |
| Less than 2.0x | 196 (35.8%) | 106,625 (16,686.2%) |
| 2.0x to 2.9x | 45 (8.2%) | 237 (37.1%) |
| 3.0x to 3.9x | 33 (6.0%) | 298 (46.6%) |
| 4.0x or more | 273 (49.9%) | 16 (2.5%) |
| Total | 547 (100.0%) | 639 (100.0%) |
Real Estate Taxes by Mortgage Status in Omak
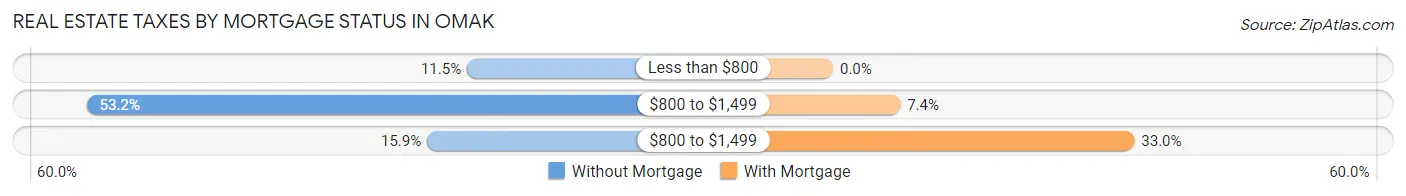
| Property Taxes | Without Mortgage | With Mortgage |
| Less than $800 | 63 (11.5%) | 0 (0.0%) |
| $800 to $1,499 | 291 (53.2%) | 47 (7.4%) |
| $800 to $1,499 | 87 (15.9%) | 211 (33.0%) |
| Total | 547 (100.0%) | 639 (100.0%) |
Health & Disability in Omak
Health Insurance Coverage by Age in Omak
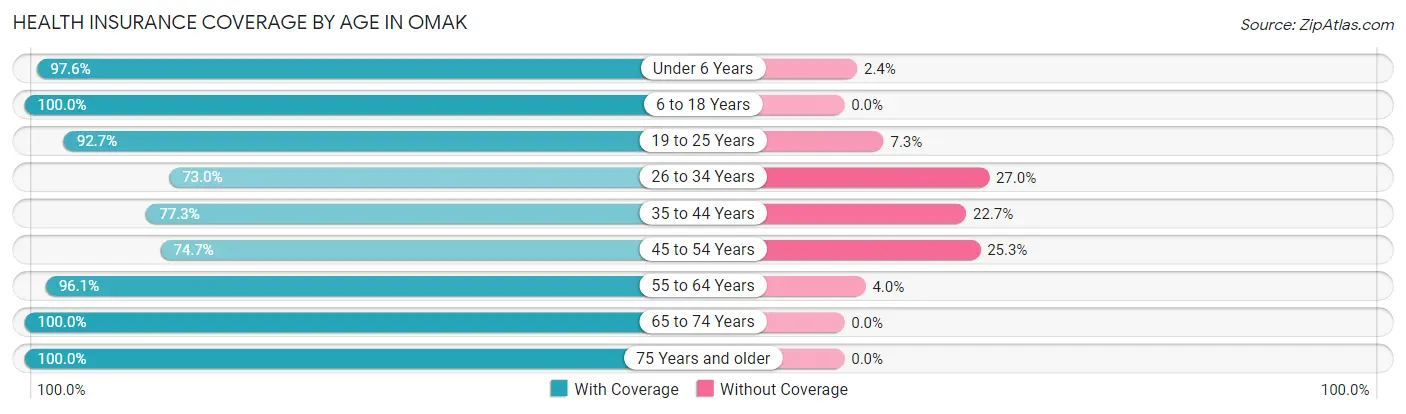
| Age Bracket | With Coverage | Without Coverage |
| Under 6 Years | 533 (97.6%) | 13 (2.4%) |
| 6 to 18 Years | 901 (100.0%) | 0 (0.0%) |
| 19 to 25 Years | 266 (92.7%) | 21 (7.3%) |
| 26 to 34 Years | 368 (73.0%) | 136 (27.0%) |
| 35 to 44 Years | 667 (77.3%) | 196 (22.7%) |
| 45 to 54 Years | 271 (74.7%) | 92 (25.3%) |
| 55 to 64 Years | 583 (96.1%) | 24 (4.0%) |
| 65 to 74 Years | 343 (100.0%) | 0 (0.0%) |
| 75 Years and older | 387 (100.0%) | 0 (0.0%) |
| Total | 4,319 (90.0%) | 482 (10.0%) |
Health Insurance Coverage by Citizenship Status in Omak
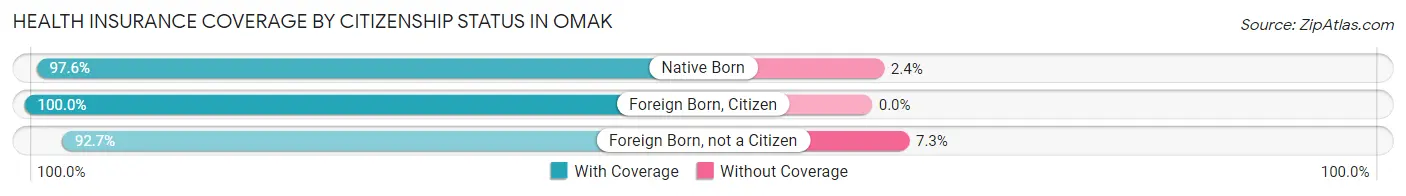
| Citizenship Status | With Coverage | Without Coverage |
| Native Born | 533 (97.6%) | 13 (2.4%) |
| Foreign Born, Citizen | 901 (100.0%) | 0 (0.0%) |
| Foreign Born, not a Citizen | 266 (92.7%) | 21 (7.3%) |
Health Insurance Coverage by Household Income in Omak
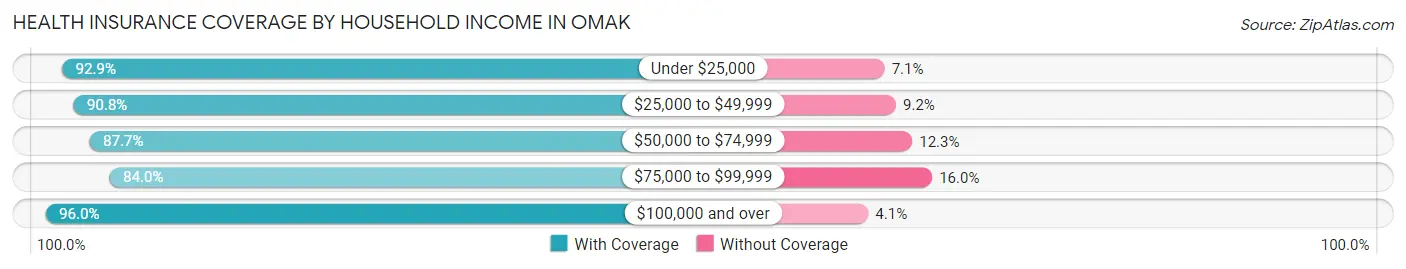
| Household Income | With Coverage | Without Coverage |
| Under $25,000 | 431 (92.9%) | 33 (7.1%) |
| $25,000 to $49,999 | 855 (90.8%) | 87 (9.2%) |
| $50,000 to $74,999 | 729 (87.7%) | 102 (12.3%) |
| $75,000 to $99,999 | 871 (84.0%) | 166 (16.0%) |
| $100,000 and over | 1,421 (96.0%) | 60 (4.1%) |
Public vs Private Health Insurance Coverage by Age in Omak
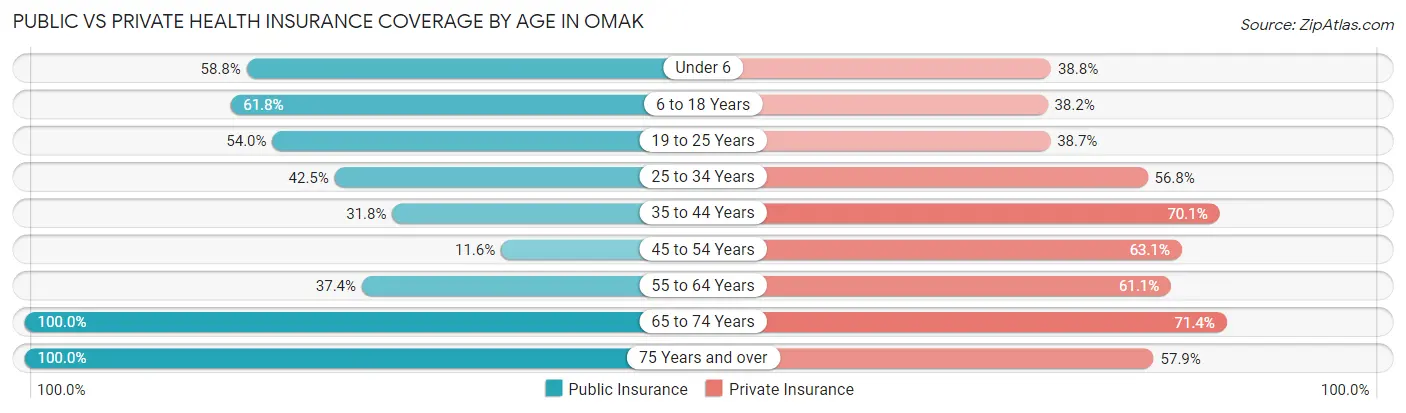
| Age Bracket | Public Insurance | Private Insurance |
| Under 6 | 321 (58.8%) | 212 (38.8%) |
| 6 to 18 Years | 557 (61.8%) | 344 (38.2%) |
| 19 to 25 Years | 155 (54.0%) | 111 (38.7%) |
| 25 to 34 Years | 214 (42.5%) | 286 (56.8%) |
| 35 to 44 Years | 274 (31.8%) | 605 (70.1%) |
| 45 to 54 Years | 42 (11.6%) | 229 (63.1%) |
| 55 to 64 Years | 227 (37.4%) | 371 (61.1%) |
| 65 to 74 Years | 343 (100.0%) | 245 (71.4%) |
| 75 Years and over | 387 (100.0%) | 224 (57.9%) |
| Total | 2,520 (52.5%) | 2,627 (54.7%) |
Disability Status by Sex by Age in Omak
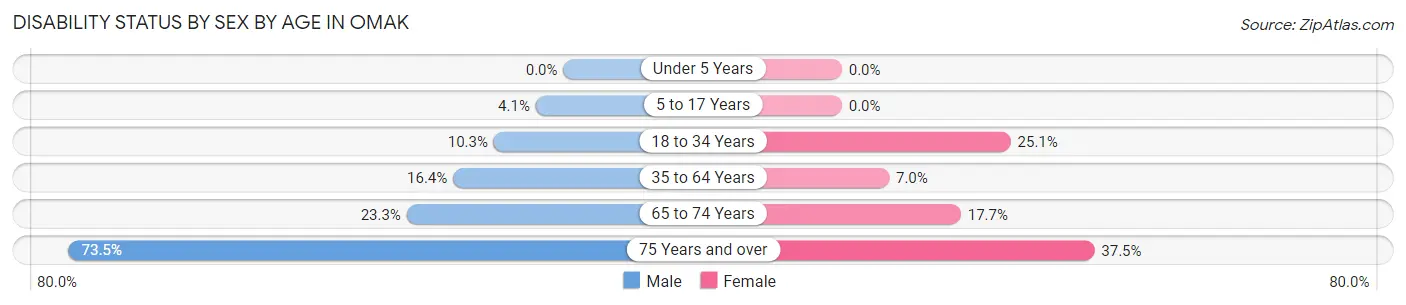
| Age Bracket | Male | Female |
| Under 5 Years | 0 (0.0%) | 0 (0.0%) |
| 5 to 17 Years | 20 (4.1%) | 0 (0.0%) |
| 18 to 34 Years | 47 (10.3%) | 92 (25.1%) |
| 35 to 64 Years | 139 (16.4%) | 69 (7.0%) |
| 65 to 74 Years | 10 (23.3%) | 53 (17.7%) |
| 75 Years and over | 155 (73.5%) | 66 (37.5%) |
Disability Class by Sex by Age in Omak
Disability Class: Hearing Difficulty
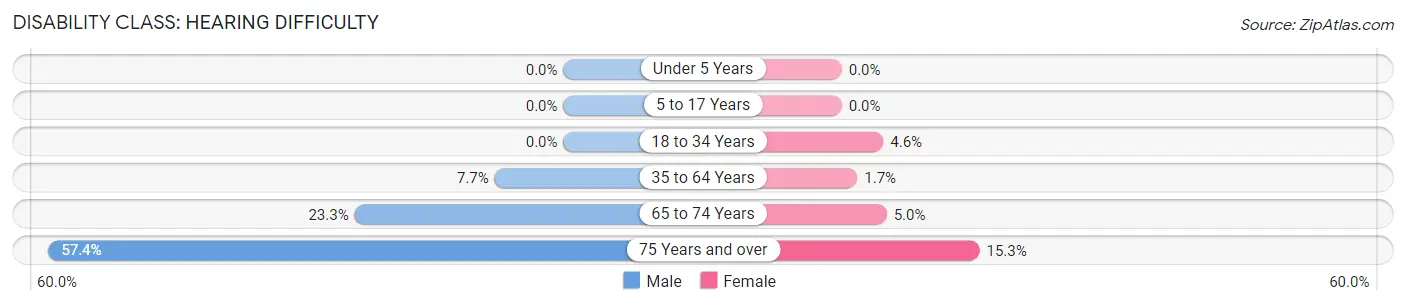
| Age Bracket | Male | Female |
| Under 5 Years | 0 (0.0%) | 0 (0.0%) |
| 5 to 17 Years | 0 (0.0%) | 0 (0.0%) |
| 18 to 34 Years | 0 (0.0%) | 17 (4.6%) |
| 35 to 64 Years | 65 (7.7%) | 17 (1.7%) |
| 65 to 74 Years | 10 (23.3%) | 15 (5.0%) |
| 75 Years and over | 121 (57.4%) | 27 (15.3%) |
Disability Class: Vision Difficulty
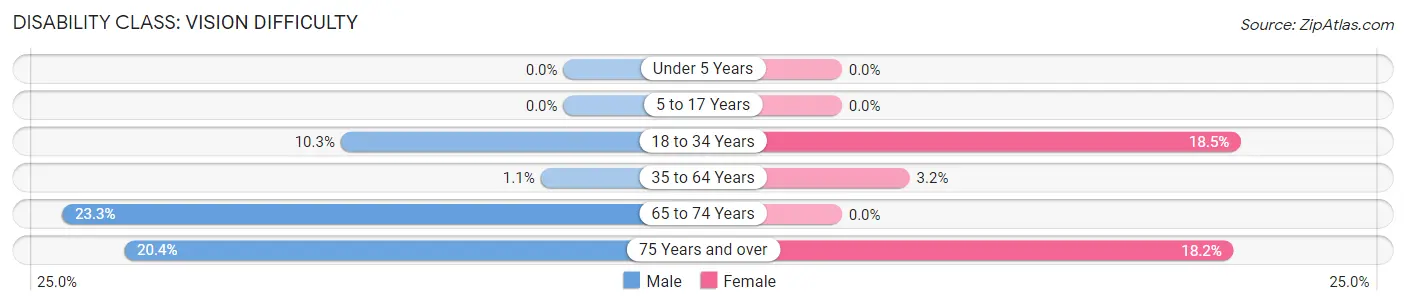
| Age Bracket | Male | Female |
| Under 5 Years | 0 (0.0%) | 0 (0.0%) |
| 5 to 17 Years | 0 (0.0%) | 0 (0.0%) |
| 18 to 34 Years | 47 (10.3%) | 68 (18.5%) |
| 35 to 64 Years | 9 (1.1%) | 31 (3.2%) |
| 65 to 74 Years | 10 (23.3%) | 0 (0.0%) |
| 75 Years and over | 43 (20.4%) | 32 (18.2%) |
Disability Class: Cognitive Difficulty
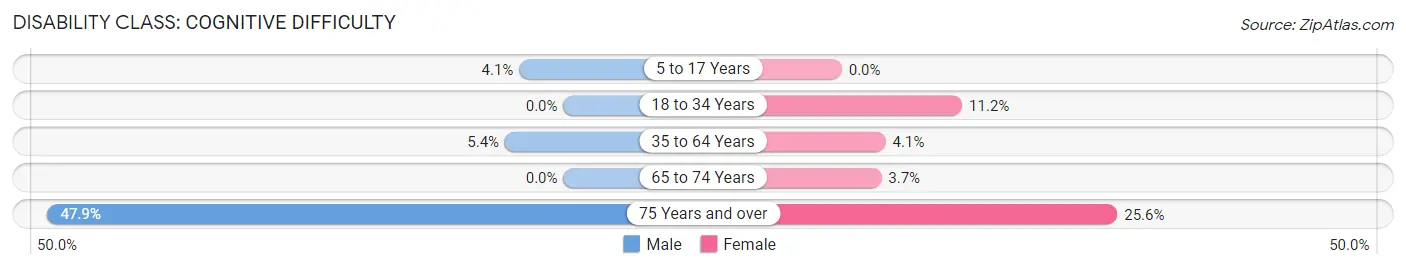
| Age Bracket | Male | Female |
| 5 to 17 Years | 20 (4.1%) | 0 (0.0%) |
| 18 to 34 Years | 0 (0.0%) | 41 (11.2%) |
| 35 to 64 Years | 46 (5.4%) | 40 (4.1%) |
| 65 to 74 Years | 0 (0.0%) | 11 (3.7%) |
| 75 Years and over | 101 (47.9%) | 45 (25.6%) |
Disability Class: Ambulatory Difficulty
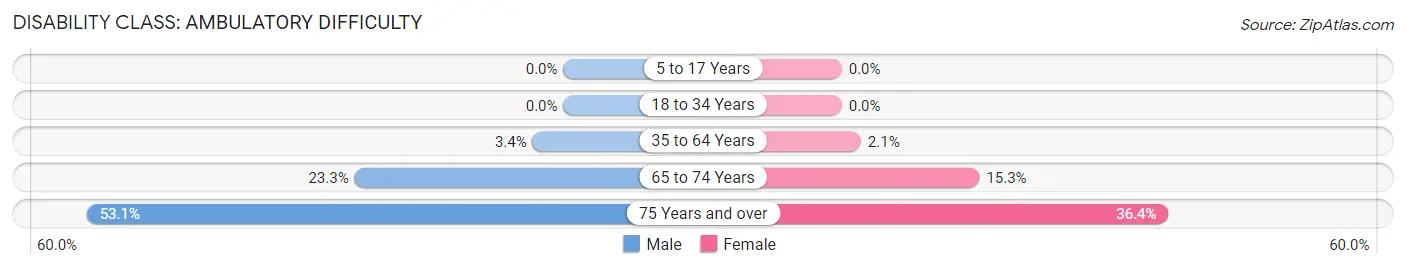
| Age Bracket | Male | Female |
| 5 to 17 Years | 0 (0.0%) | 0 (0.0%) |
| 18 to 34 Years | 0 (0.0%) | 0 (0.0%) |
| 35 to 64 Years | 29 (3.4%) | 21 (2.1%) |
| 65 to 74 Years | 10 (23.3%) | 46 (15.3%) |
| 75 Years and over | 112 (53.1%) | 64 (36.4%) |
Disability Class: Self-Care Difficulty
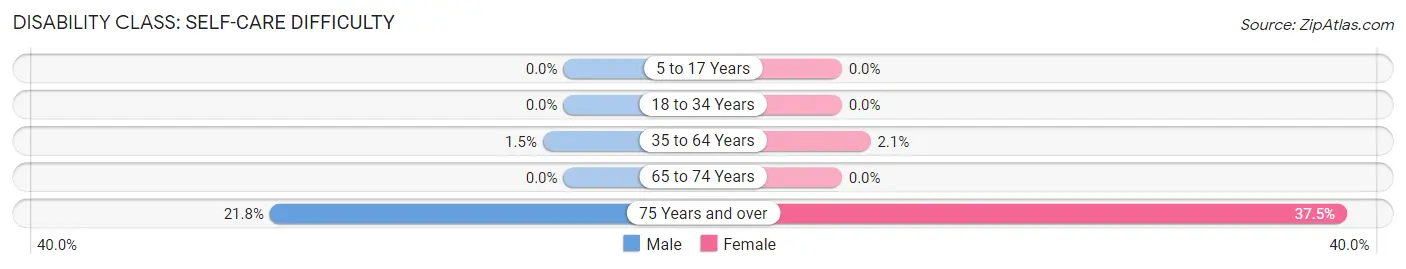
| Age Bracket | Male | Female |
| 5 to 17 Years | 0 (0.0%) | 0 (0.0%) |
| 18 to 34 Years | 0 (0.0%) | 0 (0.0%) |
| 35 to 64 Years | 13 (1.5%) | 21 (2.1%) |
| 65 to 74 Years | 0 (0.0%) | 0 (0.0%) |
| 75 Years and over | 46 (21.8%) | 66 (37.5%) |
Technology Access in Omak
Computing Device Access in Omak
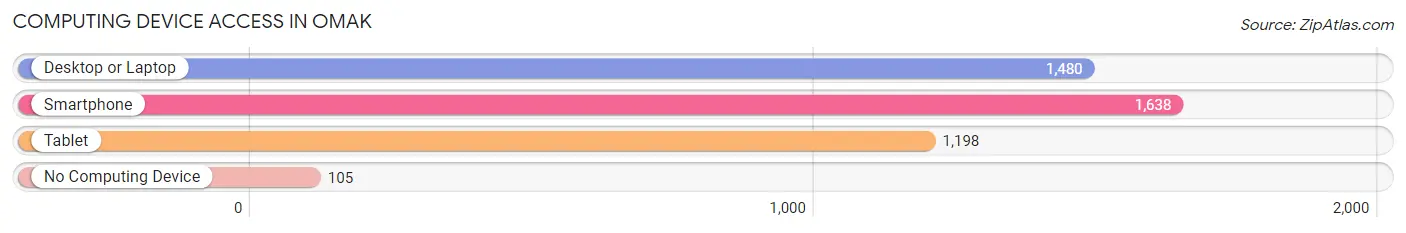
| Device Type | # Households | % Households |
| Desktop or Laptop | 1,480 | 80.8% |
| Smartphone | 1,638 | 89.4% |
| Tablet | 1,198 | 65.4% |
| No Computing Device | 105 | 5.7% |
| Total | 1,832 | 100.0% |
Internet Access in Omak
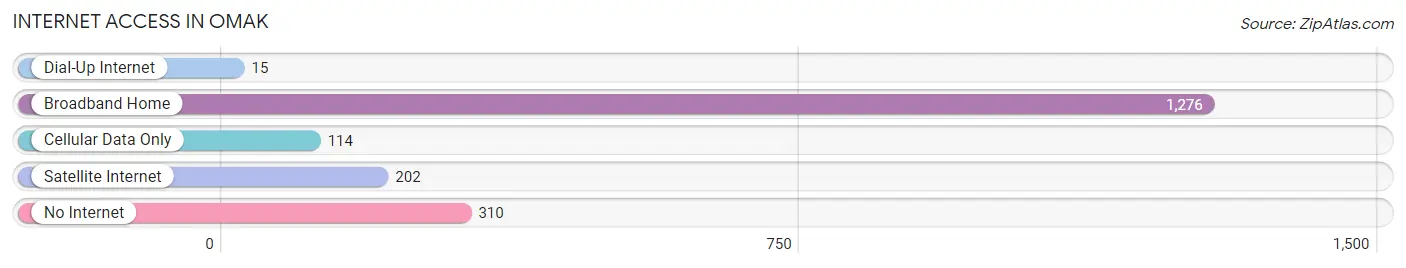
| Internet Type | # Households | % Households |
| Dial-Up Internet | 15 | 0.8% |
| Broadband Home | 1,276 | 69.7% |
| Cellular Data Only | 114 | 6.2% |
| Satellite Internet | 202 | 11.0% |
| No Internet | 310 | 16.9% |
| Total | 1,832 | 100.0% |
Omak Summary
Omak is a city located in the Okanogan County of Washington State. It is situated at the confluence of the Okanogan and Columbia Rivers, and is the largest city in the county. The city has a population of 4,844 as of the 2010 census.
Geography
Omak is located in the Okanogan Valley, which is part of the Okanogan Highlands. The city is situated at the confluence of the Okanogan and Columbia Rivers, and is surrounded by the Okanogan National Forest. The city is located at an elevation of 1,068 feet (325 m). The climate in Omak is semi-arid, with hot summers and cold winters. The average annual precipitation is 8.5 inches (216 mm).
History
The area around Omak has been inhabited by Native American tribes for thousands of years. The first European settlers arrived in the area in the late 1800s, and the city was officially incorporated in 1911. The city was named after the Okanogan tribe, which had a village in the area.
The economy of Omak was initially based on agriculture, with wheat, apples, and other crops being grown in the area. In the early 1900s, the city became a center for logging and sawmills. The city also became a center for mining, with copper, gold, and silver being mined in the area.
In the 1950s, the city began to diversify its economy, with the establishment of a paper mill and a plywood mill. The city also became a center for tourism, with the establishment of several resorts and recreational areas.
Demographics
As of the 2010 census, the population of Omak was 4,844. The racial makeup of the city was 79.2% White, 0.7% African American, 1.3% Native American, 0.7% Asian, 0.1% Pacific Islander, 15.2% from other races, and 3.0% from two or more races. Hispanic or Latino of any race were 24.2% of the population.
The median income for a household in the city was $30,938, and the median income for a family was $35,938. The per capita income for the city was $15,938. About 17.2% of families and 21.2% of the population were below the poverty line, including 28.2% of those under age 18 and 11.2% of those age 65 or over.
Economy
The economy of Omak is largely based on agriculture, with wheat, apples, and other crops being grown in the area. The city is also a center for logging and sawmills, and is home to several paper mills and plywood mills. The city is also a center for tourism, with several resorts and recreational areas in the area. The city is also home to several manufacturing companies, including a furniture manufacturer and a metal fabrication company.
Common Questions
What is Per Capita Income in Omak?
Per Capita income in Omak is $29,756.
What is the Median Family Income in Omak?
Median Family Income in Omak is $75,357.
What is the Median Household income in Omak?
Median Household Income in Omak is $70,125.
What is Income or Wage Gap in Omak?
Income or Wage Gap in Omak is 11.5%.
Women in Omak earn 88.5 cents for every dollar earned by a man.
What is Inequality or Gini Index in Omak?
Inequality or Gini Index in Omak is 0.39.
What is the Total Population of Omak?
Total Population of Omak is 4,877.
What is the Total Male Population of Omak?
Total Male Population of Omak is 2,133.
What is the Total Female Population of Omak?
Total Female Population of Omak is 2,744.
What is the Ratio of Males per 100 Females in Omak?
There are 77.73 Males per 100 Females in Omak.
What is the Ratio of Females per 100 Males in Omak?
There are 128.65 Females per 100 Males in Omak.
What is the Median Population Age in Omak?
Median Population Age in Omak is 36.9 Years.
What is the Average Family Size in Omak
Average Family Size in Omak is 2.9 People.
What is the Average Household Size in Omak
Average Household Size in Omak is 2.6 People.
How Large is the Labor Force in Omak?
There are 2,202 People in the Labor Forcein in Omak.
What is the Percentage of People in the Labor Force in Omak?
62.3% of People are in the Labor Force in Omak.
What is the Unemployment Rate in Omak?
Unemployment Rate in Omak is 4.9%.