Zip Codes with the Highest Percentage of Population Employed in Health Diagnosing & Treating in Seattle, WA
RELATED REPORTS & OPTIONS
Health Diagnosing & Treating
Seattle
Compare Zip Codes
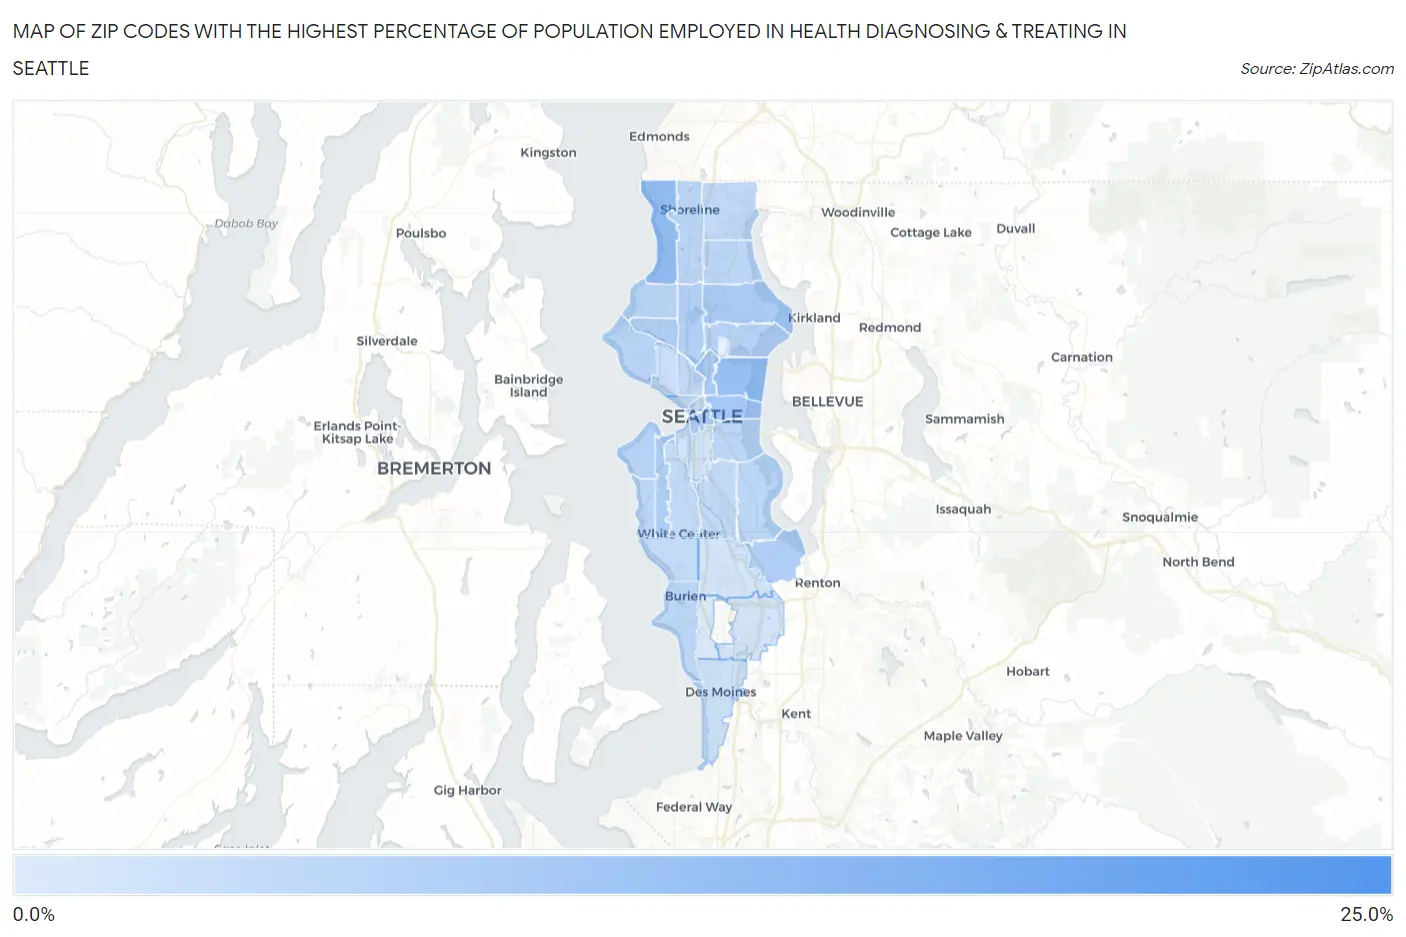
Map of Zip Codes with the Highest Percentage of Population Employed in Health Diagnosing & Treating in Seattle
1.6%
21.8%
Zip Codes with the Highest Percentage of Population Employed in Health Diagnosing & Treating in Seattle, WA
| Zip Code | % Employed | vs State | vs National | |
| 1. | 98164 | 21.8% | 5.6%(+16.3)#8 | 6.2%(+15.6)#441 |
| 2. | 98177 | 11.0% | 5.6%(+5.41)#34 | 6.2%(+4.72)#2,914 |
| 3. | 98112 | 10.3% | 5.6%(+4.79)#41 | 6.2%(+4.10)#3,482 |
| 4. | 98122 | 8.6% | 5.6%(+3.05)#54 | 6.2%(+2.36)#6,142 |
| 5. | 98115 | 8.2% | 5.6%(+2.60)#67 | 6.2%(+1.91)#7,123 |
| 6. | 98102 | 8.1% | 5.6%(+2.58)#69 | 6.2%(+1.89)#7,168 |
| 7. | 98104 | 7.6% | 5.6%(+2.04)#89 | 6.2%(+1.35)#8,542 |
| 8. | 98126 | 7.4% | 5.6%(+1.80)#99 | 6.2%(+1.11)#9,261 |
| 9. | 98178 | 7.1% | 5.6%(+1.58)#110 | 6.2%(+0.889)#9,934 |
| 10. | 98107 | 7.1% | 5.6%(+1.52)#113 | 6.2%(+0.826)#10,129 |
| 11. | 98103 | 6.9% | 5.6%(+1.34)#122 | 6.2%(+0.647)#10,708 |
| 12. | 98116 | 6.3% | 5.6%(+0.778)#153 | 6.2%(+0.088)#12,648 |
| 13. | 98105 | 6.1% | 5.6%(+0.561)#168 | 6.2%(-0.130)#13,477 |
| 14. | 98117 | 6.0% | 5.6%(+0.493)#173 | 6.2%(-0.198)#13,691 |
| 15. | 98199 | 5.9% | 5.6%(+0.374)#181 | 6.2%(-0.317)#14,120 |
| 16. | 98125 | 5.8% | 5.6%(+0.248)#191 | 6.2%(-0.443)#14,603 |
| 17. | 98144 | 5.7% | 5.6%(+0.143)#201 | 6.2%(-0.548)#15,005 |
| 18. | 98136 | 5.7% | 5.6%(+0.141)#202 | 6.2%(-0.550)#15,012 |
| 19. | 98133 | 5.6% | 5.6%(+0.010)#215 | 6.2%(-0.681)#15,529 |
| 20. | 98118 | 5.5% | 5.6%(-0.018)#219 | 6.2%(-0.709)#15,656 |
| 21. | 98166 | 5.3% | 5.6%(-0.302)#243 | 6.2%(-0.993)#16,747 |
| 22. | 98155 | 5.2% | 5.6%(-0.390)#250 | 6.2%(-1.08)#17,062 |
| 23. | 98109 | 5.0% | 5.6%(-0.591)#273 | 6.2%(-1.28)#17,858 |
| 24. | 98108 | 4.9% | 5.6%(-0.630)#280 | 6.2%(-1.32)#18,001 |
| 25. | 98106 | 4.8% | 5.6%(-0.723)#288 | 6.2%(-1.41)#18,372 |
| 26. | 98101 | 4.7% | 5.6%(-0.841)#294 | 6.2%(-1.53)#18,808 |
| 27. | 98146 | 4.6% | 5.6%(-0.933)#300 | 6.2%(-1.62)#19,169 |
| 28. | 98121 | 4.6% | 5.6%(-0.933)#301 | 6.2%(-1.62)#19,171 |
| 29. | 98119 | 4.1% | 5.6%(-1.50)#332 | 6.2%(-2.19)#21,188 |
| 30. | 98198 | 3.3% | 5.6%(-2.27)#381 | 6.2%(-2.96)#23,516 |
| 31. | 98134 | 3.0% | 5.6%(-2.57)#395 | 6.2%(-3.26)#24,366 |
| 32. | 98188 | 2.9% | 5.6%(-2.69)#402 | 6.2%(-3.38)#24,673 |
| 33. | 98168 | 2.7% | 5.6%(-2.82)#407 | 6.2%(-3.51)#24,969 |
| 34. | 98148 | 1.6% | 5.6%(-3.93)#452 | 6.2%(-4.62)#27,053 |
1
Common Questions
What are the Top 10 Zip Codes with the Highest Percentage of Population Employed in Health Diagnosing & Treating in Seattle, WA?
Top 10 Zip Codes with the Highest Percentage of Population Employed in Health Diagnosing & Treating in Seattle, WA are:
What zip code has the Highest Percentage of Population Employed in Health Diagnosing & Treating in Seattle, WA?
98164 has the Highest Percentage of Population Employed in Health Diagnosing & Treating in Seattle, WA with 21.8%.
What is the Percentage of Population Employed in Health Diagnosing & Treating in Seattle, WA?
Percentage of Population Employed in Health Diagnosing & Treating in Seattle is 6.4%.
What is the Percentage of Population Employed in Health Diagnosing & Treating in Washington?
Percentage of Population Employed in Health Diagnosing & Treating in Washington is 5.6%.
What is the Percentage of Population Employed in Health Diagnosing & Treating in the United States?
Percentage of Population Employed in Health Diagnosing & Treating in the United States is 6.2%.