Zip Codes with the Highest Percentage of Population Employed in Health Diagnosing & Treating in Woodinville, WA
RELATED REPORTS & OPTIONS
Health Diagnosing & Treating
Woodinville
Compare Zip Codes
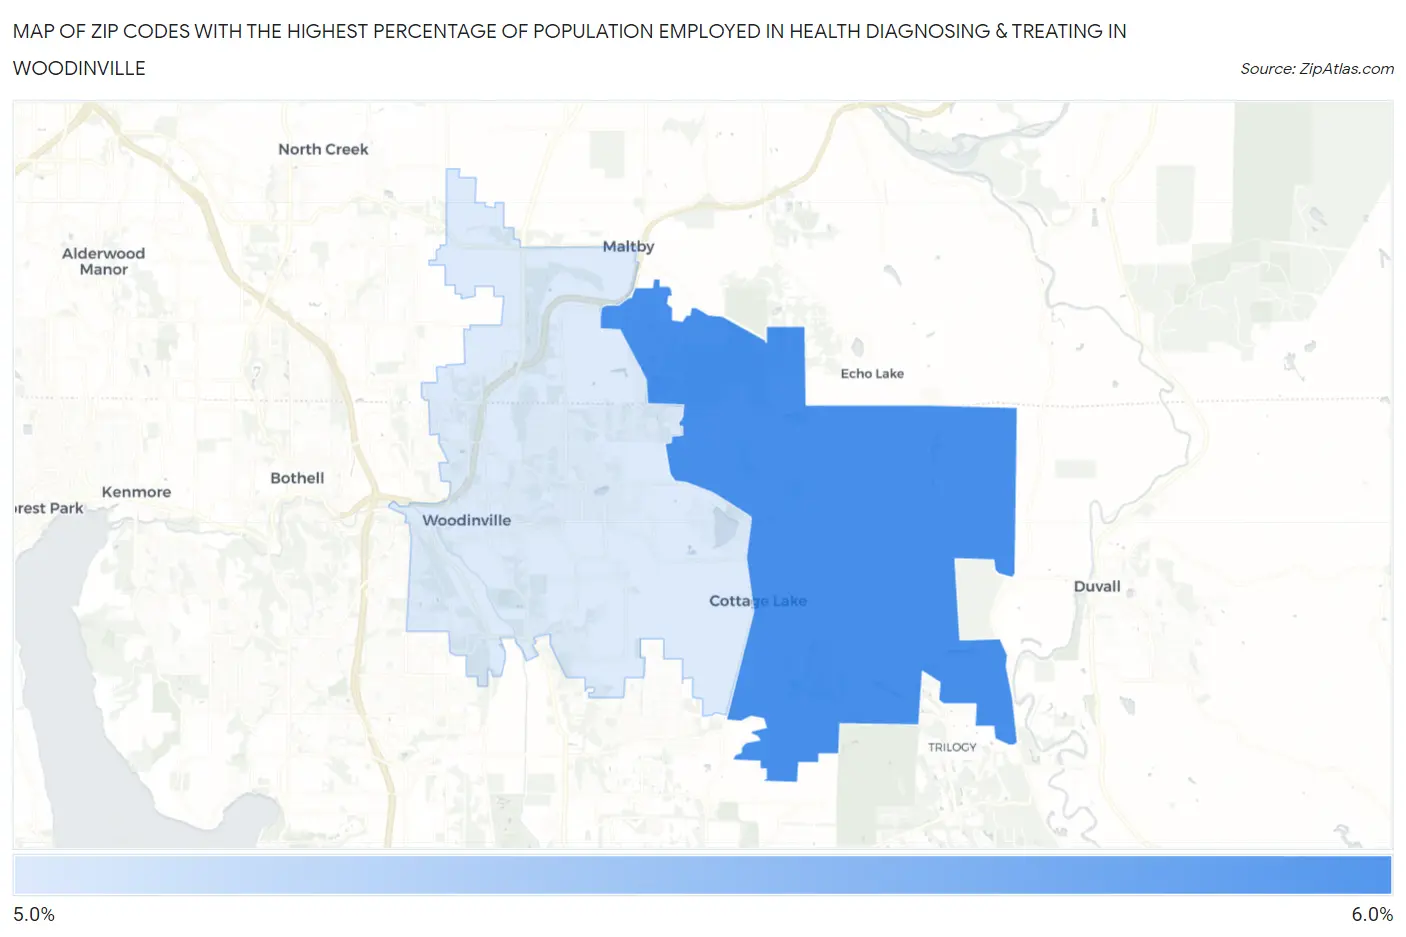
Map of Zip Codes with the Highest Percentage of Population Employed in Health Diagnosing & Treating in Woodinville
5.1%
5.7%
Zip Codes with the Highest Percentage of Population Employed in Health Diagnosing & Treating in Woodinville, WA
| Zip Code | % Employed | vs State | vs National | |
| 1. | 98077 | 5.7% | 5.6%(+0.151)#198 | 6.2%(-0.540)#14,974 |
| 2. | 98072 | 5.1% | 5.6%(-0.489)#259 | 6.2%(-1.18)#17,442 |
1
Common Questions
What are the Top Zip Codes with the Highest Percentage of Population Employed in Health Diagnosing & Treating in Woodinville, WA?
Top Zip Codes with the Highest Percentage of Population Employed in Health Diagnosing & Treating in Woodinville, WA are:
What zip code has the Highest Percentage of Population Employed in Health Diagnosing & Treating in Woodinville, WA?
98077 has the Highest Percentage of Population Employed in Health Diagnosing & Treating in Woodinville, WA with 5.7%.
What is the Percentage of Population Employed in Health Diagnosing & Treating in Woodinville, WA?
Percentage of Population Employed in Health Diagnosing & Treating in Woodinville is 6.1%.
What is the Percentage of Population Employed in Health Diagnosing & Treating in Washington?
Percentage of Population Employed in Health Diagnosing & Treating in Washington is 5.6%.
What is the Percentage of Population Employed in Health Diagnosing & Treating in the United States?
Percentage of Population Employed in Health Diagnosing & Treating in the United States is 6.2%.