Zip Codes with the Highest Percentage of Population Employed in Health Diagnosing & Treating in Snohomish, WA
RELATED REPORTS & OPTIONS
Health Diagnosing & Treating
Snohomish
Compare Zip Codes
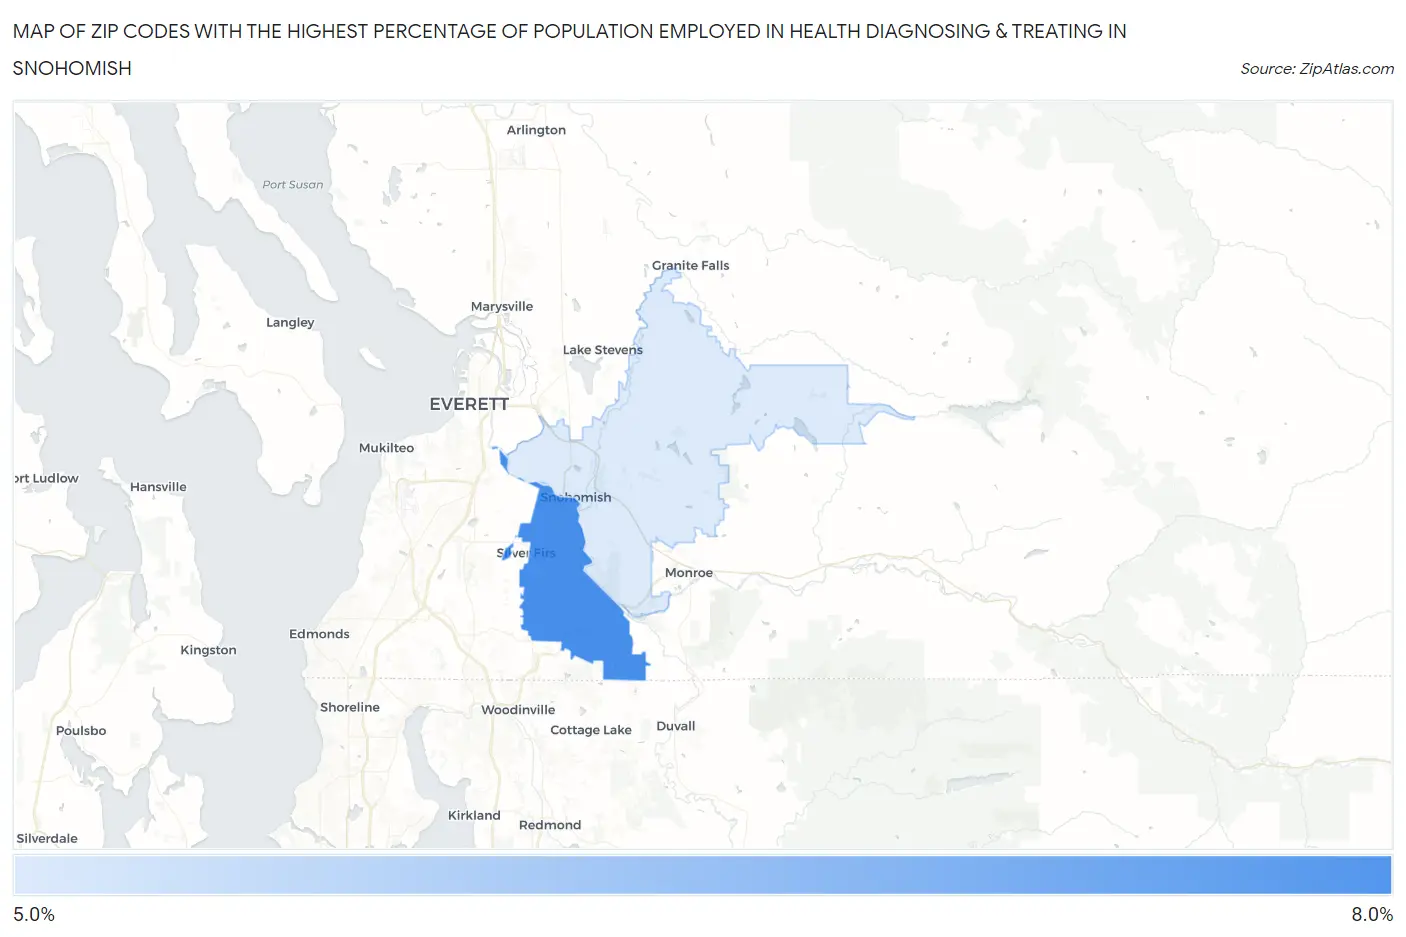
Map of Zip Codes with the Highest Percentage of Population Employed in Health Diagnosing & Treating in Snohomish
5.3%
7.3%
Zip Codes with the Highest Percentage of Population Employed in Health Diagnosing & Treating in Snohomish, WA
| Zip Code | % Employed | vs State | vs National | |
| 1. | 98296 | 7.3% | 5.6%(+1.76)#102 | 6.2%(+1.07)#9,388 |
| 2. | 98290 | 5.3% | 5.6%(-0.288)#240 | 6.2%(-0.979)#16,680 |
1
Common Questions
What are the Top Zip Codes with the Highest Percentage of Population Employed in Health Diagnosing & Treating in Snohomish, WA?
Top Zip Codes with the Highest Percentage of Population Employed in Health Diagnosing & Treating in Snohomish, WA are:
What zip code has the Highest Percentage of Population Employed in Health Diagnosing & Treating in Snohomish, WA?
98296 has the Highest Percentage of Population Employed in Health Diagnosing & Treating in Snohomish, WA with 7.3%.
What is the Percentage of Population Employed in Health Diagnosing & Treating in Snohomish, WA?
Percentage of Population Employed in Health Diagnosing & Treating in Snohomish is 4.8%.
What is the Percentage of Population Employed in Health Diagnosing & Treating in Washington?
Percentage of Population Employed in Health Diagnosing & Treating in Washington is 5.6%.
What is the Percentage of Population Employed in Health Diagnosing & Treating in the United States?
Percentage of Population Employed in Health Diagnosing & Treating in the United States is 6.2%.