Zip Codes with the Highest Percentage of Population Employed in Health Diagnosing & Treating in Marysville, WA
RELATED REPORTS & OPTIONS
Health Diagnosing & Treating
Marysville
Compare Zip Codes
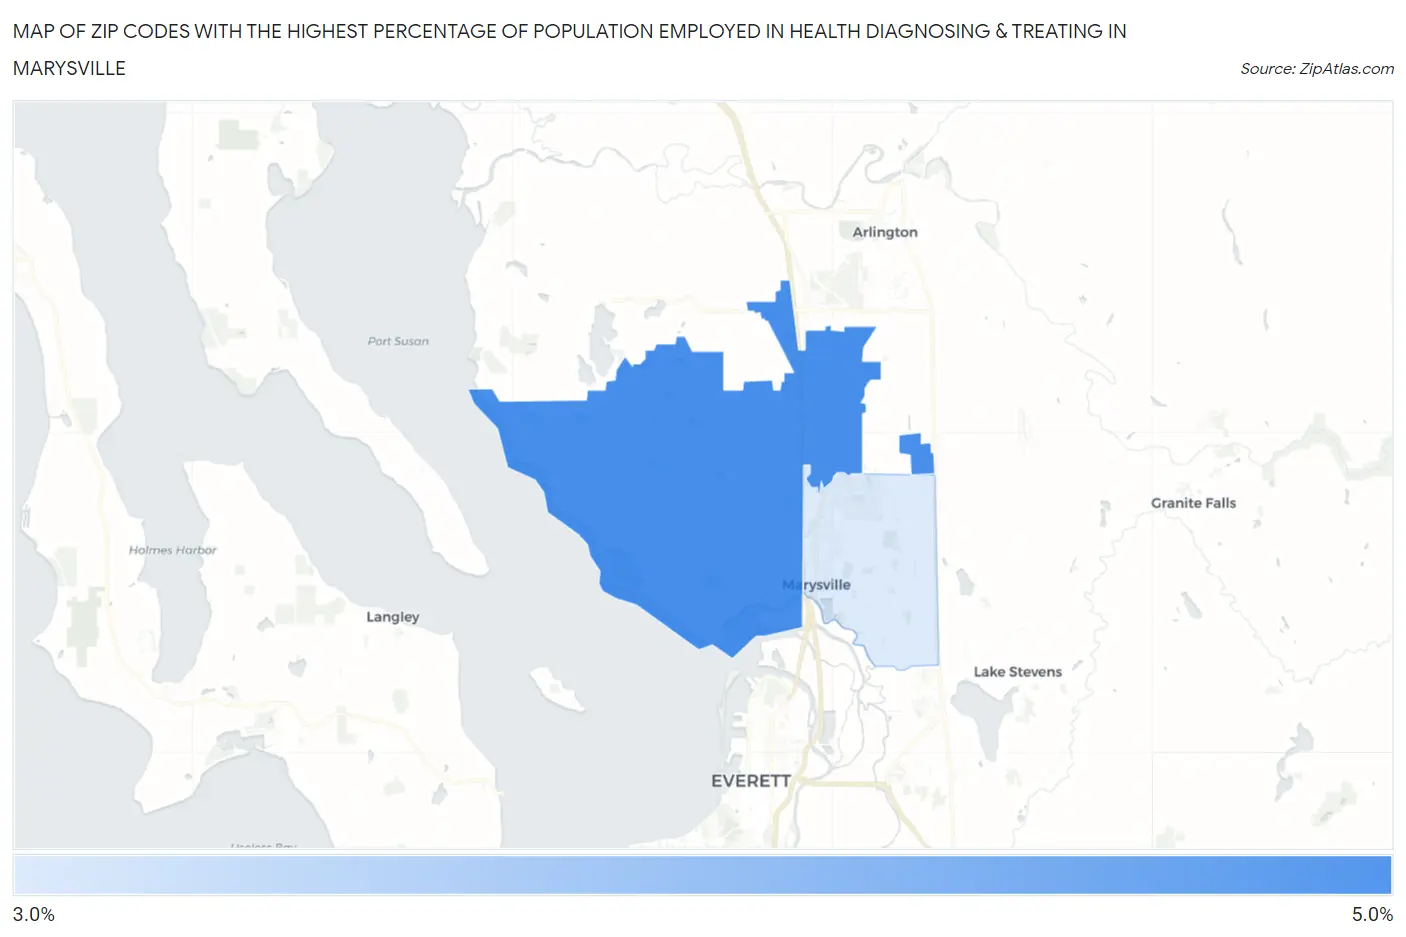
Map of Zip Codes with the Highest Percentage of Population Employed in Health Diagnosing & Treating in Marysville
3.5%
4.4%
Zip Codes with the Highest Percentage of Population Employed in Health Diagnosing & Treating in Marysville, WA
| Zip Code | % Employed | vs State | vs National | |
| 1. | 98271 | 4.4% | 5.6%(-1.20)#315 | 6.2%(-1.89)#20,164 |
| 2. | 98270 | 3.5% | 5.6%(-2.03)#369 | 6.2%(-2.72)#22,858 |
1
Common Questions
What are the Top Zip Codes with the Highest Percentage of Population Employed in Health Diagnosing & Treating in Marysville, WA?
Top Zip Codes with the Highest Percentage of Population Employed in Health Diagnosing & Treating in Marysville, WA are:
What zip code has the Highest Percentage of Population Employed in Health Diagnosing & Treating in Marysville, WA?
98271 has the Highest Percentage of Population Employed in Health Diagnosing & Treating in Marysville, WA with 4.4%.
What is the Percentage of Population Employed in Health Diagnosing & Treating in Marysville, WA?
Percentage of Population Employed in Health Diagnosing & Treating in Marysville is 3.8%.
What is the Percentage of Population Employed in Health Diagnosing & Treating in Washington?
Percentage of Population Employed in Health Diagnosing & Treating in Washington is 5.6%.
What is the Percentage of Population Employed in Health Diagnosing & Treating in the United States?
Percentage of Population Employed in Health Diagnosing & Treating in the United States is 6.2%.