Twin Lakes, WA Map & Demographics
Twin Lakes Map
Twin Lakes Overview
$24,418
PER CAPITA INCOME
$60,833
AVG FAMILY INCOME
$37,500
AVG HOUSEHOLD INCOME
0.37
INEQUALITY / GINI INDEX
74
TOTAL POPULATION
48
MALE POPULATION
26
FEMALE POPULATION
184.62
MALES / 100 FEMALES
54.17
FEMALES / 100 MALES
58.7
MEDIAN AGE
3.6
AVG FAMILY SIZE
2.3
AVG HOUSEHOLD SIZE
20
LABOR FORCE [ PEOPLE ]
29.4%
PERCENT IN LABOR FORCE
15.0%
UNEMPLOYMENT RATE
Income in Twin Lakes
Income Overview in Twin Lakes
Per Capita Income in Twin Lakes is $24,418, while median incomes of families and households are $60,833 and $37,500 respectively.
| Characteristic | Number | Measure |
| Per Capita Income | 74 | $24,418 |
| Median Family Income | 12 | $60,833 |
| Mean Family Income | 12 | $52,742 |
| Median Household Income | 32 | $37,500 |
| Mean Household Income | 32 | $52,425 |
| Income Deficit | 12 | $0 |
| Wage / Income Gap (%) | 74 | 0.00% |
| Wage / Income Gap ($) | 74 | 100.00¢ per $1 |
| Gini / Inequality Index | 74 | 0.37 |
Earnings by Sex in Twin Lakes
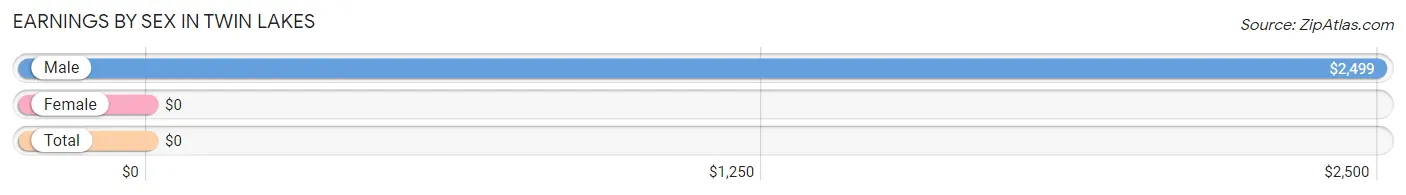
| Sex | Number | Average Earnings |
| Male | 26 (66.7%) | $2,499 |
| Female | 13 (33.3%) | $0 |
| Total | 39 (100.0%) | $0 |
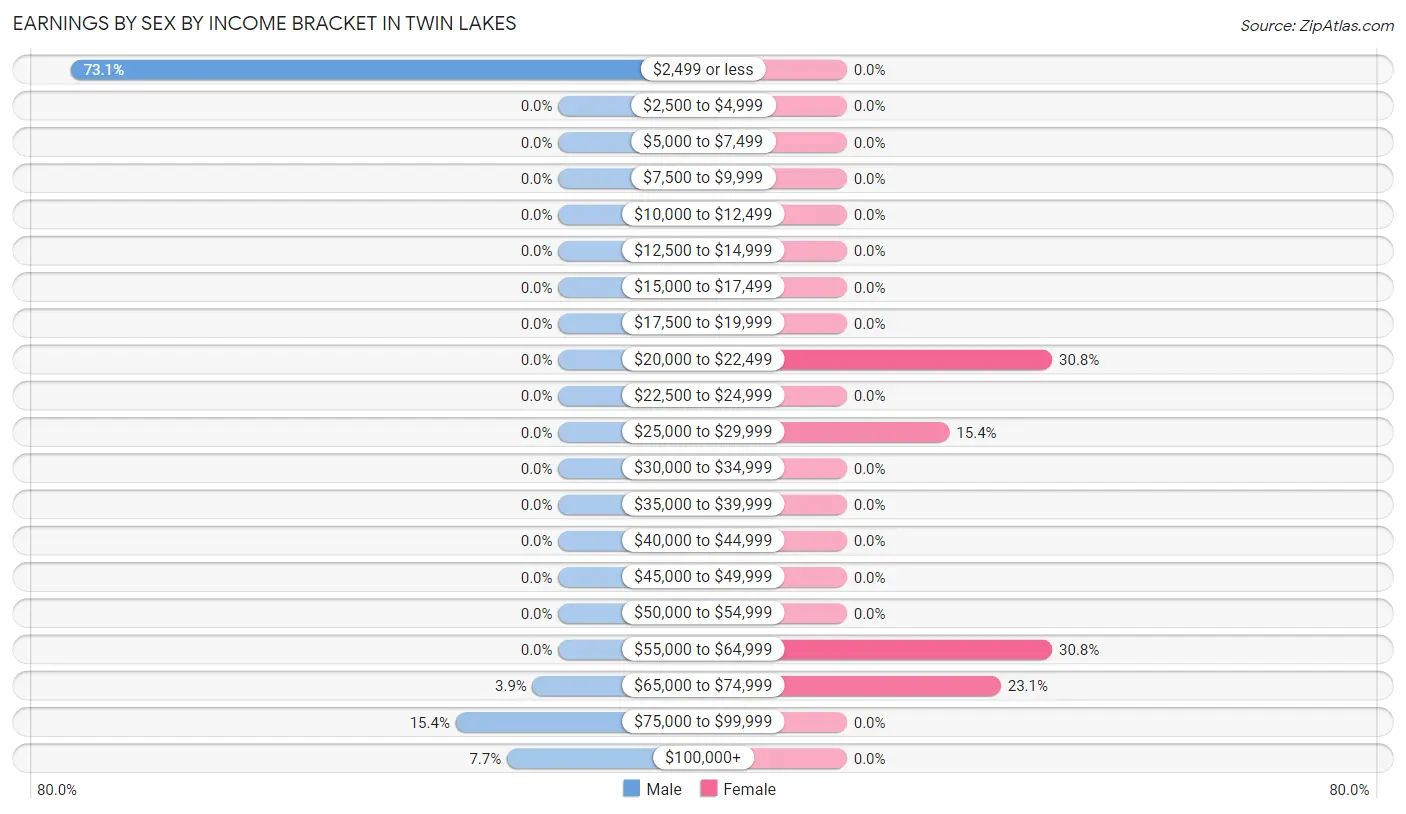
Earnings by Sex by Income Bracket in Twin Lakes
The most common earnings brackets in Twin Lakes are $2,499 or less for men (19 | 73.1%) and $20,000 to $22,499 for women (4 | 30.8%).
| Income | Male | Female |
| $2,499 or less | 19 (73.1%) | 0 (0.0%) |
| $2,500 to $4,999 | 0 (0.0%) | 0 (0.0%) |
| $5,000 to $7,499 | 0 (0.0%) | 0 (0.0%) |
| $7,500 to $9,999 | 0 (0.0%) | 0 (0.0%) |
| $10,000 to $12,499 | 0 (0.0%) | 0 (0.0%) |
| $12,500 to $14,999 | 0 (0.0%) | 0 (0.0%) |
| $15,000 to $17,499 | 0 (0.0%) | 0 (0.0%) |
| $17,500 to $19,999 | 0 (0.0%) | 0 (0.0%) |
| $20,000 to $22,499 | 0 (0.0%) | 4 (30.8%) |
| $22,500 to $24,999 | 0 (0.0%) | 0 (0.0%) |
| $25,000 to $29,999 | 0 (0.0%) | 2 (15.4%) |
| $30,000 to $34,999 | 0 (0.0%) | 0 (0.0%) |
| $35,000 to $39,999 | 0 (0.0%) | 0 (0.0%) |
| $40,000 to $44,999 | 0 (0.0%) | 0 (0.0%) |
| $45,000 to $49,999 | 0 (0.0%) | 0 (0.0%) |
| $50,000 to $54,999 | 0 (0.0%) | 0 (0.0%) |
| $55,000 to $64,999 | 0 (0.0%) | 4 (30.8%) |
| $65,000 to $74,999 | 1 (3.8%) | 3 (23.1%) |
| $75,000 to $99,999 | 4 (15.4%) | 0 (0.0%) |
| $100,000+ | 2 (7.7%) | 0 (0.0%) |
| Total | 26 (100.0%) | 13 (100.0%) |
Earnings by Sex by Educational Attainment in Twin Lakes
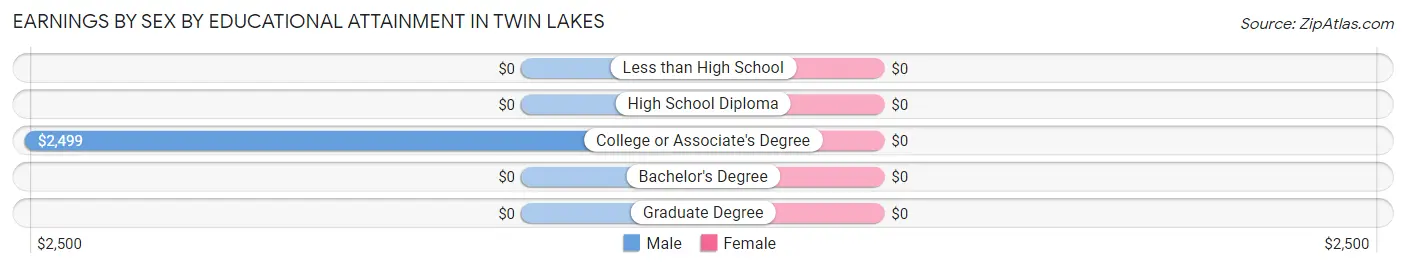
| Educational Attainment | Male Income | Female Income |
| Less than High School | - | - |
| High School Diploma | - | - |
| College or Associate's Degree | $2,499 | $0 |
| Bachelor's Degree | - | - |
| Graduate Degree | - | - |
| Total | - | - |
Family Income in Twin Lakes
Family Income Brackets in Twin Lakes
According to the Twin Lakes family income data, there are 8 families falling into the $50,000 to $74,999 income range, which is the most common income bracket and makes up 66.7% of all families.
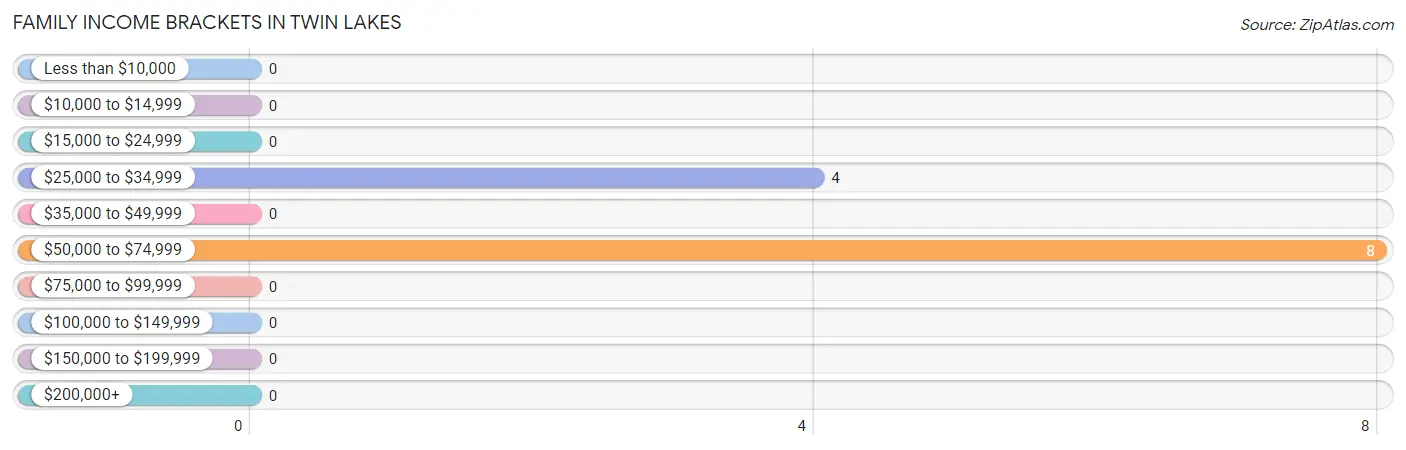
| Income Bracket | # Families | % Families |
| Less than $10,000 | 0 | 0.0% |
| $10,000 to $14,999 | 0 | 0.0% |
| $15,000 to $24,999 | 0 | 0.0% |
| $25,000 to $34,999 | 4 | 33.3% |
| $35,000 to $49,999 | 0 | 0.0% |
| $50,000 to $74,999 | 8 | 66.7% |
| $75,000 to $99,999 | 0 | 0.0% |
| $100,000 to $149,999 | 0 | 0.0% |
| $150,000 to $199,999 | 0 | 0.0% |
| $200,000+ | 0 | 0.0% |
Family Income by Famaliy Size in Twin Lakes
2-person families (10 | 83.3%) account for the highest median family income in Twin Lakes with $61,250 per family, while 2-person families (10 | 83.3%) have the highest median income of $30,625 per family member.
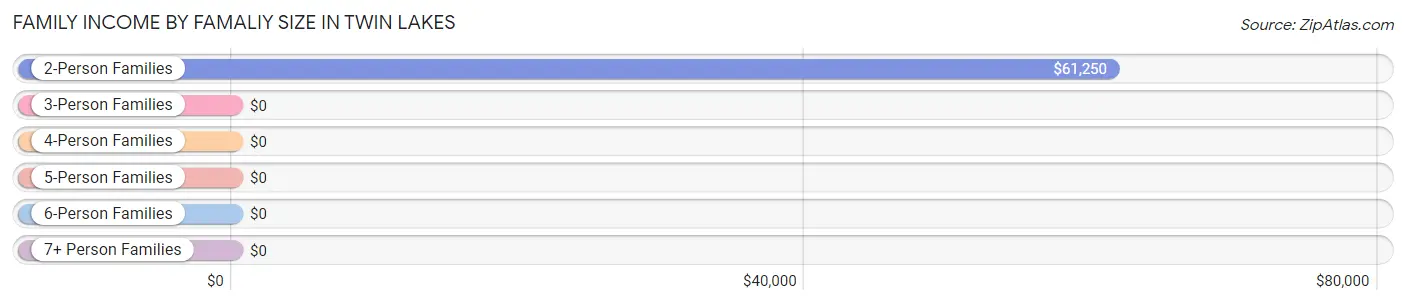
| Income Bracket | # Families | Median Income |
| 2-Person Families | 10 (83.3%) | $61,250 |
| 3-Person Families | 0 (0.0%) | $0 |
| 4-Person Families | 2 (16.7%) | $0 |
| 5-Person Families | 0 (0.0%) | $0 |
| 6-Person Families | 0 (0.0%) | $0 |
| 7+ Person Families | 0 (0.0%) | $0 |
| Total | 12 (100.0%) | $60,833 |
Family Income by Number of Earners in Twin Lakes
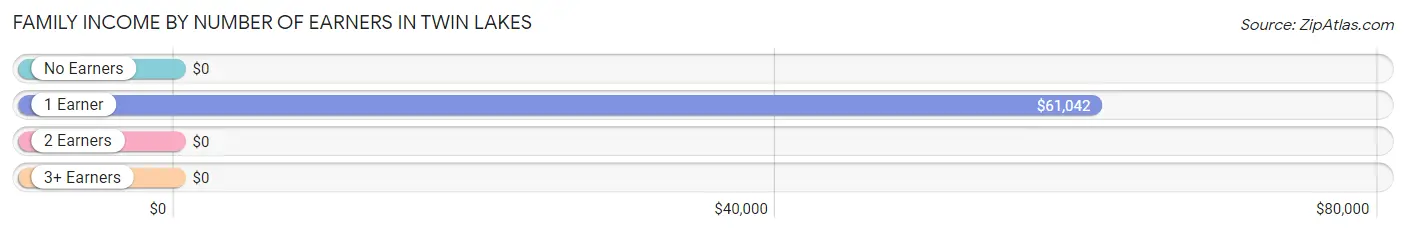
| Number of Earners | # Families | Median Income |
| No Earners | 2 (16.7%) | $0 |
| 1 Earner | 9 (75.0%) | $61,042 |
| 2 Earners | 1 (8.3%) | $0 |
| 3+ Earners | 0 (0.0%) | $0 |
| Total | 12 (100.0%) | $60,833 |
Household Income in Twin Lakes
Household Income Brackets in Twin Lakes
With 8 households falling in the category, the $50,000 to $74,999 income range is the most frequent in Twin Lakes, accounting for 25.0% of all households.
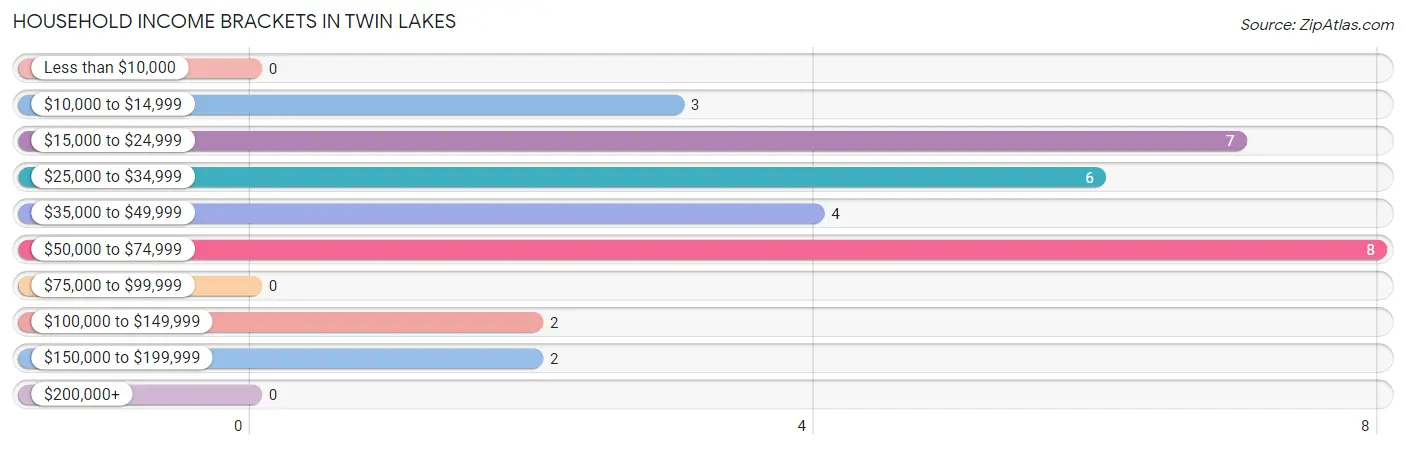
| Income Bracket | # Households | % Households |
| Less than $10,000 | 0 | 0.0% |
| $10,000 to $14,999 | 3 | 9.4% |
| $15,000 to $24,999 | 7 | 21.9% |
| $25,000 to $34,999 | 6 | 18.8% |
| $35,000 to $49,999 | 4 | 12.5% |
| $50,000 to $74,999 | 8 | 25.0% |
| $75,000 to $99,999 | 0 | 0.0% |
| $100,000 to $149,999 | 2 | 6.3% |
| $150,000 to $199,999 | 2 | 6.3% |
| $200,000+ | 0 | 0.0% |
Household Income by Householder Age in Twin Lakes
The median household income in Twin Lakes is $37,500, with the highest median household income of $32,708 found in the 65+ years age bracket for the primary householder. A total of 21 households (65.6%) fall into this category.
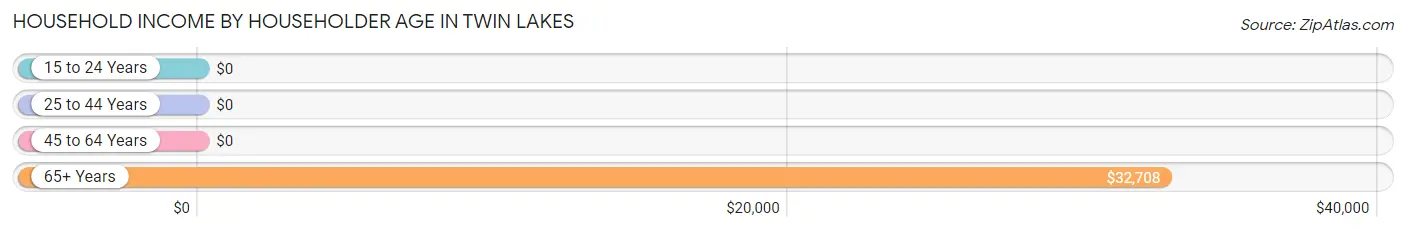
| Income Bracket | # Households | Median Income |
| 15 to 24 Years | 0 (0.0%) | $0 |
| 25 to 44 Years | 2 (6.2%) | $0 |
| 45 to 64 Years | 9 (28.1%) | $0 |
| 65+ Years | 21 (65.6%) | $32,708 |
| Total | 32 (100.0%) | $37,500 |
Poverty in Twin Lakes
Income Below Poverty by Sex and Age in Twin Lakes
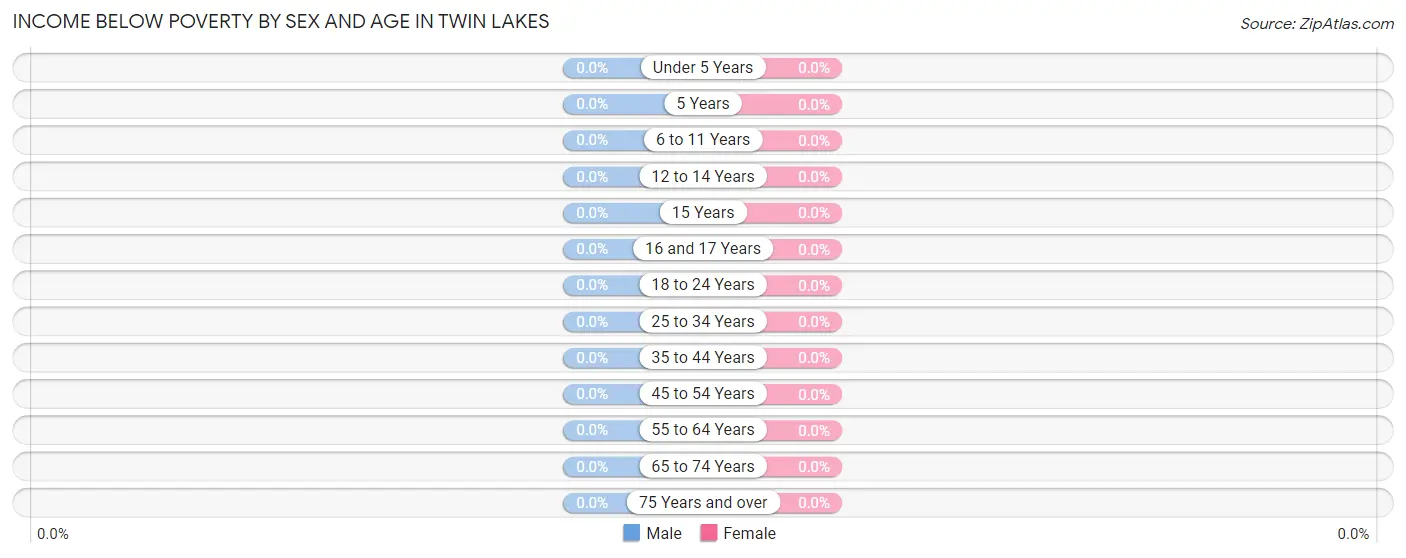
| Age Bracket | Male | Female |
| Under 5 Years | 0 (0.0%) | 0 (0.0%) |
| 5 Years | 0 (0.0%) | 0 (0.0%) |
| 6 to 11 Years | 0 (0.0%) | 0 (0.0%) |
| 12 to 14 Years | 0 (0.0%) | 0 (0.0%) |
| 15 Years | 0 (0.0%) | 0 (0.0%) |
| 16 and 17 Years | 0 (0.0%) | 0 (0.0%) |
| 18 to 24 Years | 0 (0.0%) | 0 (0.0%) |
| 25 to 34 Years | 0 (0.0%) | 0 (0.0%) |
| 35 to 44 Years | 0 (0.0%) | 0 (0.0%) |
| 45 to 54 Years | 0 (0.0%) | 0 (0.0%) |
| 55 to 64 Years | 0 (0.0%) | 0 (0.0%) |
| 65 to 74 Years | 0 (0.0%) | 0 (0.0%) |
| 75 Years and over | 0 (0.0%) | 0 (0.0%) |
| Total | 0 (0.0%) | 0 (0.0%) |
Income Above Poverty by Sex and Age in Twin Lakes
According to the poverty statistics in Twin Lakes, males aged 6 to 11 years and females aged 12 to 14 years are the age groups that are most secure financially, with 100.0% of males and 100.0% of females in these age groups living above the poverty line.
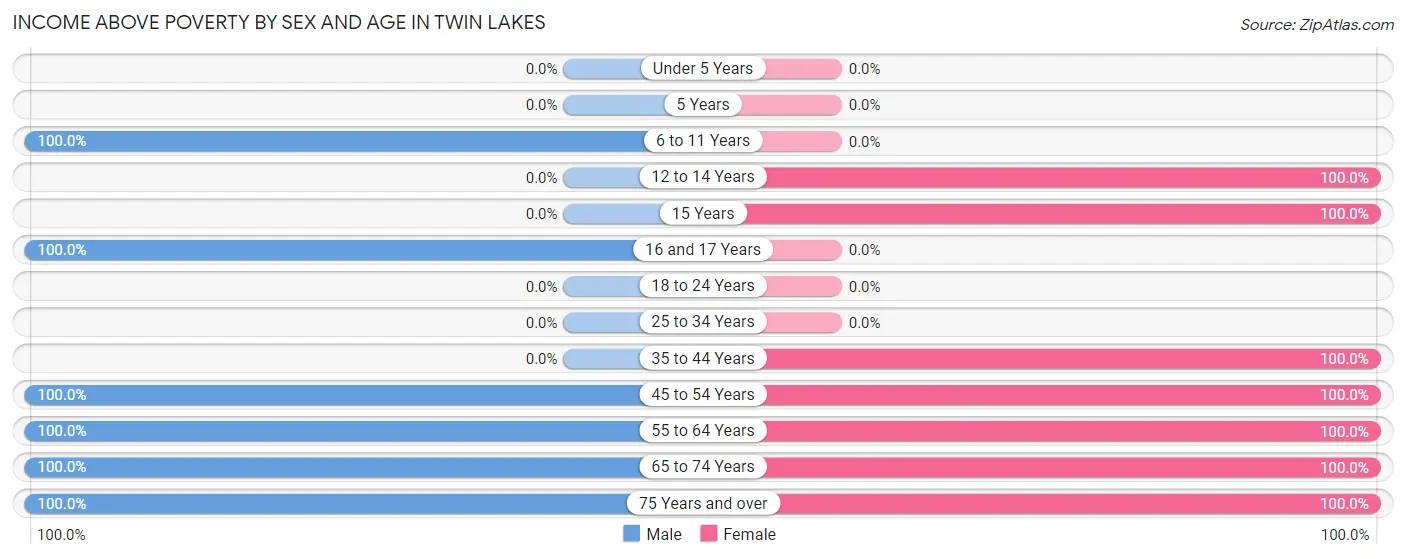
| Age Bracket | Male | Female |
| Under 5 Years | 0 (0.0%) | 0 (0.0%) |
| 5 Years | 0 (0.0%) | 0 (0.0%) |
| 6 to 11 Years | 2 (100.0%) | 0 (0.0%) |
| 12 to 14 Years | 0 (0.0%) | 3 (100.0%) |
| 15 Years | 0 (0.0%) | 1 (100.0%) |
| 16 and 17 Years | 12 (100.0%) | 0 (0.0%) |
| 18 to 24 Years | 0 (0.0%) | 0 (0.0%) |
| 25 to 34 Years | 0 (0.0%) | 0 (0.0%) |
| 35 to 44 Years | 0 (0.0%) | 2 (100.0%) |
| 45 to 54 Years | 4 (100.0%) | 3 (100.0%) |
| 55 to 64 Years | 16 (100.0%) | 8 (100.0%) |
| 65 to 74 Years | 4 (100.0%) | 3 (100.0%) |
| 75 Years and over | 10 (100.0%) | 6 (100.0%) |
| Total | 48 (100.0%) | 26 (100.0%) |
Income Below Poverty Among Married-Couple Families in Twin Lakes
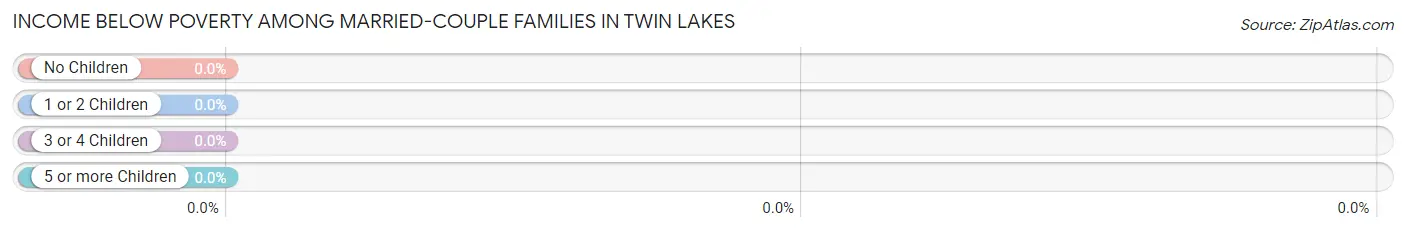
| Children | Above Poverty | Below Poverty |
| No Children | 8 (100.0%) | 0 (0.0%) |
| 1 or 2 Children | 0 (0.0%) | 0 (0.0%) |
| 3 or 4 Children | 0 (0.0%) | 0 (0.0%) |
| 5 or more Children | 0 (0.0%) | 0 (0.0%) |
| Total | 8 (100.0%) | 0 (0.0%) |
Income Below Poverty Among Single-Parent Households in Twin Lakes
| Children | Single Father | Single Mother |
| No Children | 0 (0.0%) | 0 (0.0%) |
| 1 or 2 Children | 0 (0.0%) | 0 (0.0%) |
| 3 or 4 Children | 0 (0.0%) | 0 (0.0%) |
| 5 or more Children | 0 (0.0%) | 0 (0.0%) |
| Total | 0 (0.0%) | 0 (0.0%) |
Income Below Poverty Among Married-Couple vs Single-Parent Households in Twin Lakes
| Children | Married-Couple Families | Single-Parent Households |
| No Children | 0 (0.0%) | 0 (0.0%) |
| 1 or 2 Children | 0 (0.0%) | 0 (0.0%) |
| 3 or 4 Children | 0 (0.0%) | 0 (0.0%) |
| 5 or more Children | 0 (0.0%) | 0 (0.0%) |
| Total | 0 (0.0%) | 0 (0.0%) |
Race in Twin Lakes
The most populous races in Twin Lakes are White / Caucasian (40 | 54.0%), Native / Alaskan (30 | 40.5%), and Black / African American (4 | 5.4%).
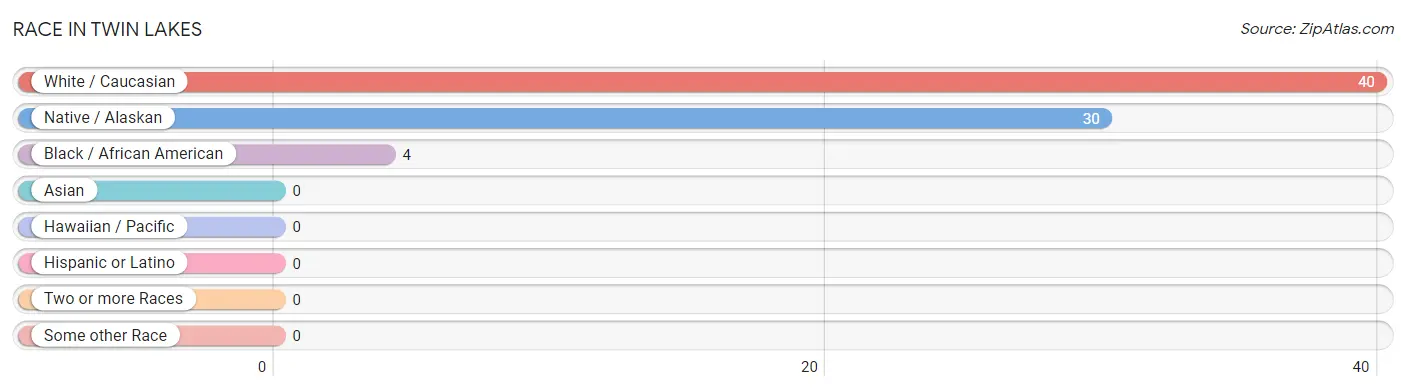
| Race | # Population | % Population |
| Asian | 0 | 0.0% |
| Black / African American | 4 | 5.4% |
| Hawaiian / Pacific | 0 | 0.0% |
| Hispanic or Latino | 0 | 0.0% |
| Native / Alaskan | 30 | 40.5% |
| White / Caucasian | 40 | 54.0% |
| Two or more Races | 0 | 0.0% |
| Some other Race | 0 | 0.0% |
| Total | 74 | 100.0% |
Ancestry in Twin Lakes
The most populous ancestries reported in Twin Lakes are Colville (30 | 40.5%), German (14 | 18.9%), Irish (11 | 14.9%), Norwegian (9 | 12.2%), and African (4 | 5.4%), together accounting for 91.9% of all Twin Lakes residents.
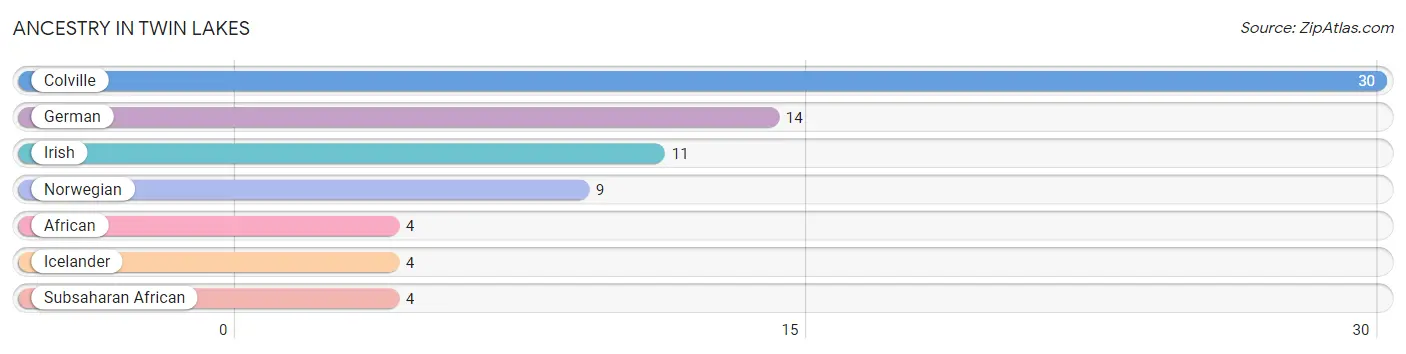
| Ancestry | # Population | % Population |
| African | 4 | 5.4% |
| Colville | 30 | 40.5% |
| German | 14 | 18.9% |
| Icelander | 4 | 5.4% |
| Irish | 11 | 14.9% |
| Norwegian | 9 | 12.2% |
| Subsaharan African | 4 | 5.4% | View All 7 Rows |
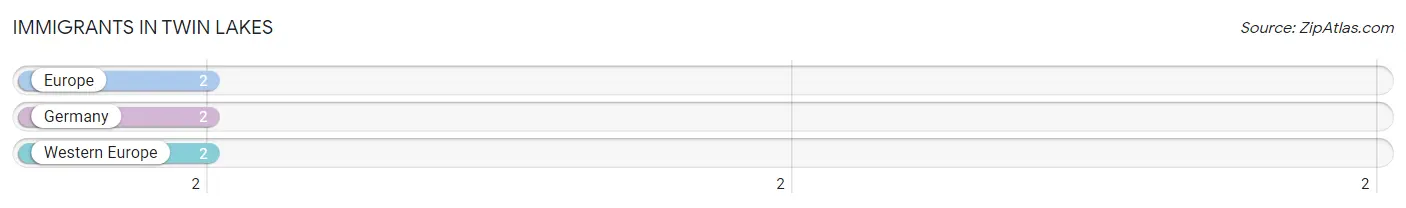
Immigrants in Twin Lakes
The most numerous immigrant groups reported in Twin Lakes came from Europe (2 | 2.7%), Germany (2 | 2.7%), and Western Europe (2 | 2.7%), together accounting for 8.1% of all Twin Lakes residents.
| Immigration Origin | # Population | % Population |
| Europe | 2 | 2.7% |
| Germany | 2 | 2.7% |
| Western Europe | 2 | 2.7% | View All 3 Rows |
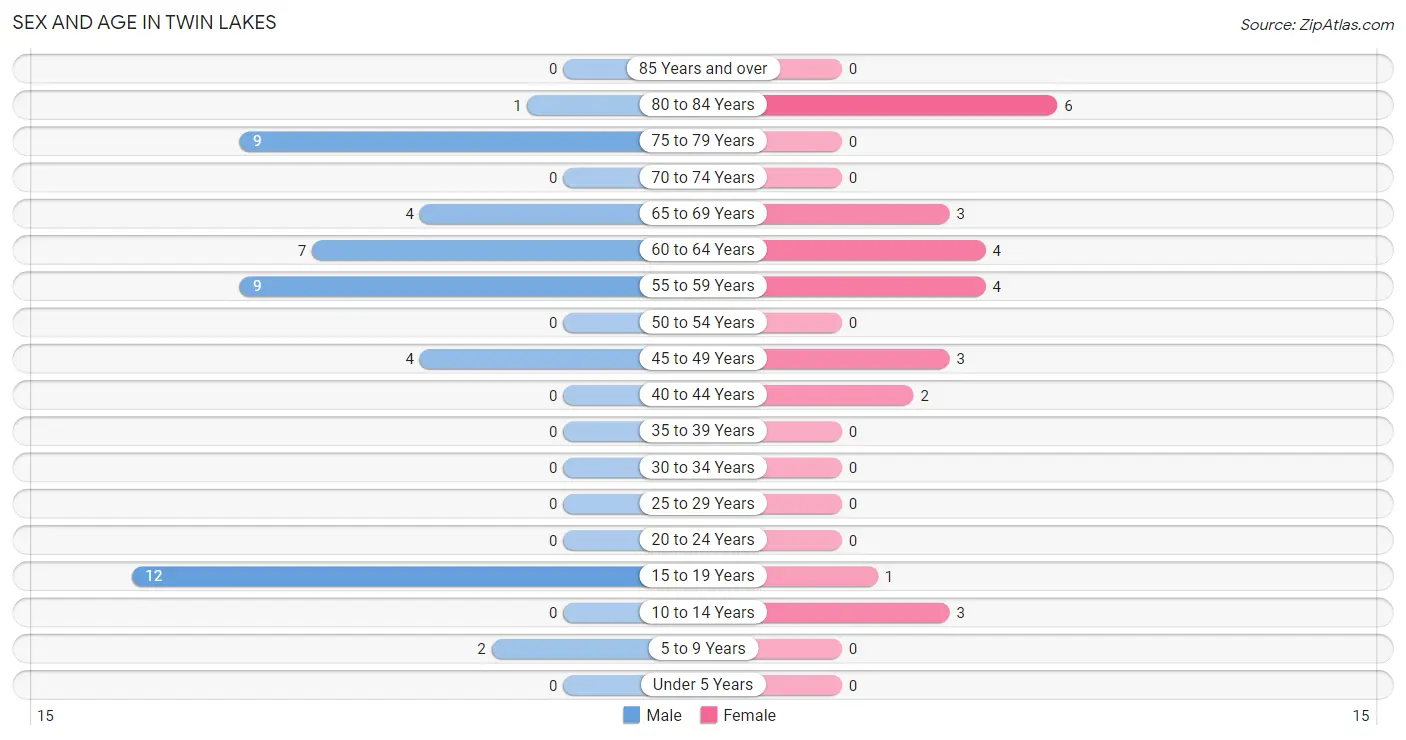
Sex and Age in Twin Lakes
Sex and Age in Twin Lakes
The most populous age groups in Twin Lakes are 15 to 19 Years (12 | 25.0%) for men and 80 to 84 Years (6 | 23.1%) for women.
| Age Bracket | Male | Female |
| Under 5 Years | 0 (0.0%) | 0 (0.0%) |
| 5 to 9 Years | 2 (4.2%) | 0 (0.0%) |
| 10 to 14 Years | 0 (0.0%) | 3 (11.5%) |
| 15 to 19 Years | 12 (25.0%) | 1 (3.8%) |
| 20 to 24 Years | 0 (0.0%) | 0 (0.0%) |
| 25 to 29 Years | 0 (0.0%) | 0 (0.0%) |
| 30 to 34 Years | 0 (0.0%) | 0 (0.0%) |
| 35 to 39 Years | 0 (0.0%) | 0 (0.0%) |
| 40 to 44 Years | 0 (0.0%) | 2 (7.7%) |
| 45 to 49 Years | 4 (8.3%) | 3 (11.5%) |
| 50 to 54 Years | 0 (0.0%) | 0 (0.0%) |
| 55 to 59 Years | 9 (18.8%) | 4 (15.4%) |
| 60 to 64 Years | 7 (14.6%) | 4 (15.4%) |
| 65 to 69 Years | 4 (8.3%) | 3 (11.5%) |
| 70 to 74 Years | 0 (0.0%) | 0 (0.0%) |
| 75 to 79 Years | 9 (18.8%) | 0 (0.0%) |
| 80 to 84 Years | 1 (2.1%) | 6 (23.1%) |
| 85 Years and over | 0 (0.0%) | 0 (0.0%) |
| Total | 48 (100.0%) | 26 (100.0%) |
Families and Households in Twin Lakes
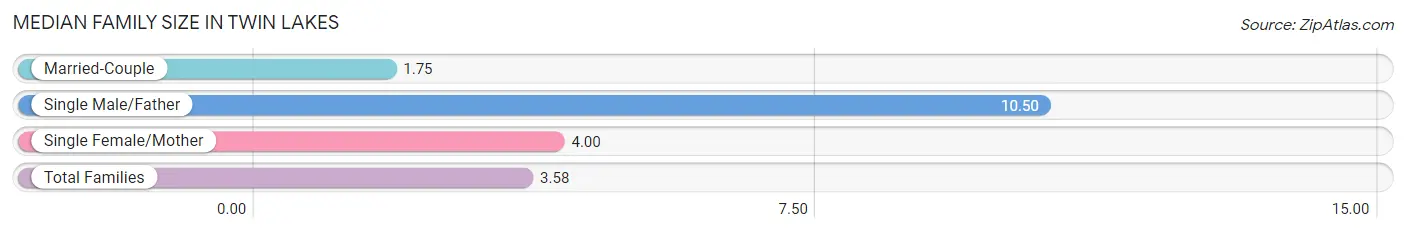
Median Family Size in Twin Lakes
The median family size in Twin Lakes is 3.58 persons per family, with single male/father families (2 | 16.7%) accounting for the largest median family size of 10.5 persons per family. On the other hand, married-couple families (8 | 66.7%) represent the smallest median family size with 1.75 persons per family.
| Family Type | # Families | Family Size |
| Married-Couple | 8 (66.7%) | 1.75 |
| Single Male/Father | 2 (16.7%) | 10.50 |
| Single Female/Mother | 2 (16.7%) | 4.00 |
| Total Families | 12 (100.0%) | 3.58 |
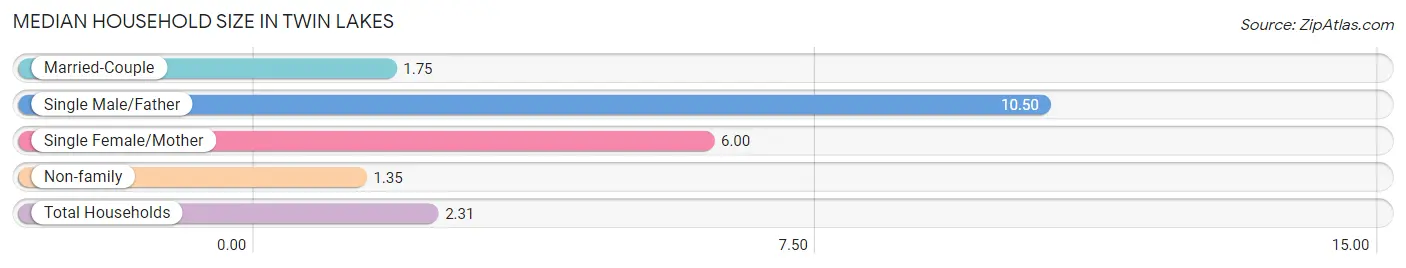
Median Household Size in Twin Lakes
The median household size in Twin Lakes is 2.31 persons per household, with single male/father households (2 | 6.2%) accounting for the largest median household size of 10.5 persons per household. non-family households (20 | 62.5%) represent the smallest median household size with 1.35 persons per household.
| Household Type | # Households | Household Size |
| Married-Couple | 8 (25.0%) | 1.75 |
| Single Male/Father | 2 (6.2%) | 10.50 |
| Single Female/Mother | 2 (6.2%) | 6.00 |
| Non-family | 20 (62.5%) | 1.35 |
| Total Households | 32 (100.0%) | 2.31 |
Household Size by Marriage Status in Twin Lakes
Out of a total of 32 households in Twin Lakes, 12 (37.5%) are family households, while 20 (62.5%) are nonfamily households. The most numerous type of family households are 2-person households, comprising 10, and the most common type of nonfamily households are 1-person households, comprising 14.
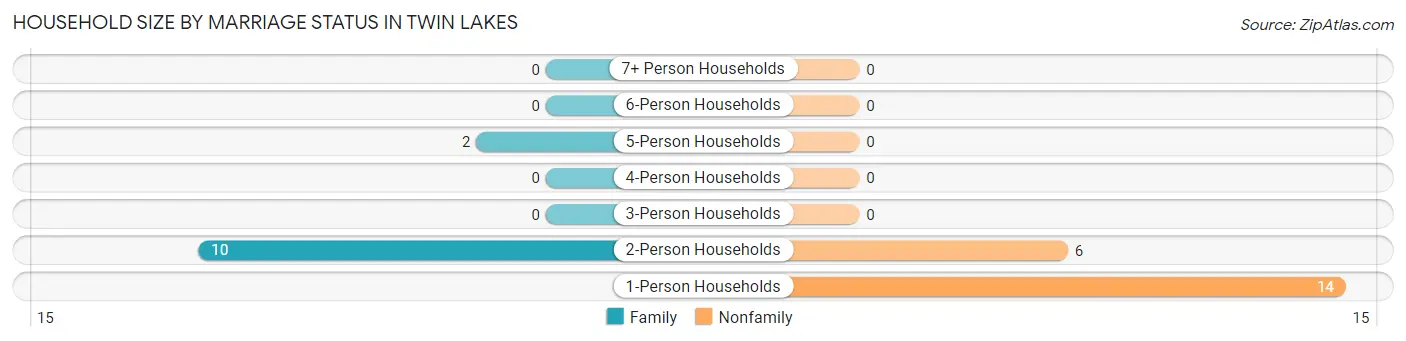
| Household Size | Family Households | Nonfamily Households |
| 1-Person Households | - | 14 (43.8%) |
| 2-Person Households | 10 (31.2%) | 6 (18.8%) |
| 3-Person Households | 0 (0.0%) | 0 (0.0%) |
| 4-Person Households | 0 (0.0%) | 0 (0.0%) |
| 5-Person Households | 2 (6.2%) | 0 (0.0%) |
| 6-Person Households | 0 (0.0%) | 0 (0.0%) |
| 7+ Person Households | 0 (0.0%) | 0 (0.0%) |
| Total | 12 (37.5%) | 20 (62.5%) |
Female Fertility in Twin Lakes
Fertility by Age in Twin Lakes
| Age Bracket | Women with Births | Births / 1,000 Women |
| 15 to 19 years | 0 (0.0%) | 0.0 |
| 20 to 34 years | 0 (0.0%) | 0.0 |
| 35 to 50 years | 0 (0.0%) | 0.0 |
| Total | 0 (0.0%) | 0.0 |
Fertility by Age by Marriage Status in Twin Lakes
| Age Bracket | Married | Unmarried |
| 15 to 19 years | 0 (0.0%) | 0 (0.0%) |
| 20 to 34 years | 0 (0.0%) | 0 (0.0%) |
| 35 to 50 years | 0 (0.0%) | 0 (0.0%) |
| Total | 0 (0.0%) | 0 (0.0%) |
Fertility by Education in Twin Lakes
| Educational Attainment | Women with Births | Births / 1,000 Women |
| Less than High School | 0 (0.0%) | 0.0 |
| High School Diploma | 0 (0.0%) | 0.0 |
| College or Associate's Degree | 0 (0.0%) | 0.0 |
| Bachelor's Degree | 0 (0.0%) | 0.0 |
| Graduate Degree | 0 (0.0%) | 0.0 |
| Total | 0 (0.0%) | 0.0 |
Fertility by Education by Marriage Status in Twin Lakes
| Educational Attainment | Married | Unmarried |
| Less than High School | 0 (0.0%) | 0 (0.0%) |
| High School Diploma | 0 (0.0%) | 0 (0.0%) |
| College or Associate's Degree | 0 (0.0%) | 0 (0.0%) |
| Bachelor's Degree | 0 (0.0%) | 0 (0.0%) |
| Graduate Degree | 0 (0.0%) | 0 (0.0%) |
| Total | 0 (0.0%) | 0 (0.0%) |
Employment Characteristics in Twin Lakes
Employment by Class of Employer in Twin Lakes
Among the 17 employed individuals in Twin Lakes, federal government employees (6 | 35.3%), self-employed (incorporated) (4 | 23.5%), and not-for-profit organizations (4 | 23.5%) make up the most common classes of employment.
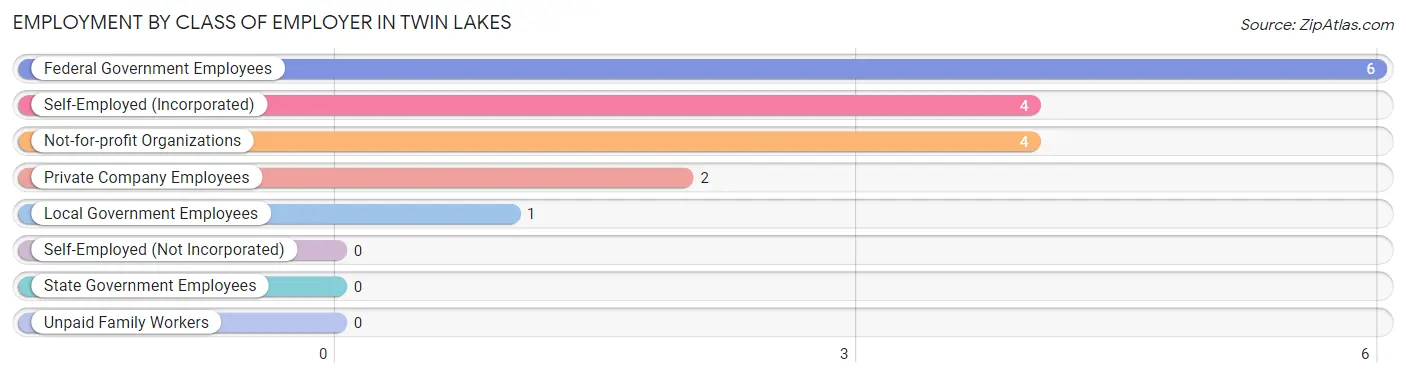
| Employer Class | # Employees | % Employees |
| Private Company Employees | 2 | 11.8% |
| Self-Employed (Incorporated) | 4 | 23.5% |
| Self-Employed (Not Incorporated) | 0 | 0.0% |
| Not-for-profit Organizations | 4 | 23.5% |
| Local Government Employees | 1 | 5.9% |
| State Government Employees | 0 | 0.0% |
| Federal Government Employees | 6 | 35.3% |
| Unpaid Family Workers | 0 | 0.0% |
| Total | 17 | 100.0% |
Employment Status by Age in Twin Lakes
According to the labor force statistics for Twin Lakes, out of the total population over 16 years of age (68), 29.4% or 20 individuals are in the labor force, with 15.0% or 3 of them unemployed. The age group with the highest labor force participation rate is 35 to 44 years, with 100.0% or 2 individuals in the labor force. Within the labor force, the 45 to 54 years age range has the highest percentage of unemployed individuals, with 42.9% or 3 of them being unemployed.
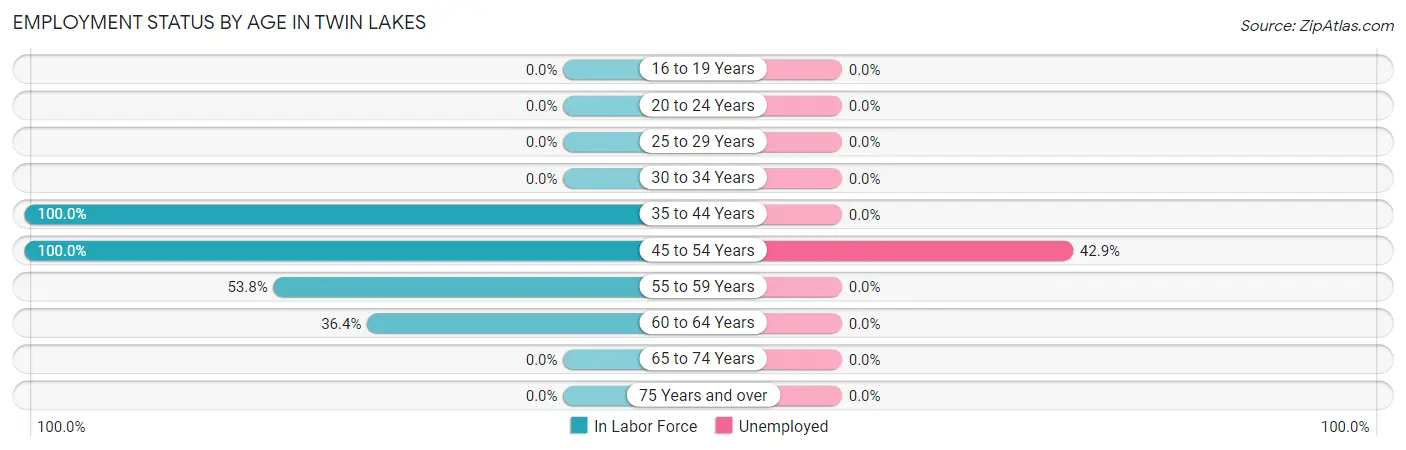
| Age Bracket | In Labor Force | Unemployed |
| 16 to 19 Years | 0 (0.0%) | 0 (0.0%) |
| 20 to 24 Years | 0 (0.0%) | 0 (0.0%) |
| 25 to 29 Years | 0 (0.0%) | 0 (0.0%) |
| 30 to 34 Years | 0 (0.0%) | 0 (0.0%) |
| 35 to 44 Years | 2 (100.0%) | 0 (0.0%) |
| 45 to 54 Years | 7 (100.0%) | 3 (42.9%) |
| 55 to 59 Years | 7 (53.8%) | 0 (0.0%) |
| 60 to 64 Years | 4 (36.4%) | 0 (0.0%) |
| 65 to 74 Years | 0 (0.0%) | 0 (0.0%) |
| 75 Years and over | 0 (0.0%) | 0 (0.0%) |
| Total | 20 (29.4%) | 3 (15.0%) |
Employment Status by Educational Attainment in Twin Lakes
According to labor force statistics for Twin Lakes, 60.6% of individuals (20) out of the total population between 25 and 64 years of age (33) are in the labor force, with 15.0% or 3 of them being unemployed. The group with the highest labor force participation rate are those with the educational attainment of high school diploma, with 100.0% or 5 individuals in the labor force. Within the labor force, individuals with high school diploma education have the highest percentage of unemployment, with 60.0% or 3 of them being unemployed.
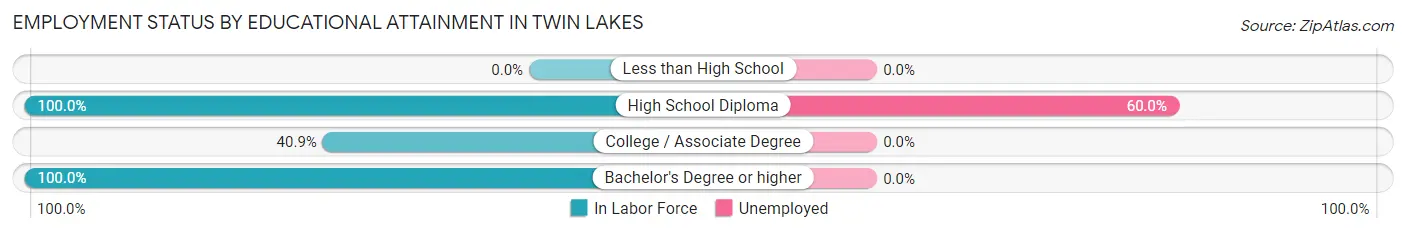
| Educational Attainment | In Labor Force | Unemployed |
| Less than High School | 0 (0.0%) | 0 (0.0%) |
| High School Diploma | 5 (100.0%) | 3 (60.0%) |
| College / Associate Degree | 9 (40.9%) | 0 (0.0%) |
| Bachelor's Degree or higher | 6 (100.0%) | 0 (0.0%) |
| Total | 20 (60.6%) | 5 (15.0%) |
Employment Occupations by Sex in Twin Lakes
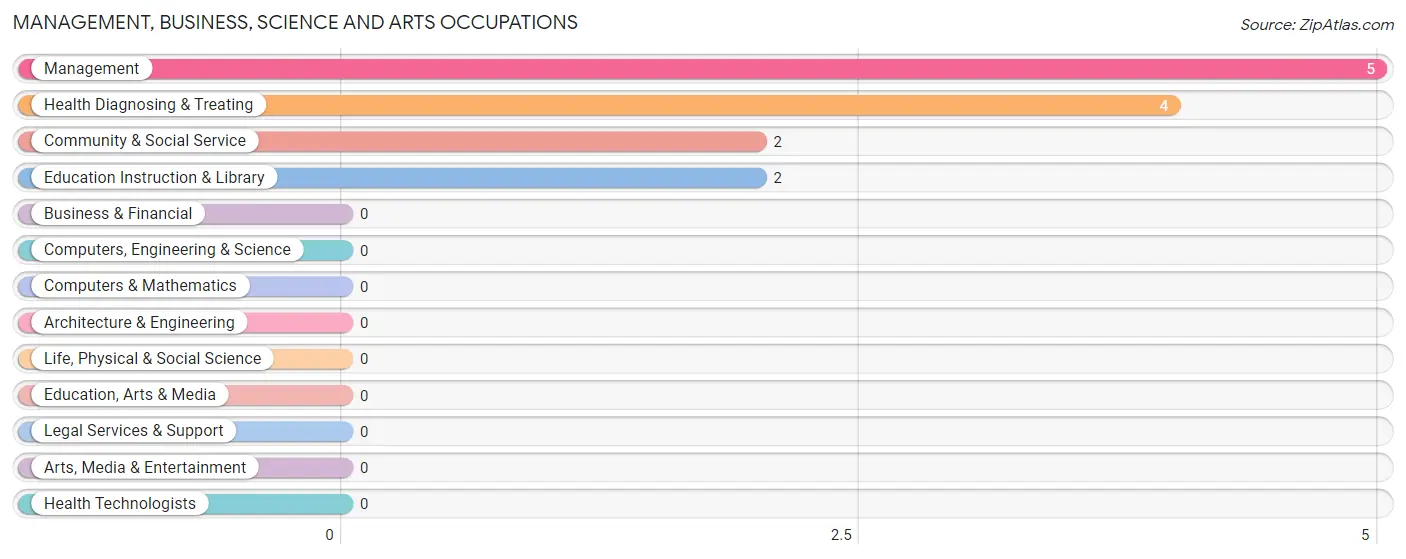
Management, Business, Science and Arts Occupations
The most common Management, Business, Science and Arts occupations in Twin Lakes are Management (5 | 29.4%), Health Diagnosing & Treating (4 | 23.5%), Community & Social Service (2 | 11.8%), and Education Instruction & Library (2 | 11.8%).
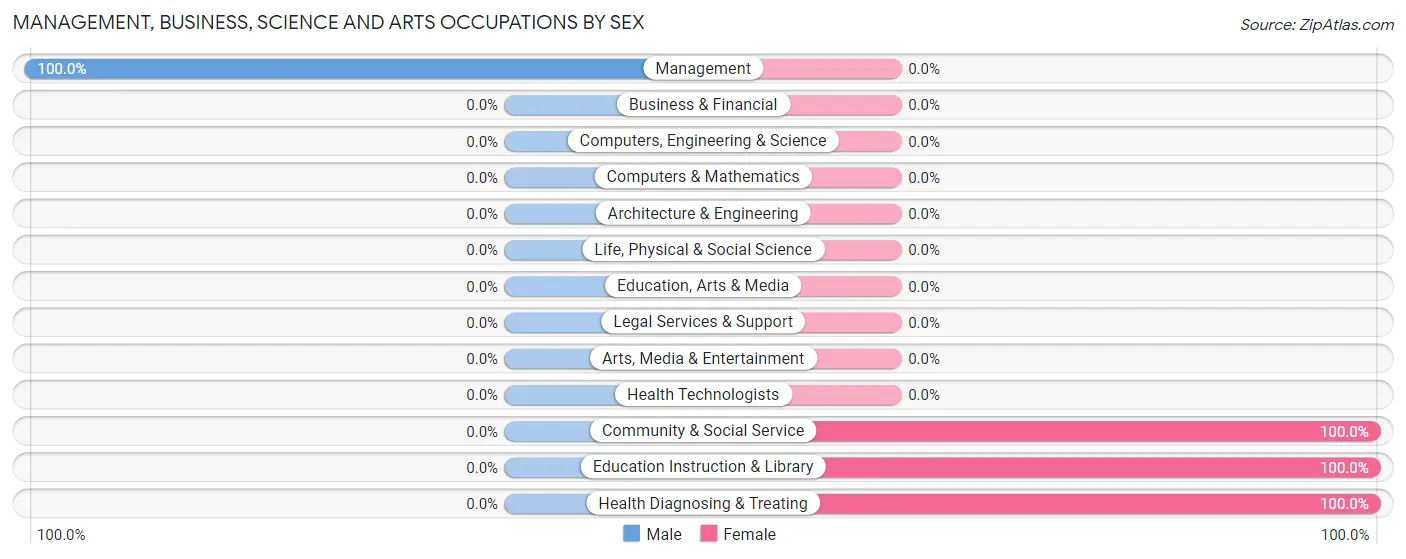
Management, Business, Science and Arts Occupations by Sex
| Occupation | Male | Female |
| Management | 5 (100.0%) | 0 (0.0%) |
| Business & Financial | 0 (0.0%) | 0 (0.0%) |
| Computers, Engineering & Science | 0 (0.0%) | 0 (0.0%) |
| Computers & Mathematics | 0 (0.0%) | 0 (0.0%) |
| Architecture & Engineering | 0 (0.0%) | 0 (0.0%) |
| Life, Physical & Social Science | 0 (0.0%) | 0 (0.0%) |
| Community & Social Service | 0 (0.0%) | 2 (100.0%) |
| Education, Arts & Media | 0 (0.0%) | 0 (0.0%) |
| Legal Services & Support | 0 (0.0%) | 0 (0.0%) |
| Education Instruction & Library | 0 (0.0%) | 2 (100.0%) |
| Arts, Media & Entertainment | 0 (0.0%) | 0 (0.0%) |
| Health Diagnosing & Treating | 0 (0.0%) | 4 (100.0%) |
| Health Technologists | 0 (0.0%) | 0 (0.0%) |
| Total (Category) | 5 (45.5%) | 6 (54.5%) |
| Total (Overall) | 7 (41.2%) | 10 (58.8%) |
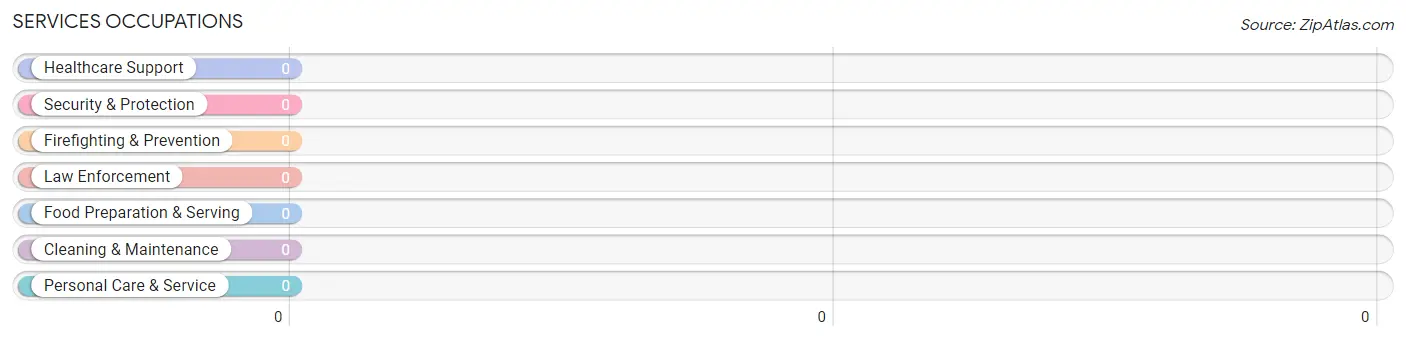
Services Occupations
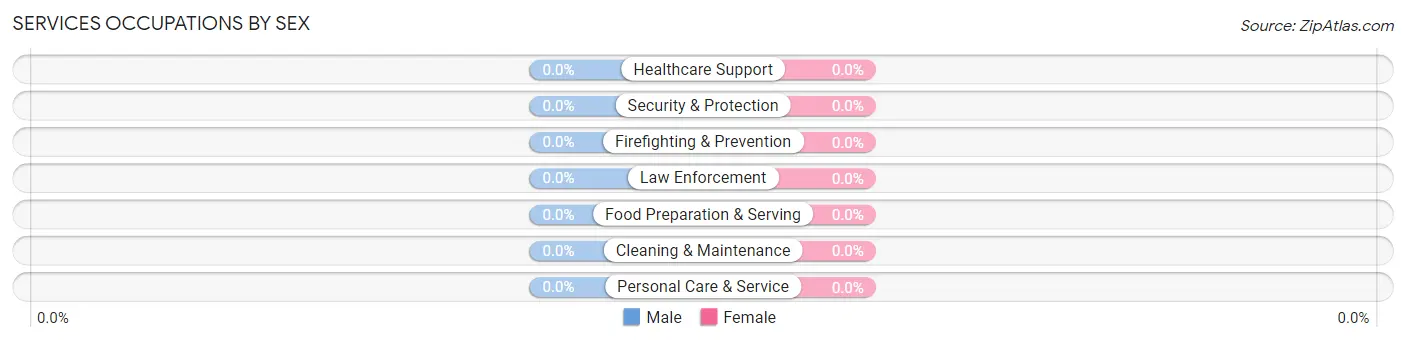
Services Occupations by Sex
| Occupation | Male | Female |
| Healthcare Support | 0 (0.0%) | 0 (0.0%) |
| Security & Protection | 0 (0.0%) | 0 (0.0%) |
| Firefighting & Prevention | 0 (0.0%) | 0 (0.0%) |
| Law Enforcement | 0 (0.0%) | 0 (0.0%) |
| Food Preparation & Serving | 0 (0.0%) | 0 (0.0%) |
| Cleaning & Maintenance | 0 (0.0%) | 0 (0.0%) |
| Personal Care & Service | 0 (0.0%) | 0 (0.0%) |
| Total (Category) | 0 (0.0%) | 0 (0.0%) |
| Total (Overall) | 7 (41.2%) | 10 (58.8%) |
Sales and Office Occupations
Sales and Office Occupations by Sex
| Occupation | Male | Female |
| Sales & Related | 0 (0.0%) | 0 (0.0%) |
| Office & Administration | 0 (0.0%) | 0 (0.0%) |
| Total (Category) | 0 (0.0%) | 0 (0.0%) |
| Total (Overall) | 7 (41.2%) | 10 (58.8%) |
Natural Resources, Construction and Maintenance Occupations
Natural Resources, Construction and Maintenance Occupations by Sex
| Occupation | Male | Female |
| Farming, Fishing & Forestry | 0 (0.0%) | 0 (0.0%) |
| Construction & Extraction | 0 (0.0%) | 0 (0.0%) |
| Installation, Maintenance & Repair | 0 (0.0%) | 0 (0.0%) |
| Total (Category) | 0 (0.0%) | 0 (0.0%) |
| Total (Overall) | 7 (41.2%) | 10 (58.8%) |
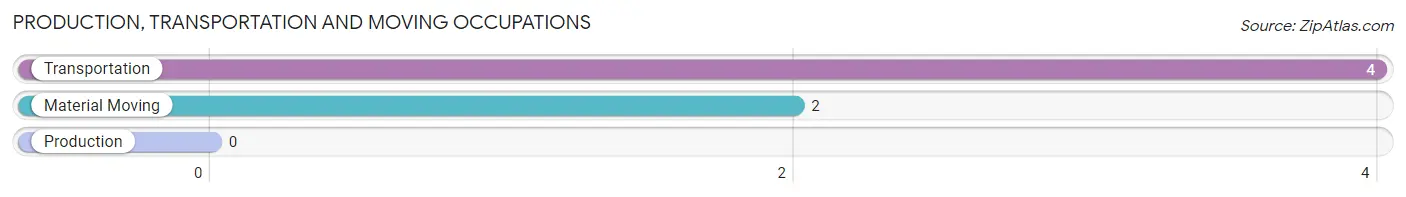
Production, Transportation and Moving Occupations
The most common Production, Transportation and Moving occupations in Twin Lakes are Transportation (4 | 23.5%), and Material Moving (2 | 11.8%).
Production, Transportation and Moving Occupations by Sex
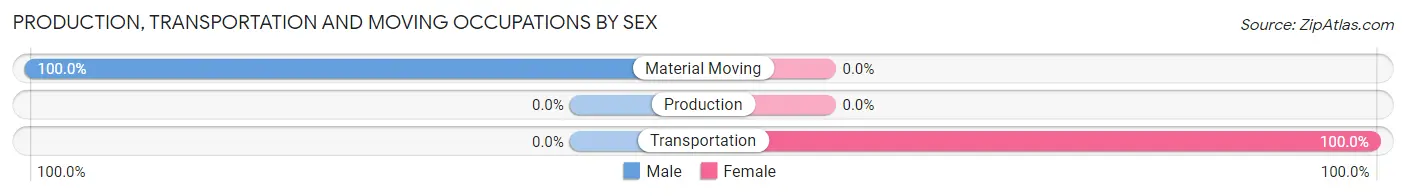
| Occupation | Male | Female |
| Production | 0 (0.0%) | 0 (0.0%) |
| Transportation | 0 (0.0%) | 4 (100.0%) |
| Material Moving | 2 (100.0%) | 0 (0.0%) |
| Total (Category) | 2 (33.3%) | 4 (66.7%) |
| Total (Overall) | 7 (41.2%) | 10 (58.8%) |
Employment Industries by Sex in Twin Lakes
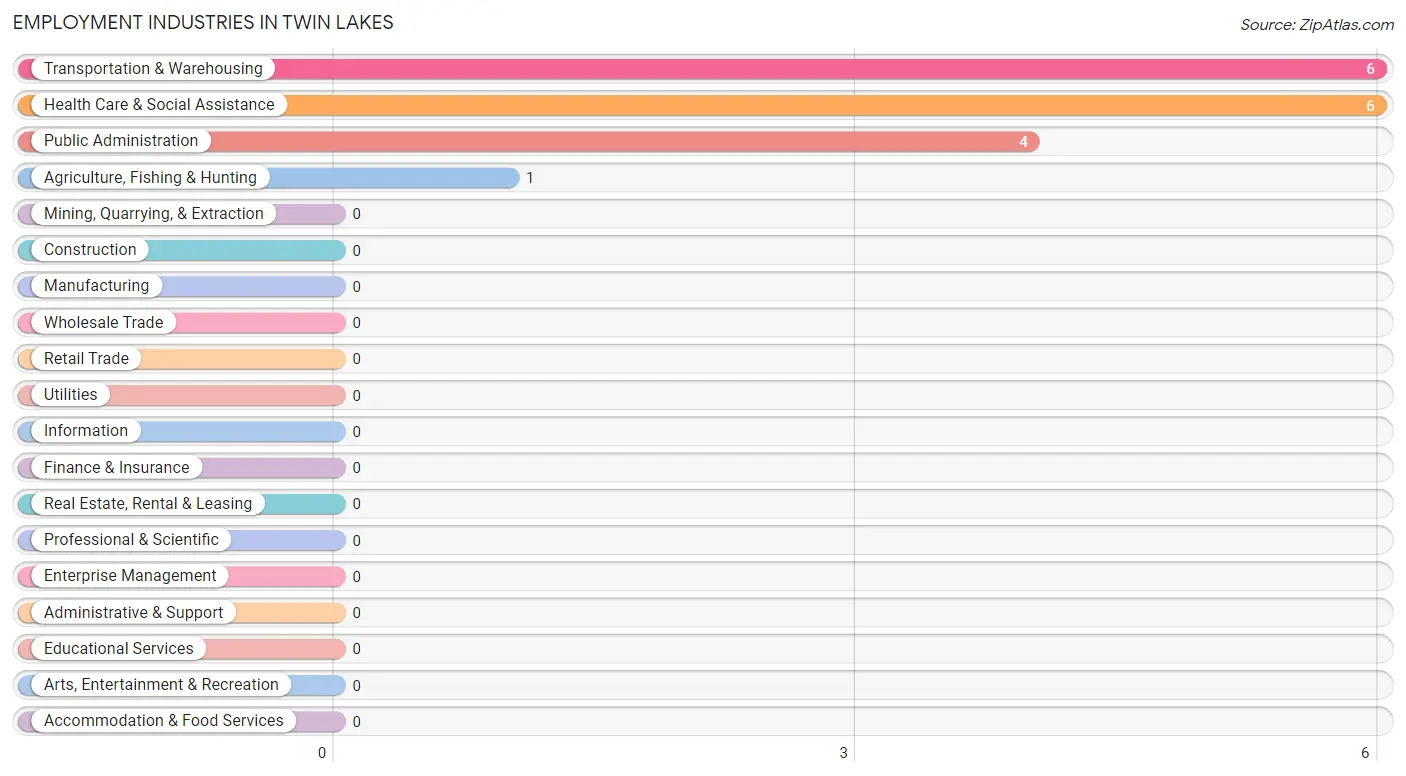
Employment Industries in Twin Lakes
The major employment industries in Twin Lakes include Transportation & Warehousing (6 | 35.3%), Health Care & Social Assistance (6 | 35.3%), Public Administration (4 | 23.5%), and Agriculture, Fishing & Hunting (1 | 5.9%).
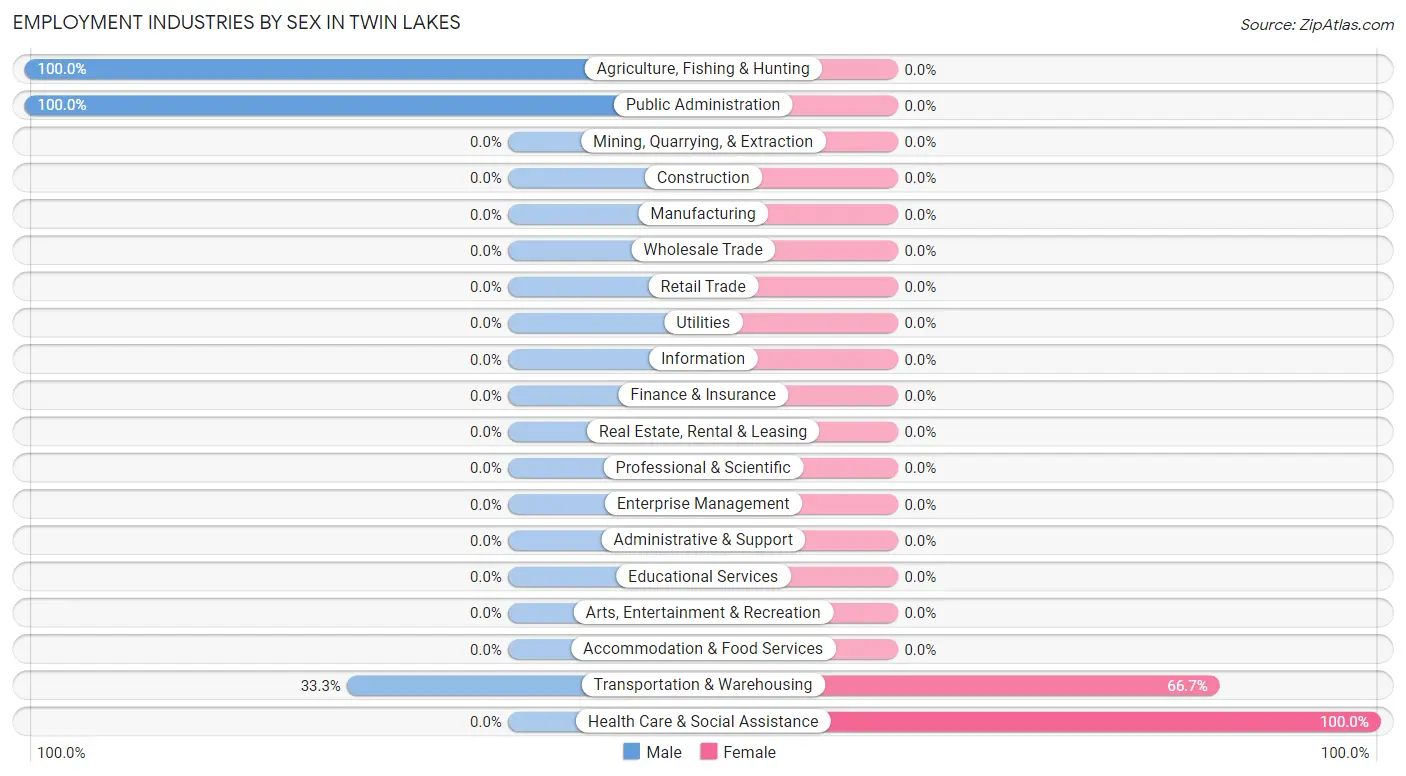
Employment Industries by Sex in Twin Lakes
The Twin Lakes industries that see more men than women are Agriculture, Fishing & Hunting (100.0%), Public Administration (100.0%), and Transportation & Warehousing (33.3%), whereas the industries that tend to have a higher number of women are Health Care & Social Assistance (100.0%), and Transportation & Warehousing (66.7%).
| Industry | Male | Female |
| Agriculture, Fishing & Hunting | 1 (100.0%) | 0 (0.0%) |
| Mining, Quarrying, & Extraction | 0 (0.0%) | 0 (0.0%) |
| Construction | 0 (0.0%) | 0 (0.0%) |
| Manufacturing | 0 (0.0%) | 0 (0.0%) |
| Wholesale Trade | 0 (0.0%) | 0 (0.0%) |
| Retail Trade | 0 (0.0%) | 0 (0.0%) |
| Transportation & Warehousing | 2 (33.3%) | 4 (66.7%) |
| Utilities | 0 (0.0%) | 0 (0.0%) |
| Information | 0 (0.0%) | 0 (0.0%) |
| Finance & Insurance | 0 (0.0%) | 0 (0.0%) |
| Real Estate, Rental & Leasing | 0 (0.0%) | 0 (0.0%) |
| Professional & Scientific | 0 (0.0%) | 0 (0.0%) |
| Enterprise Management | 0 (0.0%) | 0 (0.0%) |
| Administrative & Support | 0 (0.0%) | 0 (0.0%) |
| Educational Services | 0 (0.0%) | 0 (0.0%) |
| Health Care & Social Assistance | 0 (0.0%) | 6 (100.0%) |
| Arts, Entertainment & Recreation | 0 (0.0%) | 0 (0.0%) |
| Accommodation & Food Services | 0 (0.0%) | 0 (0.0%) |
| Public Administration | 4 (100.0%) | 0 (0.0%) |
| Total | 7 (41.2%) | 10 (58.8%) |
Education in Twin Lakes
School Enrollment in Twin Lakes
The most common levels of schooling among the 18 students in Twin Lakes are high school (13 | 72.2%), middle school (3 | 16.7%), and elementary school (2 | 11.1%).
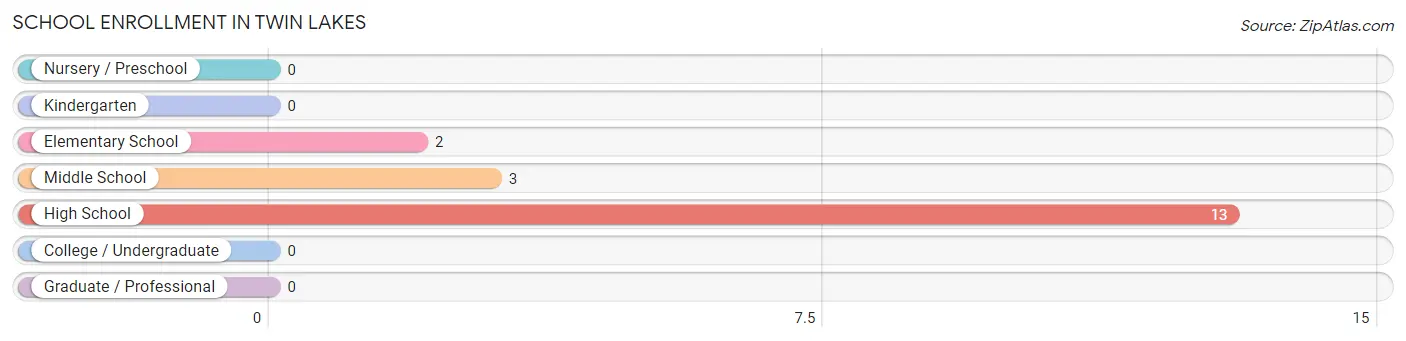
| School Level | # Students | % Students |
| Nursery / Preschool | 0 | 0.0% |
| Kindergarten | 0 | 0.0% |
| Elementary School | 2 | 11.1% |
| Middle School | 3 | 16.7% |
| High School | 13 | 72.2% |
| College / Undergraduate | 0 | 0.0% |
| Graduate / Professional | 0 | 0.0% |
| Total | 18 | 100.0% |
School Enrollment by Age by Funding Source in Twin Lakes
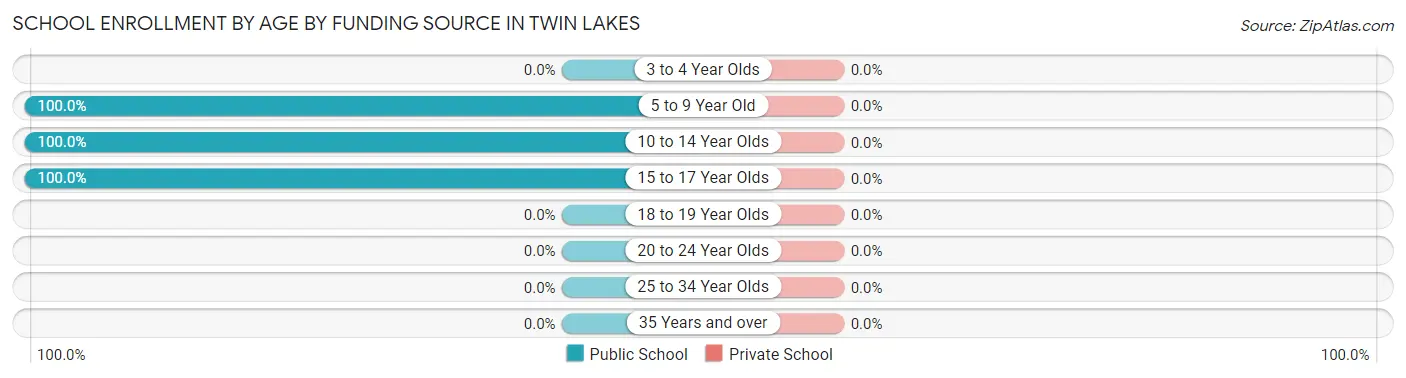
| Age Bracket | Public School | Private School |
| 3 to 4 Year Olds | 0 (0.0%) | 0 (0.0%) |
| 5 to 9 Year Old | 2 (100.0%) | 0 (0.0%) |
| 10 to 14 Year Olds | 3 (100.0%) | 0 (0.0%) |
| 15 to 17 Year Olds | 13 (100.0%) | 0 (0.0%) |
| 18 to 19 Year Olds | 0 (0.0%) | 0 (0.0%) |
| 20 to 24 Year Olds | 0 (0.0%) | 0 (0.0%) |
| 25 to 34 Year Olds | 0 (0.0%) | 0 (0.0%) |
| 35 Years and over | 0 (0.0%) | 0 (0.0%) |
| Total | 18 (100.0%) | 0 (0.0%) |
Educational Attainment by Field of Study in Twin Lakes
Education (5 | 55.6%), and literature & languages (4 | 44.4%) are the most common fields of study among 9 individuals in Twin Lakes who have obtained a bachelor's degree or higher.
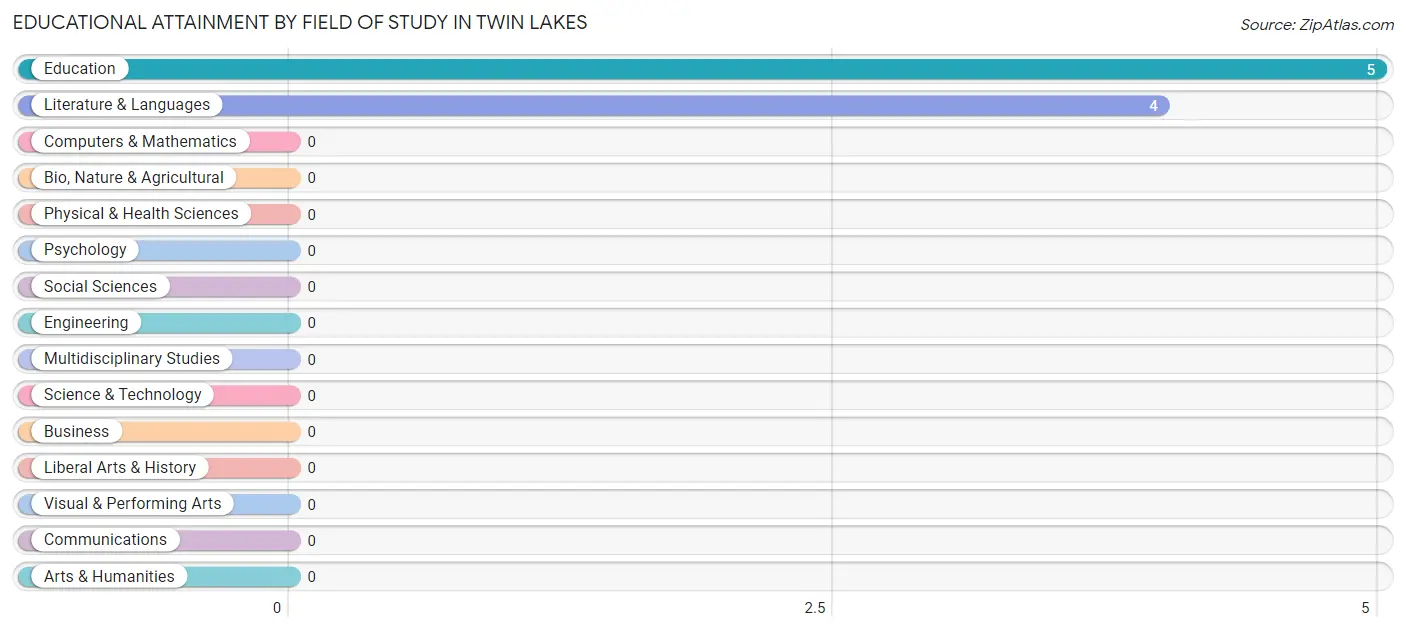
| Field of Study | # Graduates | % Graduates |
| Computers & Mathematics | 0 | 0.0% |
| Bio, Nature & Agricultural | 0 | 0.0% |
| Physical & Health Sciences | 0 | 0.0% |
| Psychology | 0 | 0.0% |
| Social Sciences | 0 | 0.0% |
| Engineering | 0 | 0.0% |
| Multidisciplinary Studies | 0 | 0.0% |
| Science & Technology | 0 | 0.0% |
| Business | 0 | 0.0% |
| Education | 5 | 55.6% |
| Literature & Languages | 4 | 44.4% |
| Liberal Arts & History | 0 | 0.0% |
| Visual & Performing Arts | 0 | 0.0% |
| Communications | 0 | 0.0% |
| Arts & Humanities | 0 | 0.0% |
| Total | 9 | 100.0% |
Transportation & Commute in Twin Lakes
Vehicle Availability by Sex in Twin Lakes
The most prevalent vehicle ownership categories in Twin Lakes are males with 5 or more vehicles (4, accounting for 57.1%) and females with 5 or more vehicles (6, making up 40.0%).
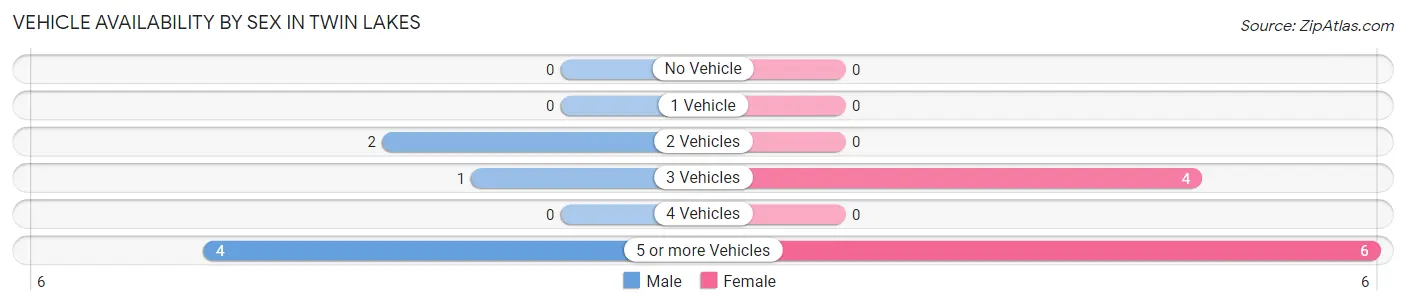
| Vehicles Available | Male | Female |
| No Vehicle | 0 (0.0%) | 0 (0.0%) |
| 1 Vehicle | 0 (0.0%) | 0 (0.0%) |
| 2 Vehicles | 2 (28.6%) | 0 (0.0%) |
| 3 Vehicles | 1 (14.3%) | 4 (40.0%) |
| 4 Vehicles | 0 (0.0%) | 0 (0.0%) |
| 5 or more Vehicles | 4 (57.1%) | 6 (60.0%) |
| Total | 7 (100.0%) | 10 (100.0%) |
Commute Time in Twin Lakes
The most frequently occuring commute durations in Twin Lakes are 10 to 14 minutes (6 commuters, 35.3%), less than 5 minutes (4 commuters, 23.5%), and 45 to 59 minutes (4 commuters, 23.5%).
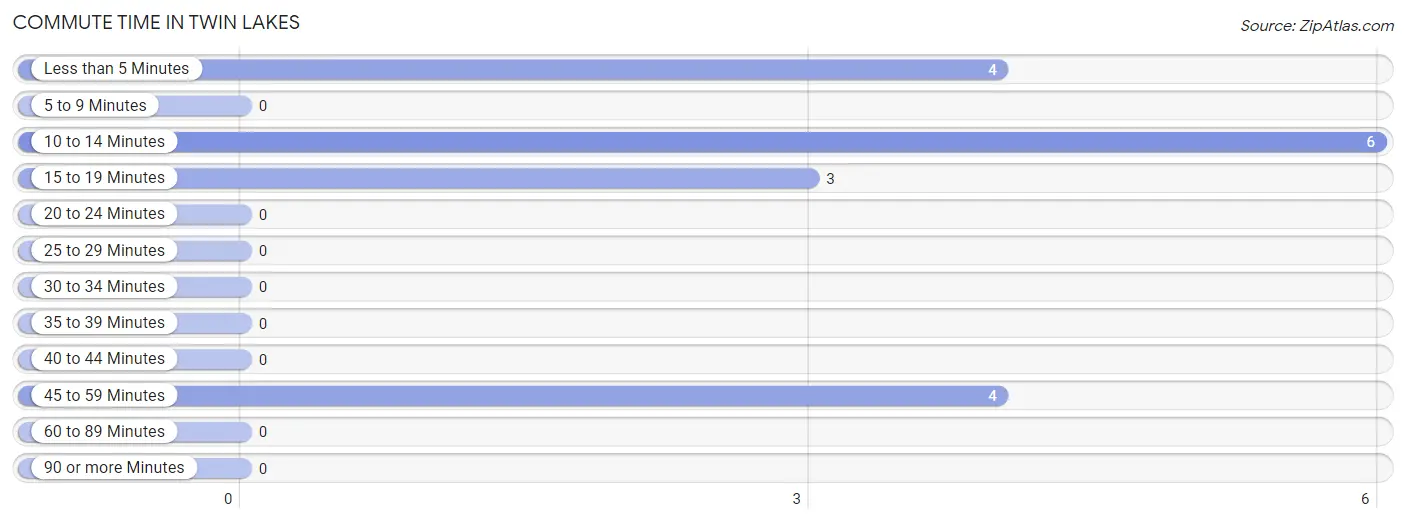
| Commute Time | # Commuters | % Commuters |
| Less than 5 Minutes | 4 | 23.5% |
| 5 to 9 Minutes | 0 | 0.0% |
| 10 to 14 Minutes | 6 | 35.3% |
| 15 to 19 Minutes | 3 | 17.6% |
| 20 to 24 Minutes | 0 | 0.0% |
| 25 to 29 Minutes | 0 | 0.0% |
| 30 to 34 Minutes | 0 | 0.0% |
| 35 to 39 Minutes | 0 | 0.0% |
| 40 to 44 Minutes | 0 | 0.0% |
| 45 to 59 Minutes | 4 | 23.5% |
| 60 to 89 Minutes | 0 | 0.0% |
| 90 or more Minutes | 0 | 0.0% |
Commute Time by Sex in Twin Lakes
The most common commute times in Twin Lakes are 45 to 59 minutes (4 commuters, 57.1%) for males and less than 5 minutes (4 commuters, 40.0%) for females.
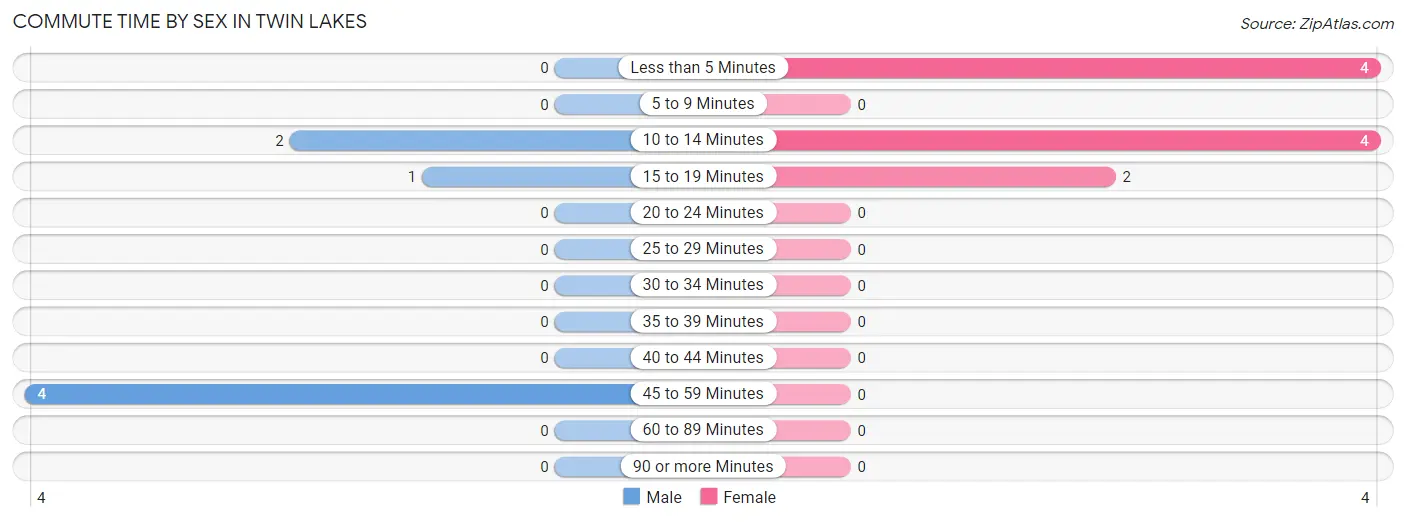
| Commute Time | Male | Female |
| Less than 5 Minutes | 0 (0.0%) | 4 (40.0%) |
| 5 to 9 Minutes | 0 (0.0%) | 0 (0.0%) |
| 10 to 14 Minutes | 2 (28.6%) | 4 (40.0%) |
| 15 to 19 Minutes | 1 (14.3%) | 2 (20.0%) |
| 20 to 24 Minutes | 0 (0.0%) | 0 (0.0%) |
| 25 to 29 Minutes | 0 (0.0%) | 0 (0.0%) |
| 30 to 34 Minutes | 0 (0.0%) | 0 (0.0%) |
| 35 to 39 Minutes | 0 (0.0%) | 0 (0.0%) |
| 40 to 44 Minutes | 0 (0.0%) | 0 (0.0%) |
| 45 to 59 Minutes | 4 (57.1%) | 0 (0.0%) |
| 60 to 89 Minutes | 0 (0.0%) | 0 (0.0%) |
| 90 or more Minutes | 0 (0.0%) | 0 (0.0%) |
Time of Departure to Work by Sex in Twin Lakes
The most frequent times of departure to work in Twin Lakes are 6:30 AM to 6:59 AM (5, 71.4%) for males and 5:30 AM to 5:59 AM (4, 40.0%) for females.
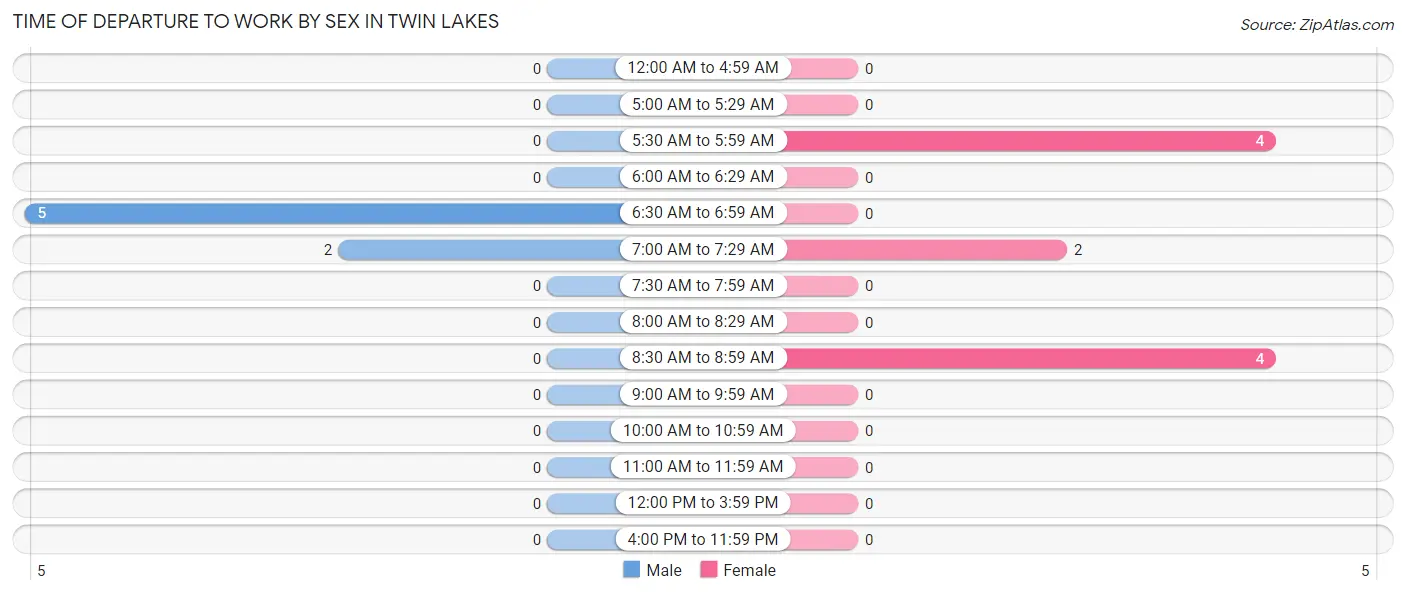
| Time of Departure | Male | Female |
| 12:00 AM to 4:59 AM | 0 (0.0%) | 0 (0.0%) |
| 5:00 AM to 5:29 AM | 0 (0.0%) | 0 (0.0%) |
| 5:30 AM to 5:59 AM | 0 (0.0%) | 4 (40.0%) |
| 6:00 AM to 6:29 AM | 0 (0.0%) | 0 (0.0%) |
| 6:30 AM to 6:59 AM | 5 (71.4%) | 0 (0.0%) |
| 7:00 AM to 7:29 AM | 2 (28.6%) | 2 (20.0%) |
| 7:30 AM to 7:59 AM | 0 (0.0%) | 0 (0.0%) |
| 8:00 AM to 8:29 AM | 0 (0.0%) | 0 (0.0%) |
| 8:30 AM to 8:59 AM | 0 (0.0%) | 4 (40.0%) |
| 9:00 AM to 9:59 AM | 0 (0.0%) | 0 (0.0%) |
| 10:00 AM to 10:59 AM | 0 (0.0%) | 0 (0.0%) |
| 11:00 AM to 11:59 AM | 0 (0.0%) | 0 (0.0%) |
| 12:00 PM to 3:59 PM | 0 (0.0%) | 0 (0.0%) |
| 4:00 PM to 11:59 PM | 0 (0.0%) | 0 (0.0%) |
| Total | 7 (100.0%) | 10 (100.0%) |
Housing Occupancy in Twin Lakes
Occupancy by Ownership in Twin Lakes
Of the total 32 dwellings in Twin Lakes, owner-occupied units account for 28 (87.5%), while renter-occupied units make up 4 (12.5%).
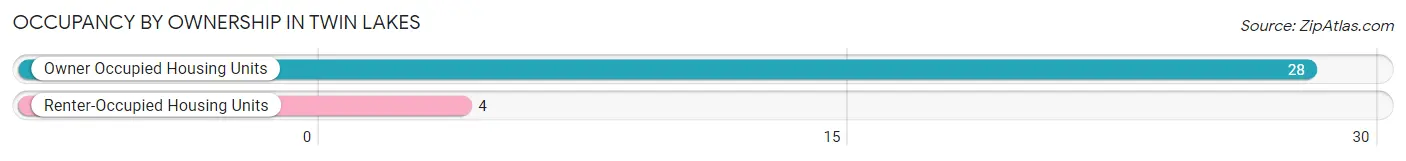
| Occupancy | # Housing Units | % Housing Units |
| Owner Occupied Housing Units | 28 | 87.5% |
| Renter-Occupied Housing Units | 4 | 12.5% |
| Total Occupied Housing Units | 32 | 100.0% |
Occupancy by Household Size in Twin Lakes
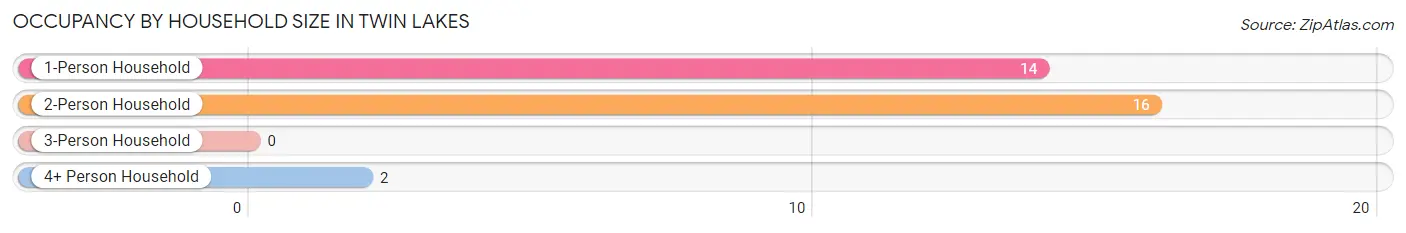
| Household Size | # Housing Units | % Housing Units |
| 1-Person Household | 14 | 43.8% |
| 2-Person Household | 16 | 50.0% |
| 3-Person Household | 0 | 0.0% |
| 4+ Person Household | 2 | 6.2% |
| Total Housing Units | 32 | 100.0% |
Occupancy by Ownership by Household Size in Twin Lakes
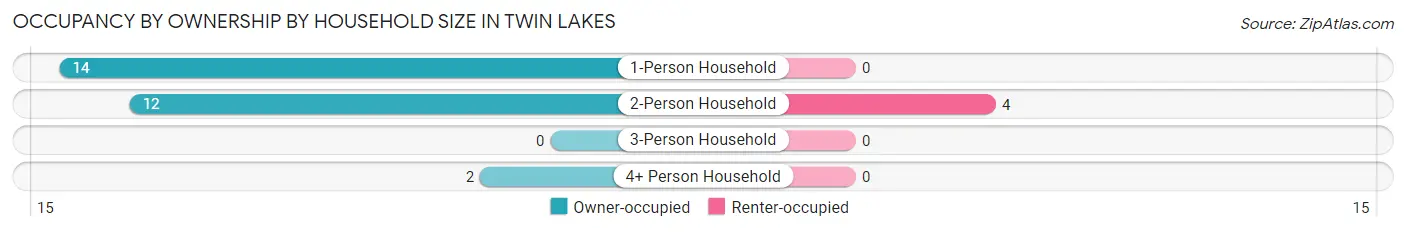
| Household Size | Owner-occupied | Renter-occupied |
| 1-Person Household | 14 (100.0%) | 0 (0.0%) |
| 2-Person Household | 12 (75.0%) | 4 (25.0%) |
| 3-Person Household | 0 (0.0%) | 0 (0.0%) |
| 4+ Person Household | 2 (100.0%) | 0 (0.0%) |
| Total Housing Units | 28 (87.5%) | 4 (12.5%) |
Occupancy by Educational Attainment in Twin Lakes
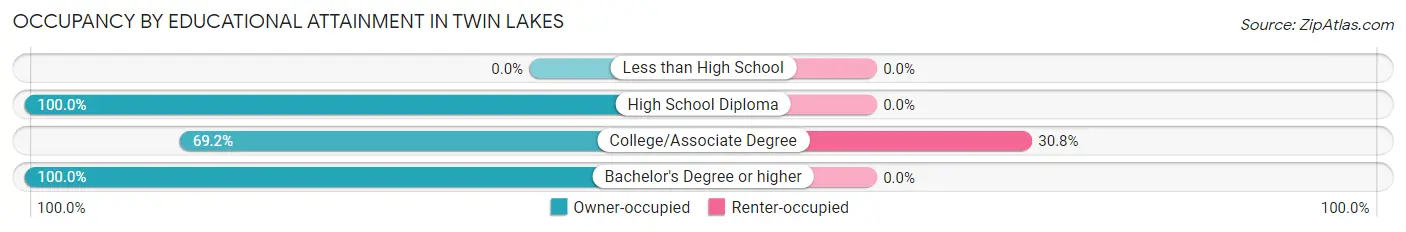
| Household Size | Owner-occupied | Renter-occupied |
| Less than High School | 0 (0.0%) | 0 (0.0%) |
| High School Diploma | 14 (100.0%) | 0 (0.0%) |
| College/Associate Degree | 9 (69.2%) | 4 (30.8%) |
| Bachelor's Degree or higher | 5 (100.0%) | 0 (0.0%) |
Occupancy by Age of Householder in Twin Lakes
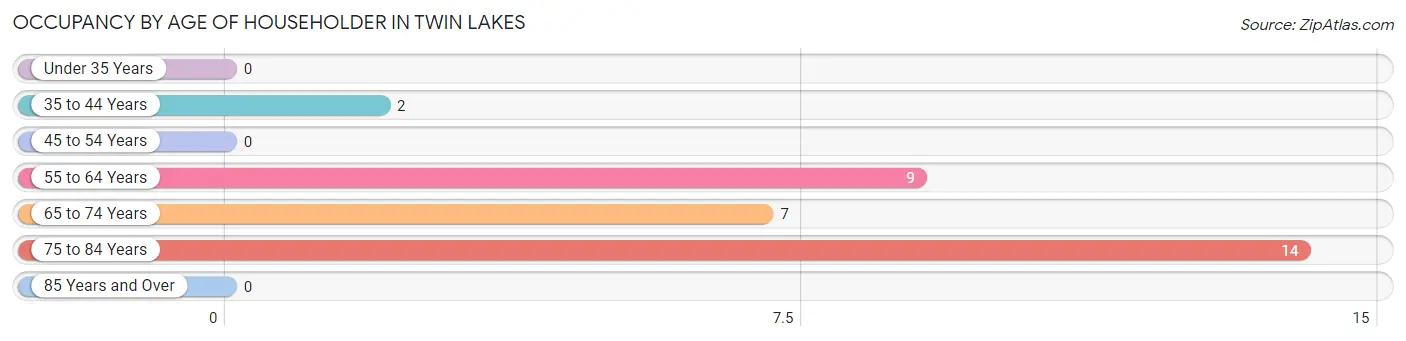
| Age Bracket | # Households | % Households |
| Under 35 Years | 0 | 0.0% |
| 35 to 44 Years | 2 | 6.2% |
| 45 to 54 Years | 0 | 0.0% |
| 55 to 64 Years | 9 | 28.1% |
| 65 to 74 Years | 7 | 21.9% |
| 75 to 84 Years | 14 | 43.8% |
| 85 Years and Over | 0 | 0.0% |
| Total | 32 | 100.0% |
Housing Finances in Twin Lakes
Median Income by Occupancy in Twin Lakes
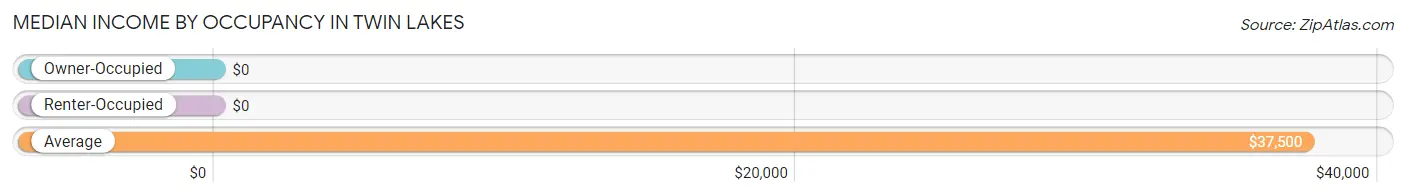
| Occupancy Type | # Households | Median Income |
| Owner-Occupied | 28 (87.5%) | $0 |
| Renter-Occupied | 4 (12.5%) | $0 |
| Average | 32 (100.0%) | $37,500 |
Occupancy by Householder Income Bracket in Twin Lakes
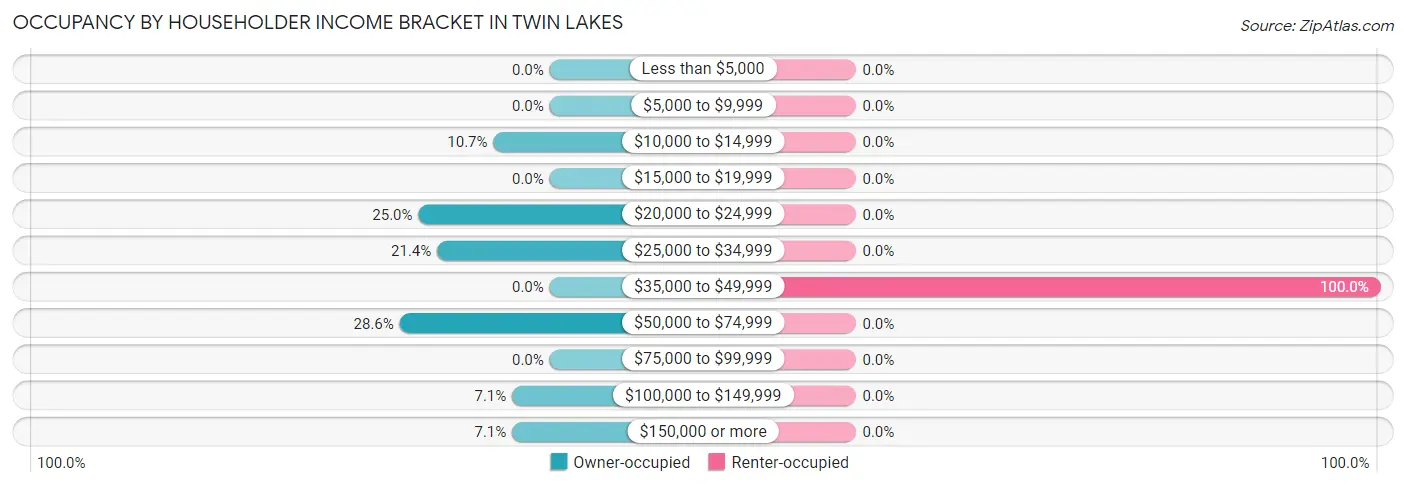
| Income Bracket | Owner-occupied | Renter-occupied |
| Less than $5,000 | 0 (0.0%) | 0 (0.0%) |
| $5,000 to $9,999 | 0 (0.0%) | 0 (0.0%) |
| $10,000 to $14,999 | 3 (10.7%) | 0 (0.0%) |
| $15,000 to $19,999 | 0 (0.0%) | 0 (0.0%) |
| $20,000 to $24,999 | 7 (25.0%) | 0 (0.0%) |
| $25,000 to $34,999 | 6 (21.4%) | 0 (0.0%) |
| $35,000 to $49,999 | 0 (0.0%) | 4 (100.0%) |
| $50,000 to $74,999 | 8 (28.6%) | 0 (0.0%) |
| $75,000 to $99,999 | 0 (0.0%) | 0 (0.0%) |
| $100,000 to $149,999 | 2 (7.1%) | 0 (0.0%) |
| $150,000 or more | 2 (7.1%) | 0 (0.0%) |
| Total | 28 (100.0%) | 4 (100.0%) |
Monthly Housing Cost Tiers in Twin Lakes
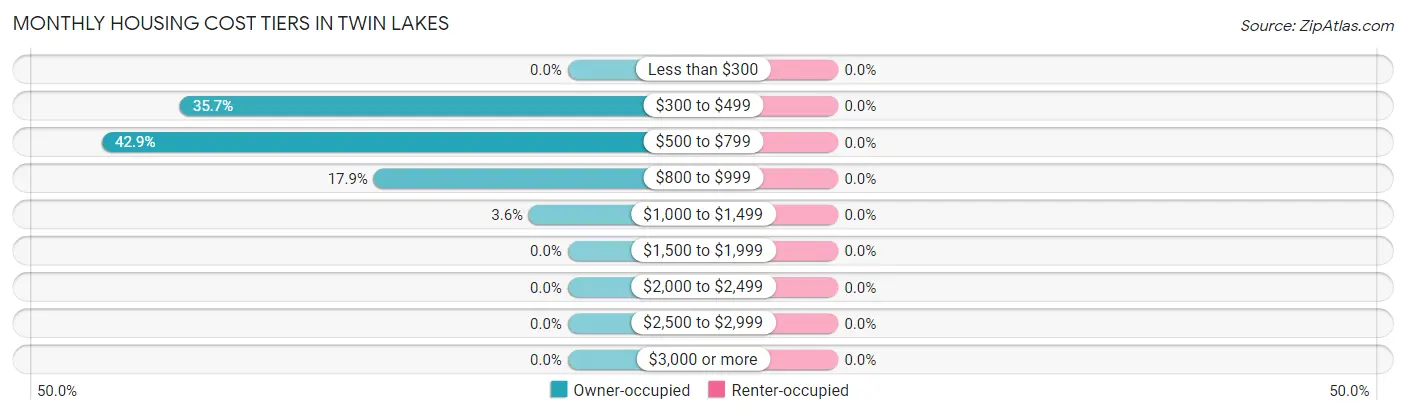
| Monthly Cost | Owner-occupied | Renter-occupied |
| Less than $300 | 0 (0.0%) | 0 (0.0%) |
| $300 to $499 | 10 (35.7%) | 0 (0.0%) |
| $500 to $799 | 12 (42.9%) | 0 (0.0%) |
| $800 to $999 | 5 (17.9%) | 0 (0.0%) |
| $1,000 to $1,499 | 1 (3.6%) | 0 (0.0%) |
| $1,500 to $1,999 | 0 (0.0%) | 0 (0.0%) |
| $2,000 to $2,499 | 0 (0.0%) | 0 (0.0%) |
| $2,500 to $2,999 | 0 (0.0%) | 0 (0.0%) |
| $3,000 or more | 0 (0.0%) | 0 (0.0%) |
| Total | 28 (100.0%) | 4 (100.0%) |
Physical Housing Characteristics in Twin Lakes
Housing Structures in Twin Lakes
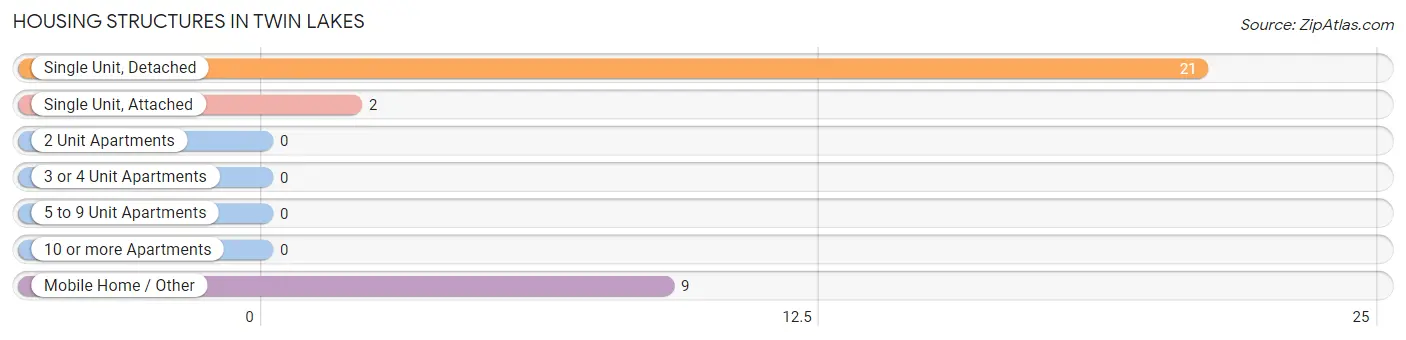
| Structure Type | # Housing Units | % Housing Units |
| Single Unit, Detached | 21 | 65.6% |
| Single Unit, Attached | 2 | 6.2% |
| 2 Unit Apartments | 0 | 0.0% |
| 3 or 4 Unit Apartments | 0 | 0.0% |
| 5 to 9 Unit Apartments | 0 | 0.0% |
| 10 or more Apartments | 0 | 0.0% |
| Mobile Home / Other | 9 | 28.1% |
| Total | 32 | 100.0% |
Housing Structures by Occupancy in Twin Lakes
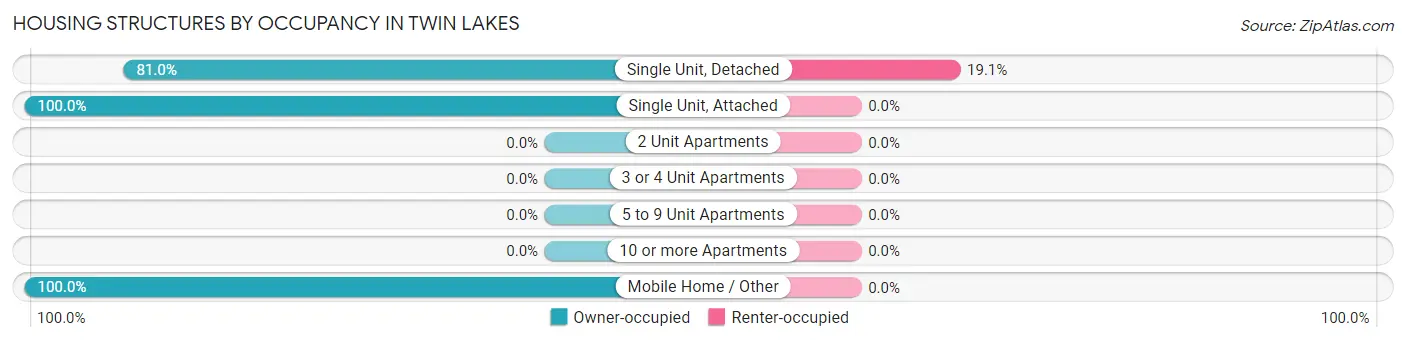
| Structure Type | Owner-occupied | Renter-occupied |
| Single Unit, Detached | 17 (80.9%) | 4 (19.1%) |
| Single Unit, Attached | 2 (100.0%) | 0 (0.0%) |
| 2 Unit Apartments | 0 (0.0%) | 0 (0.0%) |
| 3 or 4 Unit Apartments | 0 (0.0%) | 0 (0.0%) |
| 5 to 9 Unit Apartments | 0 (0.0%) | 0 (0.0%) |
| 10 or more Apartments | 0 (0.0%) | 0 (0.0%) |
| Mobile Home / Other | 9 (100.0%) | 0 (0.0%) |
| Total | 28 (87.5%) | 4 (12.5%) |
Housing Structures by Number of Rooms in Twin Lakes
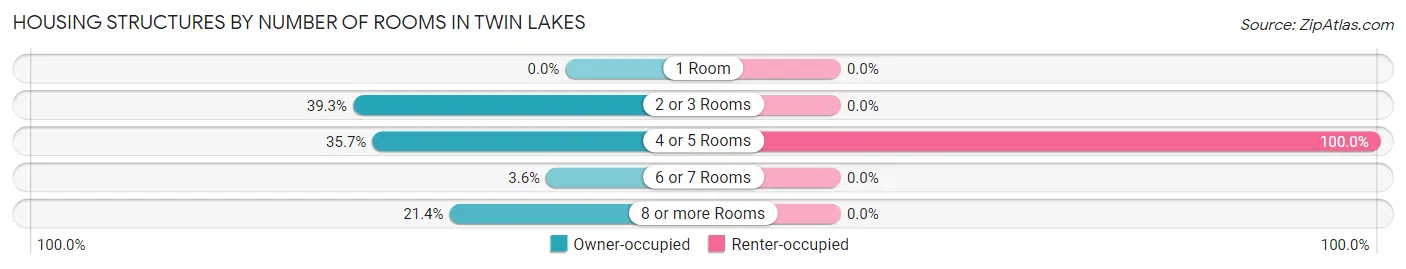
| Number of Rooms | Owner-occupied | Renter-occupied |
| 1 Room | 0 (0.0%) | 0 (0.0%) |
| 2 or 3 Rooms | 11 (39.3%) | 0 (0.0%) |
| 4 or 5 Rooms | 10 (35.7%) | 4 (100.0%) |
| 6 or 7 Rooms | 1 (3.6%) | 0 (0.0%) |
| 8 or more Rooms | 6 (21.4%) | 0 (0.0%) |
| Total | 28 (100.0%) | 4 (100.0%) |
Housing Structure by Heating Type in Twin Lakes
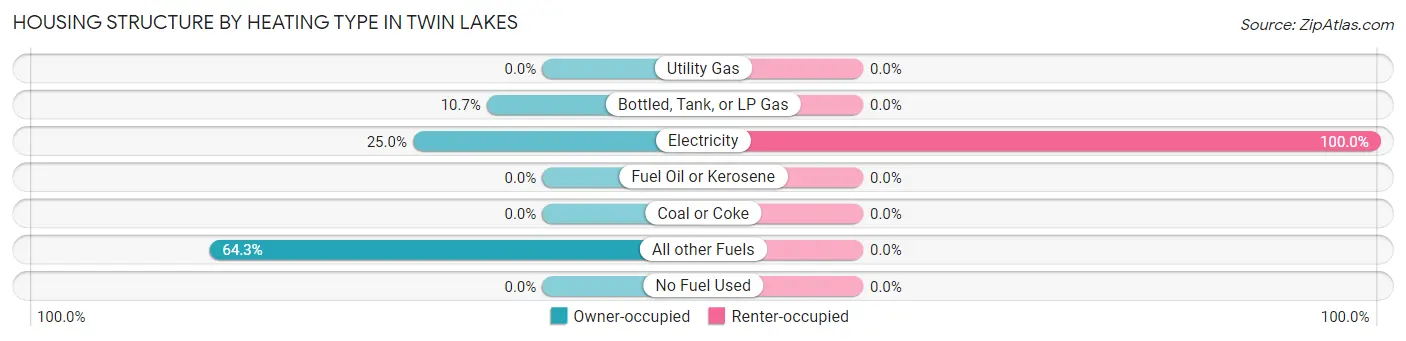
| Heating Type | Owner-occupied | Renter-occupied |
| Utility Gas | 0 (0.0%) | 0 (0.0%) |
| Bottled, Tank, or LP Gas | 3 (10.7%) | 0 (0.0%) |
| Electricity | 7 (25.0%) | 4 (100.0%) |
| Fuel Oil or Kerosene | 0 (0.0%) | 0 (0.0%) |
| Coal or Coke | 0 (0.0%) | 0 (0.0%) |
| All other Fuels | 18 (64.3%) | 0 (0.0%) |
| No Fuel Used | 0 (0.0%) | 0 (0.0%) |
| Total | 28 (100.0%) | 4 (100.0%) |
Household Vehicle Usage in Twin Lakes
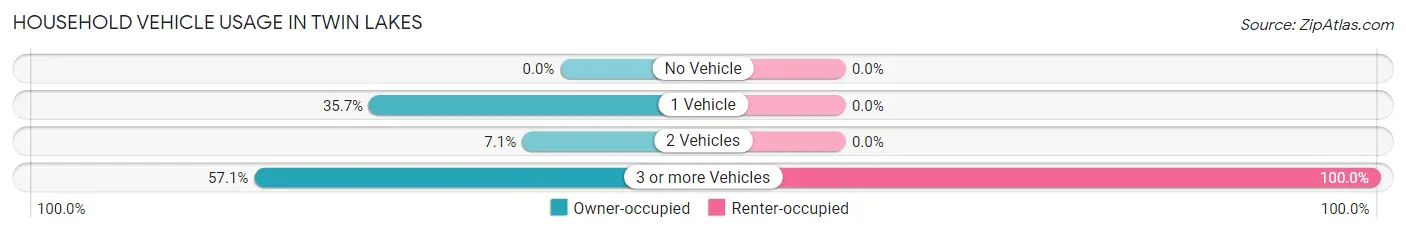
| Vehicles per Household | Owner-occupied | Renter-occupied |
| No Vehicle | 0 (0.0%) | 0 (0.0%) |
| 1 Vehicle | 10 (35.7%) | 0 (0.0%) |
| 2 Vehicles | 2 (7.1%) | 0 (0.0%) |
| 3 or more Vehicles | 16 (57.1%) | 4 (100.0%) |
| Total | 28 (100.0%) | 4 (100.0%) |
Real Estate & Mortgages in Twin Lakes
Real Estate and Mortgage Overview in Twin Lakes
| Characteristic | Without Mortgage | With Mortgage |
| Housing Units | 23 | 5 |
| Median Property Value | - | - |
| Median Household Income | - | - |
| Monthly Housing Costs | $550 | $0 |
| Real Estate Taxes | - | - |
Property Value by Mortgage Status in Twin Lakes
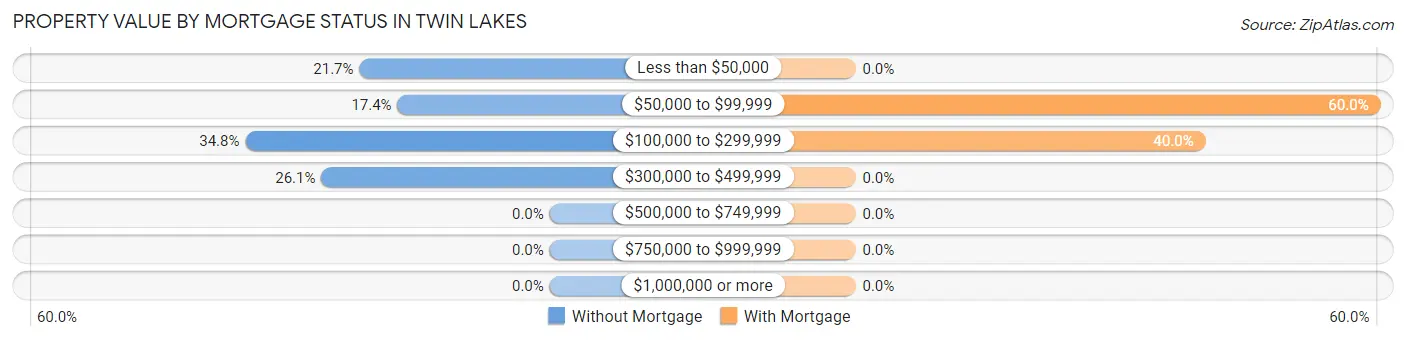
| Property Value | Without Mortgage | With Mortgage |
| Less than $50,000 | 5 (21.7%) | 0 (0.0%) |
| $50,000 to $99,999 | 4 (17.4%) | 3 (60.0%) |
| $100,000 to $299,999 | 8 (34.8%) | 2 (40.0%) |
| $300,000 to $499,999 | 6 (26.1%) | 0 (0.0%) |
| $500,000 to $749,999 | 0 (0.0%) | 0 (0.0%) |
| $750,000 to $999,999 | 0 (0.0%) | 0 (0.0%) |
| $1,000,000 or more | 0 (0.0%) | 0 (0.0%) |
| Total | 23 (100.0%) | 5 (100.0%) |
Household Income by Mortgage Status in Twin Lakes
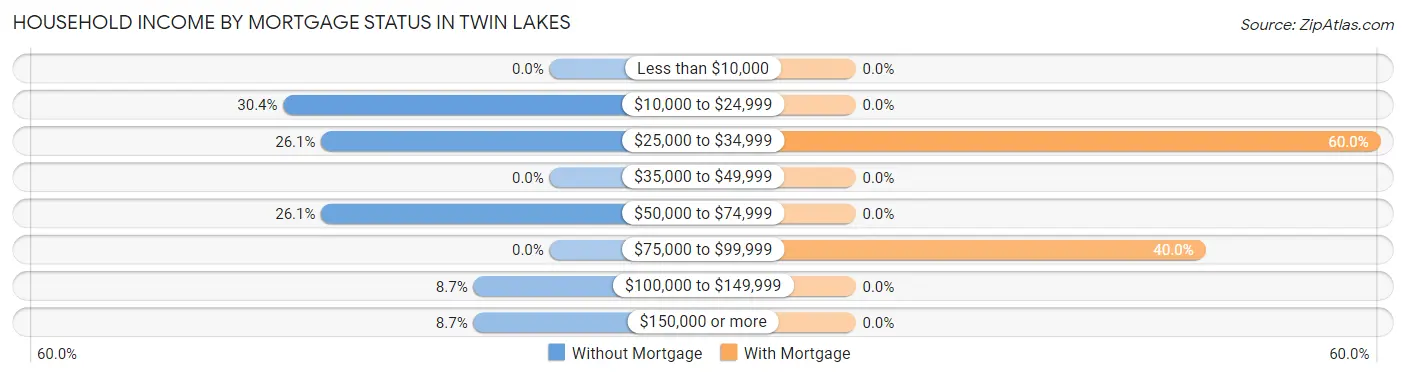
| Household Income | Without Mortgage | With Mortgage |
| Less than $10,000 | 0 (0.0%) | 0 (0.0%) |
| $10,000 to $24,999 | 7 (30.4%) | 0 (0.0%) |
| $25,000 to $34,999 | 6 (26.1%) | 3 (60.0%) |
| $35,000 to $49,999 | 0 (0.0%) | 0 (0.0%) |
| $50,000 to $74,999 | 6 (26.1%) | 0 (0.0%) |
| $75,000 to $99,999 | 0 (0.0%) | 2 (40.0%) |
| $100,000 to $149,999 | 2 (8.7%) | 0 (0.0%) |
| $150,000 or more | 2 (8.7%) | 0 (0.0%) |
| Total | 23 (100.0%) | 5 (100.0%) |
Property Value to Household Income Ratio in Twin Lakes
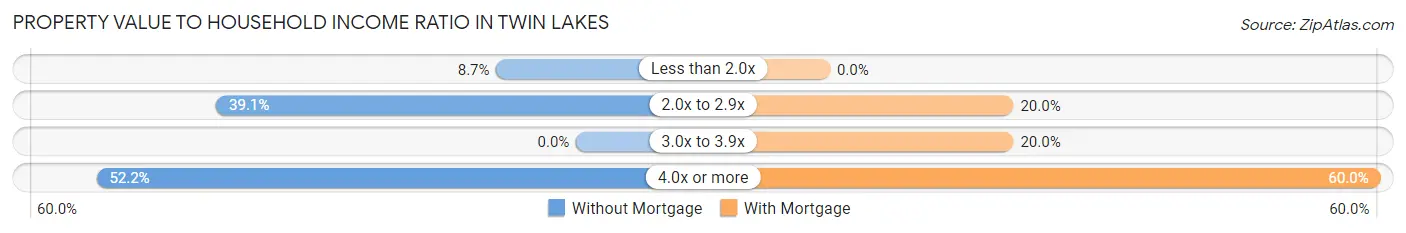
| Value-to-Income Ratio | Without Mortgage | With Mortgage |
| Less than 2.0x | 2 (8.7%) | 0 (0.0%) |
| 2.0x to 2.9x | 9 (39.1%) | 1 (20.0%) |
| 3.0x to 3.9x | 0 (0.0%) | 1 (20.0%) |
| 4.0x or more | 12 (52.2%) | 3 (60.0%) |
| Total | 23 (100.0%) | 5 (100.0%) |
Real Estate Taxes by Mortgage Status in Twin Lakes
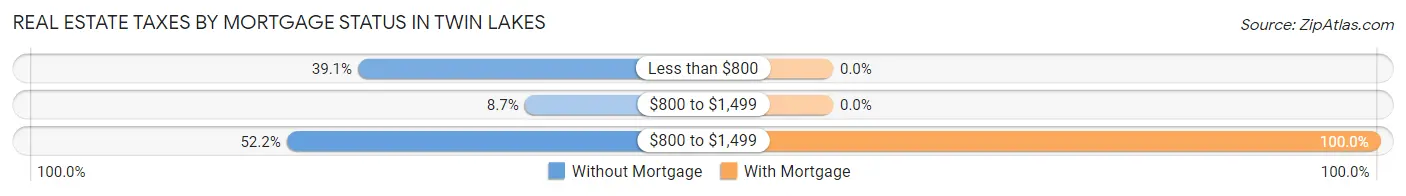
| Property Taxes | Without Mortgage | With Mortgage |
| Less than $800 | 9 (39.1%) | 0 (0.0%) |
| $800 to $1,499 | 2 (8.7%) | 0 (0.0%) |
| $800 to $1,499 | 12 (52.2%) | 5 (100.0%) |
| Total | 23 (100.0%) | 5 (100.0%) |
Health & Disability in Twin Lakes
Health Insurance Coverage by Age in Twin Lakes
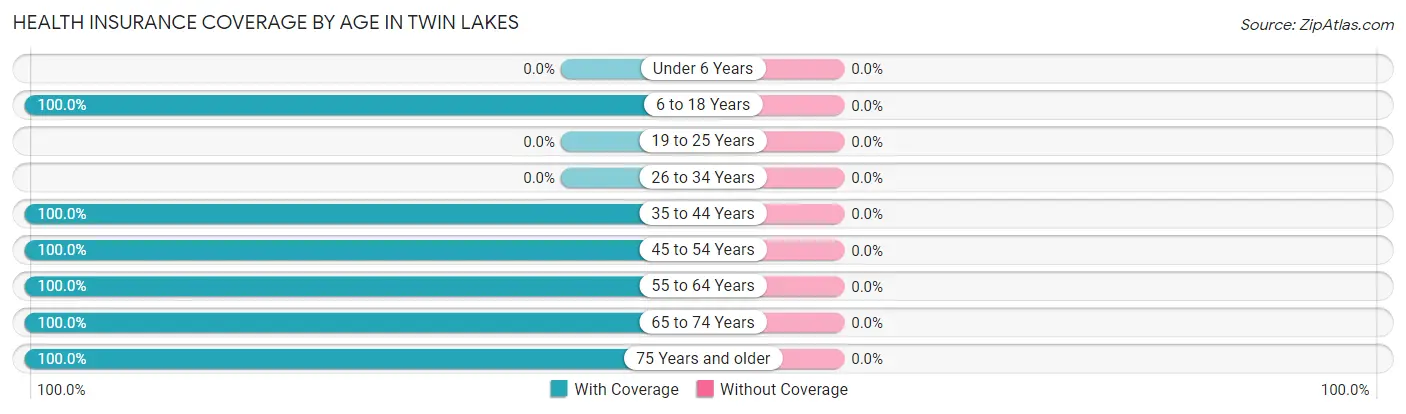
| Age Bracket | With Coverage | Without Coverage |
| Under 6 Years | 0 (0.0%) | 0 (0.0%) |
| 6 to 18 Years | 18 (100.0%) | 0 (0.0%) |
| 19 to 25 Years | 0 (0.0%) | 0 (0.0%) |
| 26 to 34 Years | 0 (0.0%) | 0 (0.0%) |
| 35 to 44 Years | 2 (100.0%) | 0 (0.0%) |
| 45 to 54 Years | 7 (100.0%) | 0 (0.0%) |
| 55 to 64 Years | 24 (100.0%) | 0 (0.0%) |
| 65 to 74 Years | 7 (100.0%) | 0 (0.0%) |
| 75 Years and older | 16 (100.0%) | 0 (0.0%) |
| Total | 74 (100.0%) | 0 (0.0%) |
Health Insurance Coverage by Citizenship Status in Twin Lakes
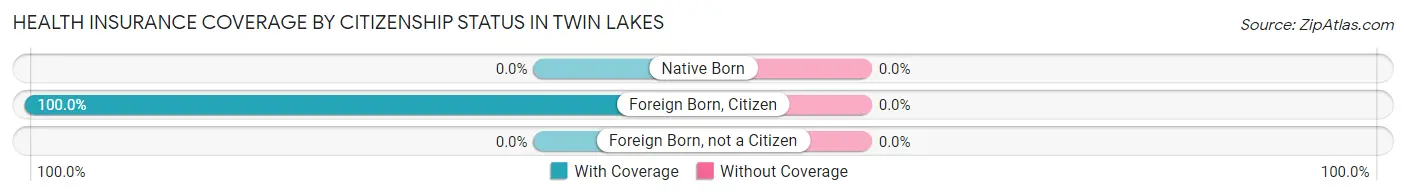
| Citizenship Status | With Coverage | Without Coverage |
| Native Born | 0 (0.0%) | 0 (0.0%) |
| Foreign Born, Citizen | 18 (100.0%) | 0 (0.0%) |
| Foreign Born, not a Citizen | 0 (0.0%) | 0 (0.0%) |
Health Insurance Coverage by Household Income in Twin Lakes
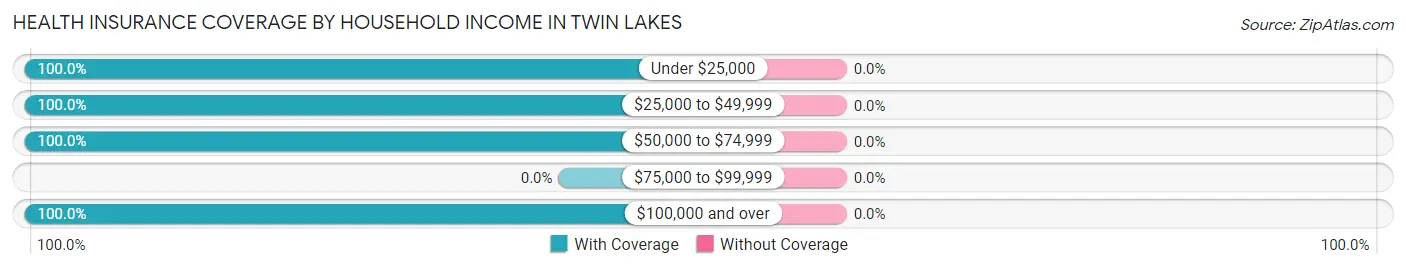
| Household Income | With Coverage | Without Coverage |
| Under $25,000 | 10 (100.0%) | 0 (0.0%) |
| $25,000 to $49,999 | 16 (100.0%) | 0 (0.0%) |
| $50,000 to $74,999 | 31 (100.0%) | 0 (0.0%) |
| $75,000 to $99,999 | 0 (0.0%) | 0 (0.0%) |
| $100,000 and over | 17 (100.0%) | 0 (0.0%) |
Public vs Private Health Insurance Coverage by Age in Twin Lakes
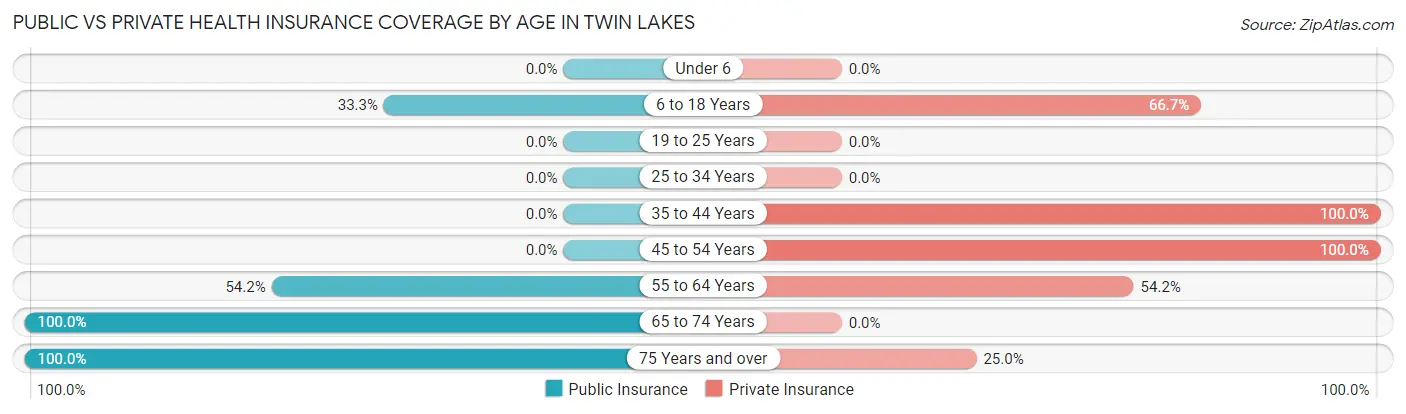
| Age Bracket | Public Insurance | Private Insurance |
| Under 6 | 0 (0.0%) | 0 (0.0%) |
| 6 to 18 Years | 6 (33.3%) | 12 (66.7%) |
| 19 to 25 Years | 0 (0.0%) | 0 (0.0%) |
| 25 to 34 Years | 0 (0.0%) | 0 (0.0%) |
| 35 to 44 Years | 0 (0.0%) | 2 (100.0%) |
| 45 to 54 Years | 0 (0.0%) | 7 (100.0%) |
| 55 to 64 Years | 13 (54.2%) | 13 (54.2%) |
| 65 to 74 Years | 7 (100.0%) | 0 (0.0%) |
| 75 Years and over | 16 (100.0%) | 4 (25.0%) |
| Total | 42 (56.8%) | 38 (51.3%) |
Disability Status by Sex by Age in Twin Lakes
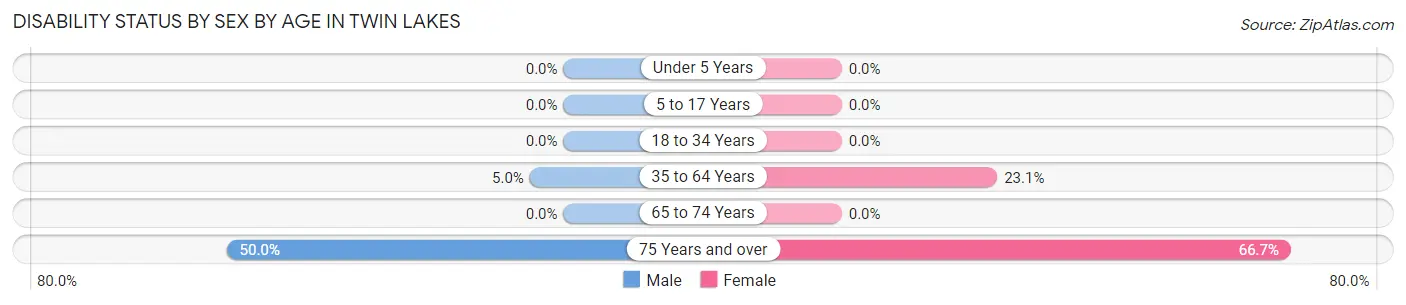
| Age Bracket | Male | Female |
| Under 5 Years | 0 (0.0%) | 0 (0.0%) |
| 5 to 17 Years | 0 (0.0%) | 0 (0.0%) |
| 18 to 34 Years | 0 (0.0%) | 0 (0.0%) |
| 35 to 64 Years | 1 (5.0%) | 3 (23.1%) |
| 65 to 74 Years | 0 (0.0%) | 0 (0.0%) |
| 75 Years and over | 5 (50.0%) | 4 (66.7%) |
Disability Class by Sex by Age in Twin Lakes
Disability Class: Hearing Difficulty
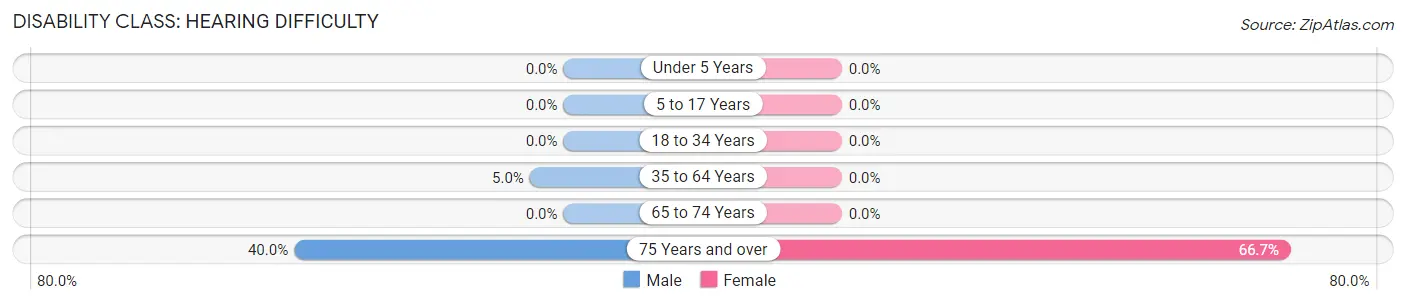
| Age Bracket | Male | Female |
| Under 5 Years | 0 (0.0%) | 0 (0.0%) |
| 5 to 17 Years | 0 (0.0%) | 0 (0.0%) |
| 18 to 34 Years | 0 (0.0%) | 0 (0.0%) |
| 35 to 64 Years | 1 (5.0%) | 0 (0.0%) |
| 65 to 74 Years | 0 (0.0%) | 0 (0.0%) |
| 75 Years and over | 4 (40.0%) | 4 (66.7%) |
Disability Class: Vision Difficulty
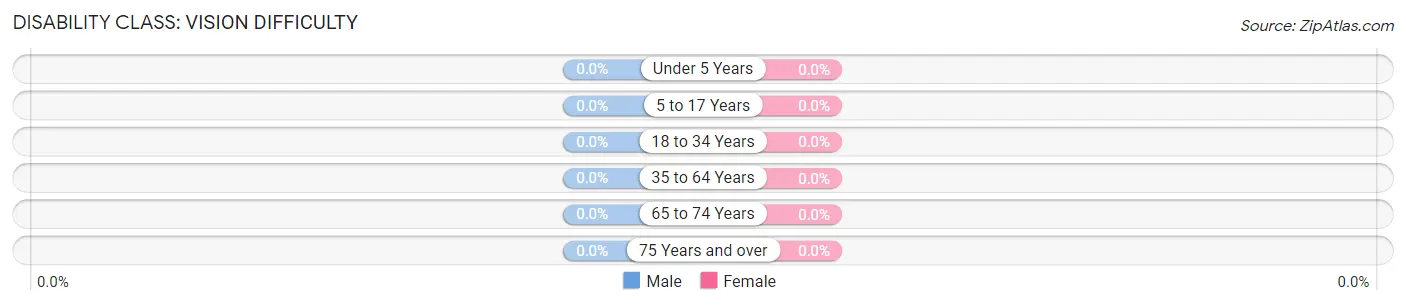
| Age Bracket | Male | Female |
| Under 5 Years | 0 (0.0%) | 0 (0.0%) |
| 5 to 17 Years | 0 (0.0%) | 0 (0.0%) |
| 18 to 34 Years | 0 (0.0%) | 0 (0.0%) |
| 35 to 64 Years | 0 (0.0%) | 0 (0.0%) |
| 65 to 74 Years | 0 (0.0%) | 0 (0.0%) |
| 75 Years and over | 0 (0.0%) | 0 (0.0%) |
Disability Class: Cognitive Difficulty
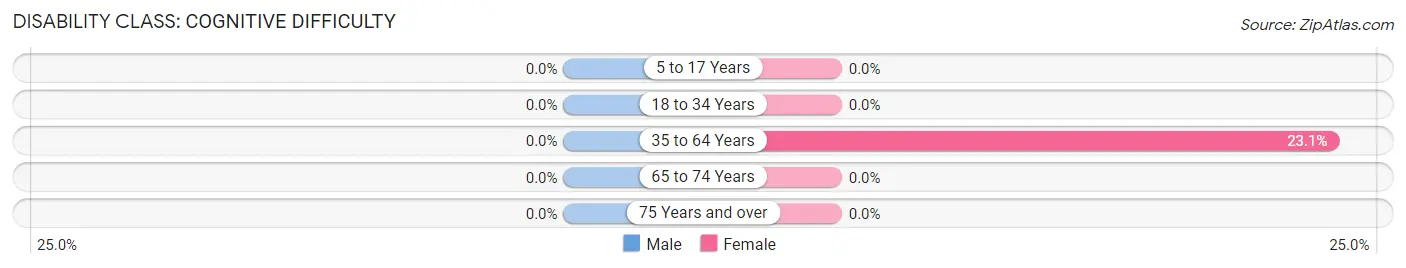
| Age Bracket | Male | Female |
| 5 to 17 Years | 0 (0.0%) | 0 (0.0%) |
| 18 to 34 Years | 0 (0.0%) | 0 (0.0%) |
| 35 to 64 Years | 0 (0.0%) | 3 (23.1%) |
| 65 to 74 Years | 0 (0.0%) | 0 (0.0%) |
| 75 Years and over | 0 (0.0%) | 0 (0.0%) |
Disability Class: Ambulatory Difficulty
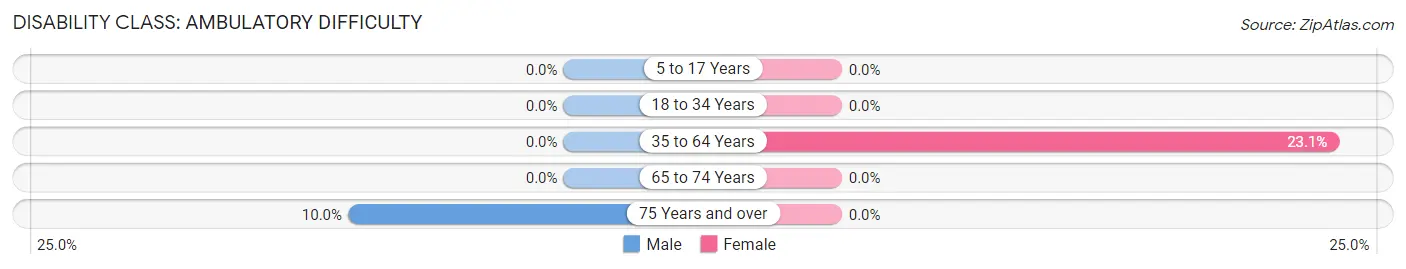
| Age Bracket | Male | Female |
| 5 to 17 Years | 0 (0.0%) | 0 (0.0%) |
| 18 to 34 Years | 0 (0.0%) | 0 (0.0%) |
| 35 to 64 Years | 0 (0.0%) | 3 (23.1%) |
| 65 to 74 Years | 0 (0.0%) | 0 (0.0%) |
| 75 Years and over | 1 (10.0%) | 0 (0.0%) |
Disability Class: Self-Care Difficulty
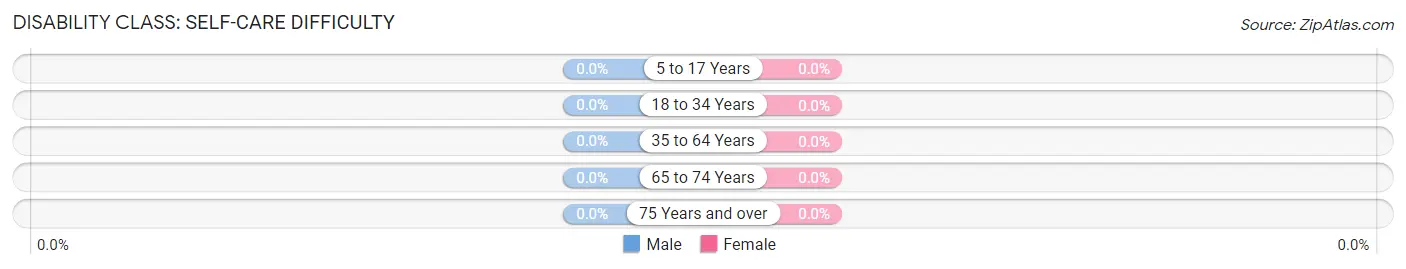
| Age Bracket | Male | Female |
| 5 to 17 Years | 0 (0.0%) | 0 (0.0%) |
| 18 to 34 Years | 0 (0.0%) | 0 (0.0%) |
| 35 to 64 Years | 0 (0.0%) | 0 (0.0%) |
| 65 to 74 Years | 0 (0.0%) | 0 (0.0%) |
| 75 Years and over | 0 (0.0%) | 0 (0.0%) |
Technology Access in Twin Lakes
Computing Device Access in Twin Lakes
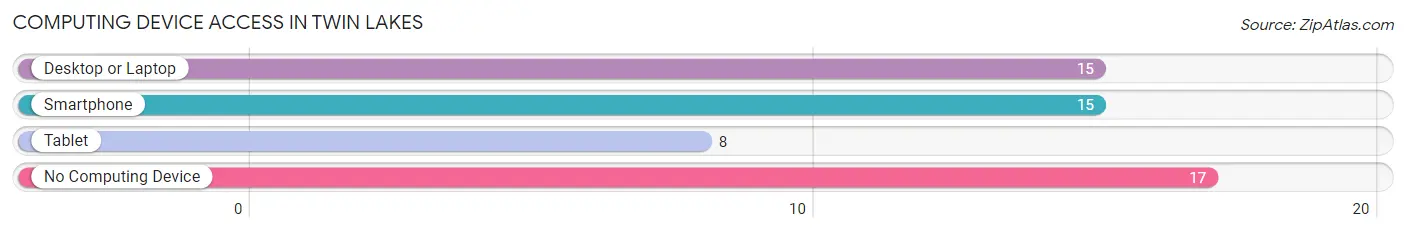
| Device Type | # Households | % Households |
| Desktop or Laptop | 15 | 46.9% |
| Smartphone | 15 | 46.9% |
| Tablet | 8 | 25.0% |
| No Computing Device | 17 | 53.1% |
| Total | 32 | 100.0% |
Internet Access in Twin Lakes
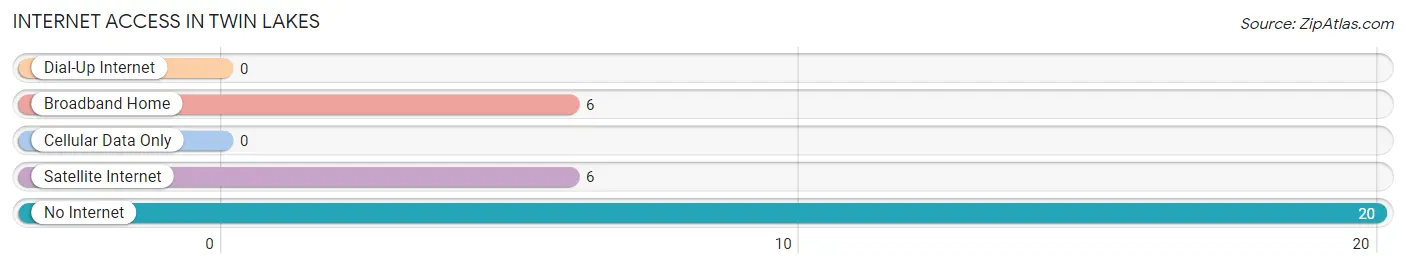
| Internet Type | # Households | % Households |
| Dial-Up Internet | 0 | 0.0% |
| Broadband Home | 6 | 18.8% |
| Cellular Data Only | 0 | 0.0% |
| Satellite Internet | 6 | 18.8% |
| No Internet | 20 | 62.5% |
| Total | 32 | 100.0% |
Twin Lakes Summary
Twin Lakes is a small unincorporated community located in the Cascade Mountains of King County, Washington. It is situated at the base of the Cascade Range, approximately 25 miles east of Seattle. The community is located in the foothills of the Cascade Mountains, and is surrounded by lush forests and pristine lakes.
History
Twin Lakes was first settled in the late 1800s by homesteaders who were drawn to the area by its natural beauty and abundant resources. The first settlers were mostly loggers and miners, who were attracted to the area for its timber and mineral resources. The first post office was established in 1891, and the community was officially incorporated in 1895.
The early settlers of Twin Lakes were mostly of Scandinavian descent, and the community was known for its strong sense of community and neighborly spirit. The town was also known for its logging and mining industries, which provided employment for many of the residents.
Geography
Twin Lakes is located in the foothills of the Cascade Mountains, approximately 25 miles east of Seattle. The community is situated at an elevation of 1,400 feet, and is surrounded by lush forests and pristine lakes. The area is known for its abundant wildlife, including deer, elk, bear, and cougar.
The climate in Twin Lakes is mild and temperate, with warm summers and cool winters. The average annual temperature is around 50 degrees Fahrenheit, and the average annual precipitation is around 40 inches.
Economy
The economy of Twin Lakes is largely based on tourism and recreation. The area is known for its natural beauty and abundant outdoor activities, including fishing, hiking, camping, and skiing. The community is also home to several small businesses, including restaurants, shops, and lodging.
Demographics
As of the 2010 census, the population of Twin Lakes was 1,845. The racial makeup of the community was 94.3% White, 0.7% African American, 0.3% Native American, 0.7% Asian, 0.1% Pacific Islander, and 3.0% from other races. The median household income was $50,000, and the median family income was $54,000.
Conclusion
Twin Lakes is a small unincorporated community located in the Cascade Mountains of King County, Washington. It is situated at the base of the Cascade Range, approximately 25 miles east of Seattle. The community is known for its natural beauty and abundant outdoor activities, and is home to a diverse population of residents. The economy of Twin Lakes is largely based on tourism and recreation, and the area is known for its strong sense of community and neighborly spirit.
Common Questions
What is Per Capita Income in Twin Lakes?
Per Capita income in Twin Lakes is $24,418.
What is the Median Family Income in Twin Lakes?
Median Family Income in Twin Lakes is $60,833.
What is the Median Household income in Twin Lakes?
Median Household Income in Twin Lakes is $37,500.
What is Inequality or Gini Index in Twin Lakes?
Inequality or Gini Index in Twin Lakes is 0.37.
What is the Total Population of Twin Lakes?
Total Population of Twin Lakes is 74.
What is the Total Male Population of Twin Lakes?
Total Male Population of Twin Lakes is 48.
What is the Total Female Population of Twin Lakes?
Total Female Population of Twin Lakes is 26.
What is the Ratio of Males per 100 Females in Twin Lakes?
There are 184.62 Males per 100 Females in Twin Lakes.
What is the Ratio of Females per 100 Males in Twin Lakes?
There are 54.17 Females per 100 Males in Twin Lakes.
What is the Median Population Age in Twin Lakes?
Median Population Age in Twin Lakes is 58.7 Years.
What is the Average Family Size in Twin Lakes
Average Family Size in Twin Lakes is 3.6 People.
What is the Average Household Size in Twin Lakes
Average Household Size in Twin Lakes is 2.3 People.
How Large is the Labor Force in Twin Lakes?
There are 20 People in the Labor Forcein in Twin Lakes.
What is the Percentage of People in the Labor Force in Twin Lakes?
29.4% of People are in the Labor Force in Twin Lakes.
What is the Unemployment Rate in Twin Lakes?
Unemployment Rate in Twin Lakes is 15.0%.