Zip Codes with the Highest Percentage of Population Employed in Health Diagnosing & Treating in Tacoma, WA
RELATED REPORTS & OPTIONS
Health Diagnosing & Treating
Tacoma
Compare Zip Codes
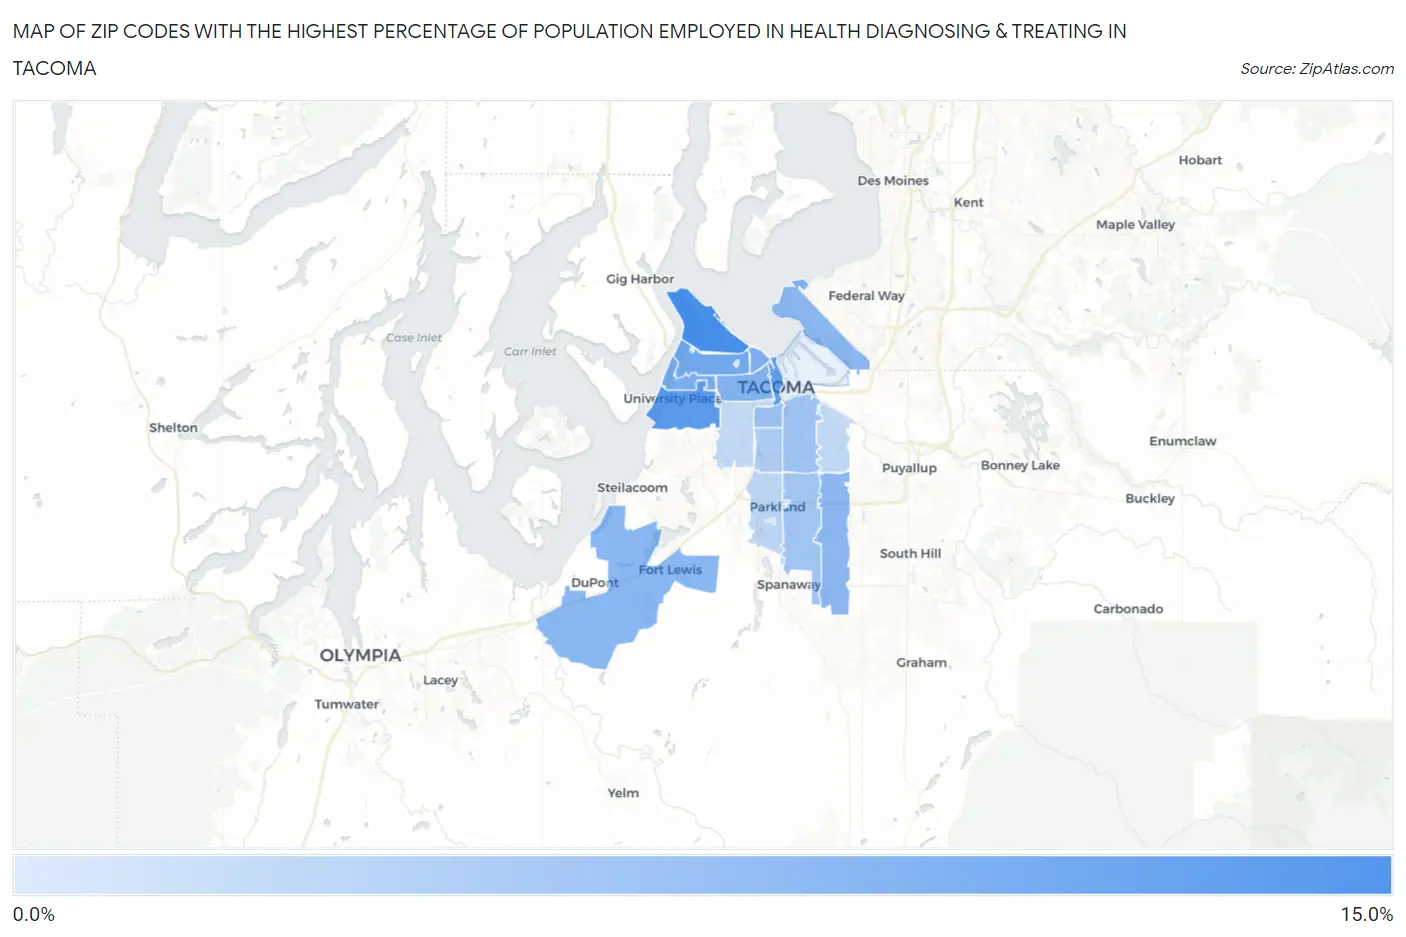
Map of Zip Codes with the Highest Percentage of Population Employed in Health Diagnosing & Treating in Tacoma
0.83%
11.4%
Zip Codes with the Highest Percentage of Population Employed in Health Diagnosing & Treating in Tacoma, WA
| Zip Code | % Employed | vs State | vs National | |
| 1. | 98407 | 11.4% | 5.6%(+5.81)#29 | 6.2%(+5.12)#2,610 |
| 2. | 98466 | 10.0% | 5.6%(+4.45)#42 | 6.2%(+3.76)#3,880 |
| 3. | 98402 | 9.3% | 5.6%(+3.74)#50 | 6.2%(+3.05)#4,867 |
| 4. | 98406 | 8.0% | 5.6%(+2.49)#72 | 6.2%(+1.80)#7,383 |
| 5. | 98465 | 7.4% | 5.6%(+1.83)#97 | 6.2%(+1.14)#9,162 |
| 6. | 98403 | 7.3% | 5.6%(+1.79)#100 | 6.2%(+1.10)#9,292 |
| 7. | 98405 | 7.0% | 5.6%(+1.48)#117 | 6.2%(+0.787)#10,262 |
| 8. | 98433 | 6.6% | 5.6%(+1.05)#137 | 6.2%(+0.357)#11,657 |
| 9. | 98446 | 6.4% | 5.6%(+0.840)#150 | 6.2%(+0.149)#12,405 |
| 10. | 98422 | 6.3% | 5.6%(+0.738)#157 | 6.2%(+0.047)#12,784 |
| 11. | 98418 | 5.3% | 5.6%(-0.242)#235 | 6.2%(-0.933)#16,511 |
| 12. | 98404 | 5.0% | 5.6%(-0.591)#274 | 6.2%(-1.28)#17,862 |
| 13. | 98445 | 4.8% | 5.6%(-0.775)#292 | 6.2%(-1.47)#18,576 |
| 14. | 98408 | 3.9% | 5.6%(-1.69)#344 | 6.2%(-2.38)#21,799 |
| 15. | 98444 | 2.9% | 5.6%(-2.63)#397 | 6.2%(-3.32)#24,503 |
| 16. | 98409 | 2.6% | 5.6%(-2.99)#414 | 6.2%(-3.68)#25,382 |
| 17. | 98443 | 2.5% | 5.6%(-3.08)#419 | 6.2%(-3.77)#25,583 |
| 18. | 98447 | 1.4% | 5.6%(-4.20)#463 | 6.2%(-4.89)#27,396 |
| 19. | 98416 | 0.83% | 5.6%(-4.73)#481 | 6.2%(-5.42)#28,032 |
1
Common Questions
What are the Top 10 Zip Codes with the Highest Percentage of Population Employed in Health Diagnosing & Treating in Tacoma, WA?
Top 10 Zip Codes with the Highest Percentage of Population Employed in Health Diagnosing & Treating in Tacoma, WA are:
What zip code has the Highest Percentage of Population Employed in Health Diagnosing & Treating in Tacoma, WA?
98407 has the Highest Percentage of Population Employed in Health Diagnosing & Treating in Tacoma, WA with 11.4%.
What is the Percentage of Population Employed in Health Diagnosing & Treating in Tacoma, WA?
Percentage of Population Employed in Health Diagnosing & Treating in Tacoma is 6.2%.
What is the Percentage of Population Employed in Health Diagnosing & Treating in Washington?
Percentage of Population Employed in Health Diagnosing & Treating in Washington is 5.6%.
What is the Percentage of Population Employed in Health Diagnosing & Treating in the United States?
Percentage of Population Employed in Health Diagnosing & Treating in the United States is 6.2%.