Zip Codes with the Highest Percentage of Population Employed in Health Diagnosing & Treating in Olympia, WA
RELATED REPORTS & OPTIONS
Health Diagnosing & Treating
Olympia
Compare Zip Codes
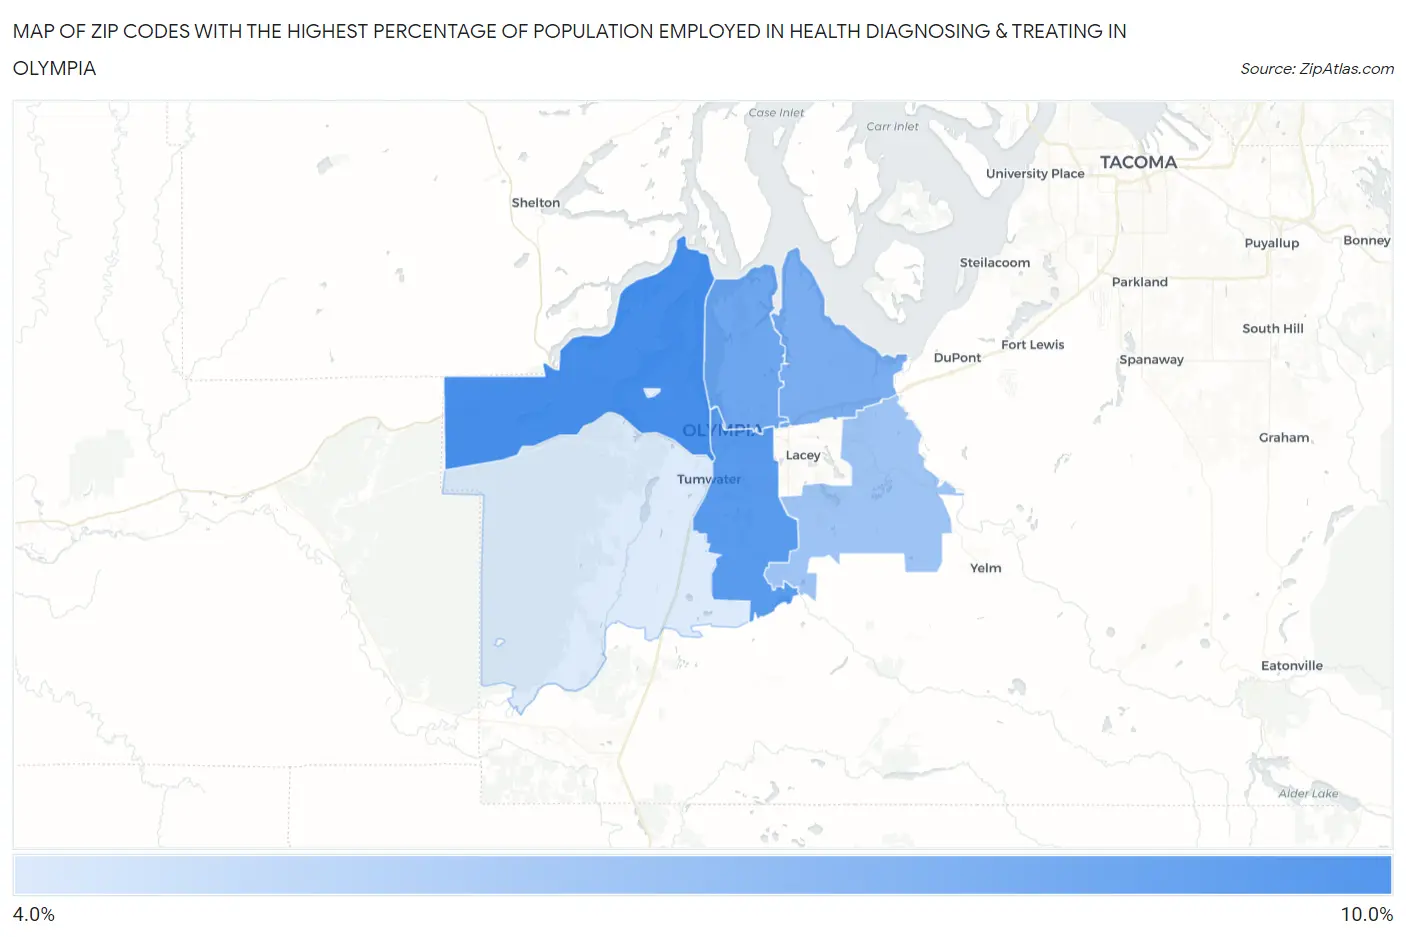
Map of Zip Codes with the Highest Percentage of Population Employed in Health Diagnosing & Treating in Olympia
4.1%
8.6%
Zip Codes with the Highest Percentage of Population Employed in Health Diagnosing & Treating in Olympia, WA
| Zip Code | % Employed | vs State | vs National | |
| 1. | 98502 | 8.6% | 5.6%(+3.02)#56 | 6.2%(+2.32)#6,195 |
| 2. | 98501 | 8.1% | 5.6%(+2.54)#71 | 6.2%(+1.85)#7,264 |
| 3. | 98506 | 7.4% | 5.6%(+1.80)#98 | 6.2%(+1.11)#9,259 |
| 4. | 98516 | 7.1% | 5.6%(+1.51)#114 | 6.2%(+0.824)#10,141 |
| 5. | 98513 | 6.0% | 5.6%(+0.412)#176 | 6.2%(-0.279)#13,997 |
| 6. | 98512 | 4.1% | 5.6%(-1.45)#329 | 6.2%(-2.14)#21,048 |
1
Common Questions
What are the Top 5 Zip Codes with the Highest Percentage of Population Employed in Health Diagnosing & Treating in Olympia, WA?
Top 5 Zip Codes with the Highest Percentage of Population Employed in Health Diagnosing & Treating in Olympia, WA are:
What zip code has the Highest Percentage of Population Employed in Health Diagnosing & Treating in Olympia, WA?
98502 has the Highest Percentage of Population Employed in Health Diagnosing & Treating in Olympia, WA with 8.6%.
What is the Percentage of Population Employed in Health Diagnosing & Treating in Olympia, WA?
Percentage of Population Employed in Health Diagnosing & Treating in Olympia is 7.4%.
What is the Percentage of Population Employed in Health Diagnosing & Treating in Washington?
Percentage of Population Employed in Health Diagnosing & Treating in Washington is 5.6%.
What is the Percentage of Population Employed in Health Diagnosing & Treating in the United States?
Percentage of Population Employed in Health Diagnosing & Treating in the United States is 6.2%.