Zip Codes with the Highest Percentage of Population Employed in Health Diagnosing & Treating in Lynnwood, WA
RELATED REPORTS & OPTIONS
Health Diagnosing & Treating
Lynnwood
Compare Zip Codes
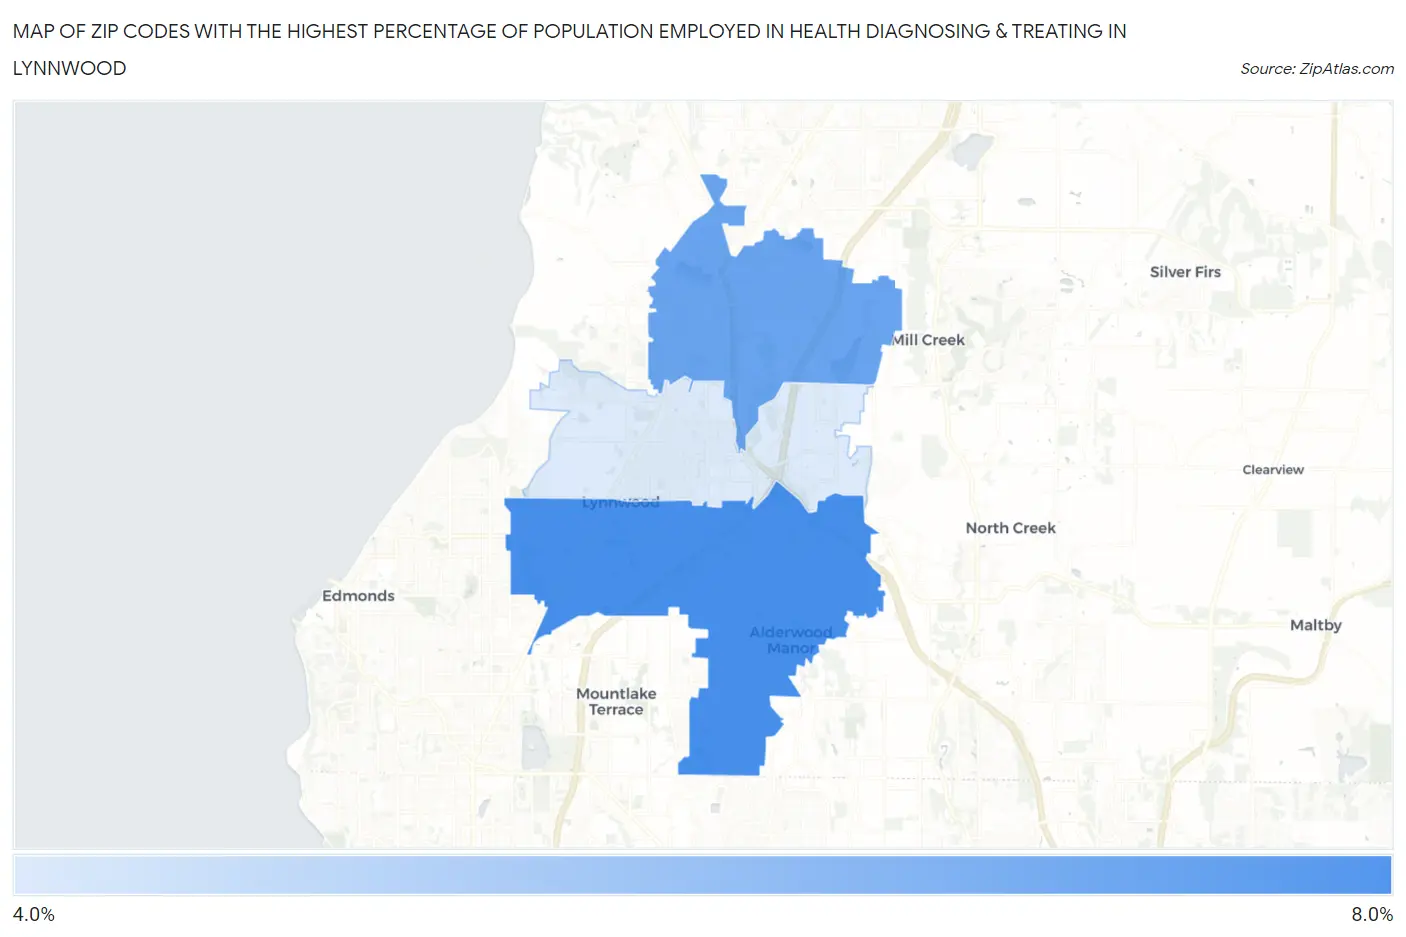
Map of Zip Codes with the Highest Percentage of Population Employed in Health Diagnosing & Treating in Lynnwood
4.8%
6.9%
Zip Codes with the Highest Percentage of Population Employed in Health Diagnosing & Treating in Lynnwood, WA
| Zip Code | % Employed | vs State | vs National | |
| 1. | 98036 | 6.9% | 5.6%(+1.32)#126 | 6.2%(+0.629)#10,767 |
| 2. | 98087 | 6.4% | 5.6%(+0.834)#151 | 6.2%(+0.143)#12,425 |
| 3. | 98037 | 4.8% | 5.6%(-0.712)#287 | 6.2%(-1.40)#18,328 |
1
Common Questions
What are the Top Zip Codes with the Highest Percentage of Population Employed in Health Diagnosing & Treating in Lynnwood, WA?
Top Zip Codes with the Highest Percentage of Population Employed in Health Diagnosing & Treating in Lynnwood, WA are:
What zip code has the Highest Percentage of Population Employed in Health Diagnosing & Treating in Lynnwood, WA?
98036 has the Highest Percentage of Population Employed in Health Diagnosing & Treating in Lynnwood, WA with 6.9%.
What is the Percentage of Population Employed in Health Diagnosing & Treating in Lynnwood, WA?
Percentage of Population Employed in Health Diagnosing & Treating in Lynnwood is 5.5%.
What is the Percentage of Population Employed in Health Diagnosing & Treating in Washington?
Percentage of Population Employed in Health Diagnosing & Treating in Washington is 5.6%.
What is the Percentage of Population Employed in Health Diagnosing & Treating in the United States?
Percentage of Population Employed in Health Diagnosing & Treating in the United States is 6.2%.