Bickleton, WA Map & Demographics
Bickleton Map
Bickleton Overview
$36,308
PER CAPITA INCOME
$75,250
AVG FAMILY INCOME
$57,321
AVG HOUSEHOLD INCOME
0.34
INEQUALITY / GINI INDEX
78
TOTAL POPULATION
36
MALE POPULATION
42
FEMALE POPULATION
85.71
MALES / 100 FEMALES
116.67
FEMALES / 100 MALES
59.5
MEDIAN AGE
2.1
AVG FAMILY SIZE
1.8
AVG HOUSEHOLD SIZE
32
LABOR FORCE [ PEOPLE ]
46.4%
PERCENT IN LABOR FORCE
Bickleton Zip Codes
Bickleton Area Codes
Income in Bickleton
Income Overview in Bickleton
Per Capita Income in Bickleton is $36,308, while median incomes of families and households are $75,250 and $57,321 respectively.
| Characteristic | Number | Measure |
| Per Capita Income | 78 | $36,308 |
| Median Family Income | 29 | $75,250 |
| Mean Family Income | 29 | $78,814 |
| Median Household Income | 43 | $57,321 |
| Mean Household Income | 43 | $67,365 |
| Income Deficit | 29 | $0 |
| Wage / Income Gap (%) | 78 | 0.00% |
| Wage / Income Gap ($) | 78 | 100.00¢ per $1 |
| Gini / Inequality Index | 78 | 0.34 |
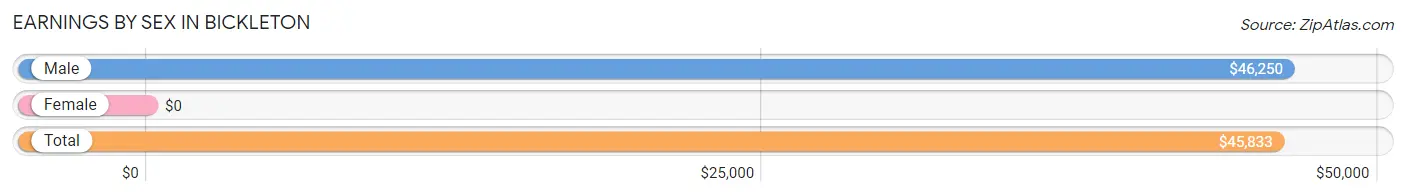
Earnings by Sex in Bickleton
| Sex | Number | Average Earnings |
| Male | 19 (52.8%) | $46,250 |
| Female | 17 (47.2%) | $0 |
| Total | 36 (100.0%) | $45,833 |
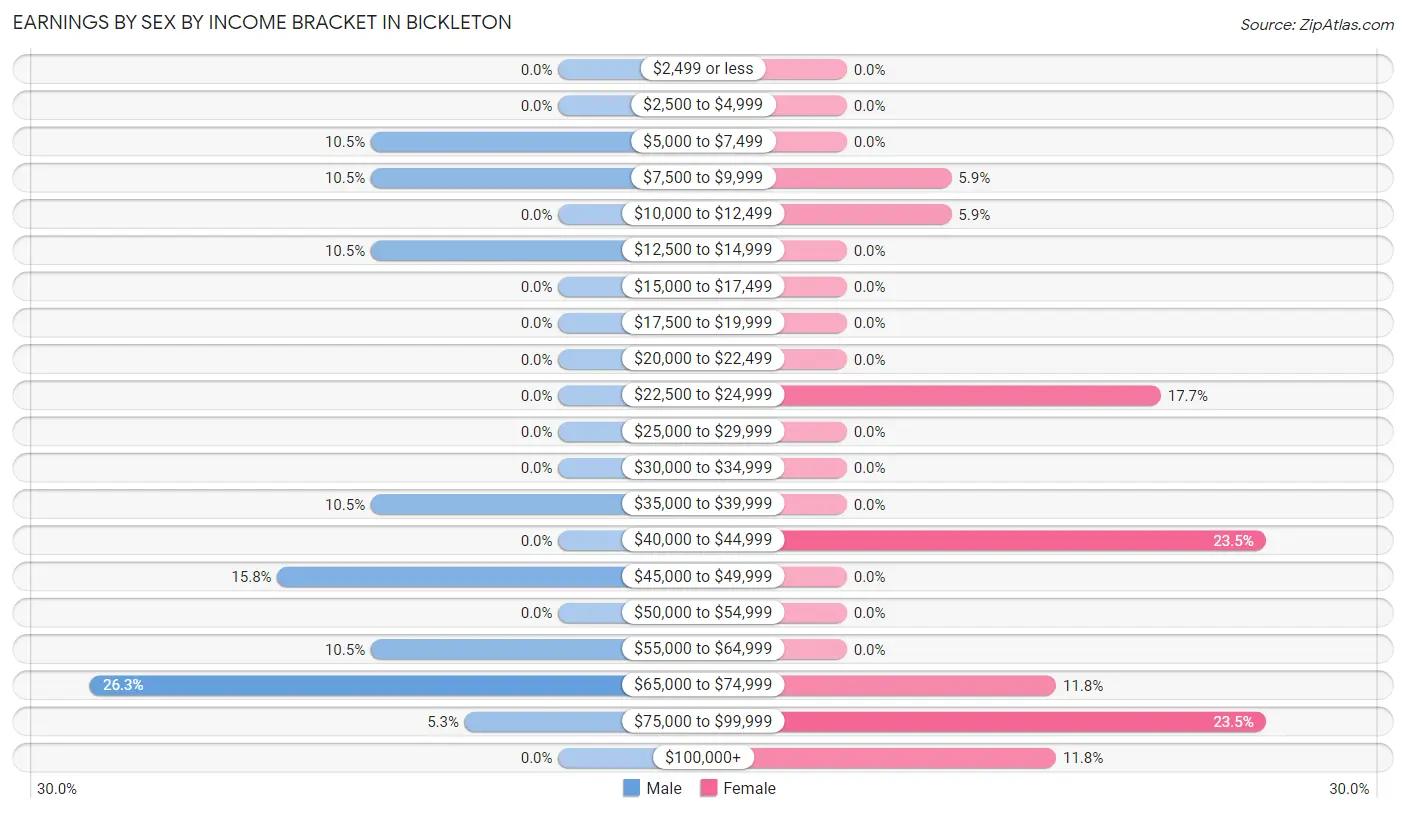
Earnings by Sex by Income Bracket in Bickleton
The most common earnings brackets in Bickleton are $65,000 to $74,999 for men (5 | 26.3%) and $40,000 to $44,999 for women (4 | 23.5%).
| Income | Male | Female |
| $2,499 or less | 0 (0.0%) | 0 (0.0%) |
| $2,500 to $4,999 | 0 (0.0%) | 0 (0.0%) |
| $5,000 to $7,499 | 2 (10.5%) | 0 (0.0%) |
| $7,500 to $9,999 | 2 (10.5%) | 1 (5.9%) |
| $10,000 to $12,499 | 0 (0.0%) | 1 (5.9%) |
| $12,500 to $14,999 | 2 (10.5%) | 0 (0.0%) |
| $15,000 to $17,499 | 0 (0.0%) | 0 (0.0%) |
| $17,500 to $19,999 | 0 (0.0%) | 0 (0.0%) |
| $20,000 to $22,499 | 0 (0.0%) | 0 (0.0%) |
| $22,500 to $24,999 | 0 (0.0%) | 3 (17.6%) |
| $25,000 to $29,999 | 0 (0.0%) | 0 (0.0%) |
| $30,000 to $34,999 | 0 (0.0%) | 0 (0.0%) |
| $35,000 to $39,999 | 2 (10.5%) | 0 (0.0%) |
| $40,000 to $44,999 | 0 (0.0%) | 4 (23.5%) |
| $45,000 to $49,999 | 3 (15.8%) | 0 (0.0%) |
| $50,000 to $54,999 | 0 (0.0%) | 0 (0.0%) |
| $55,000 to $64,999 | 2 (10.5%) | 0 (0.0%) |
| $65,000 to $74,999 | 5 (26.3%) | 2 (11.8%) |
| $75,000 to $99,999 | 1 (5.3%) | 4 (23.5%) |
| $100,000+ | 0 (0.0%) | 2 (11.8%) |
| Total | 19 (100.0%) | 17 (100.0%) |
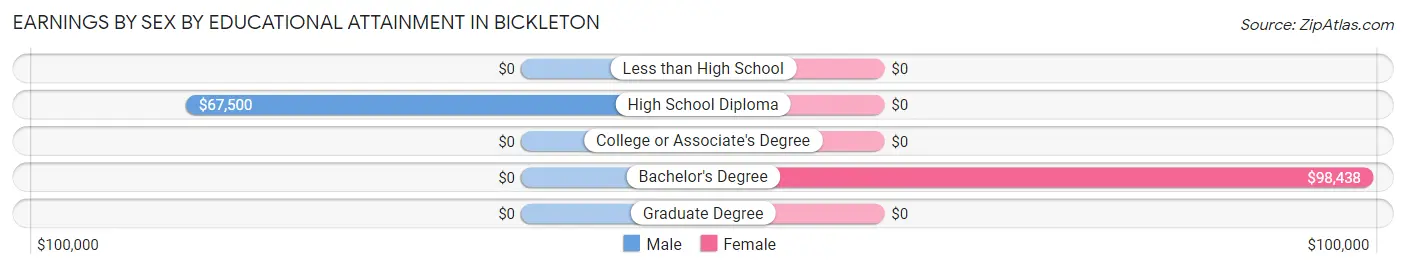
Earnings by Sex by Educational Attainment in Bickleton
| Educational Attainment | Male Income | Female Income |
| Less than High School | - | - |
| High School Diploma | $67,500 | $0 |
| College or Associate's Degree | - | - |
| Bachelor's Degree | - | - |
| Graduate Degree | - | - |
| Total | $47,083 | $0 |
Family Income in Bickleton
Family Income Brackets in Bickleton
According to the Bickleton family income data, there are 12 families falling into the $50,000 to $74,999 income range, which is the most common income bracket and makes up 41.4% of all families.
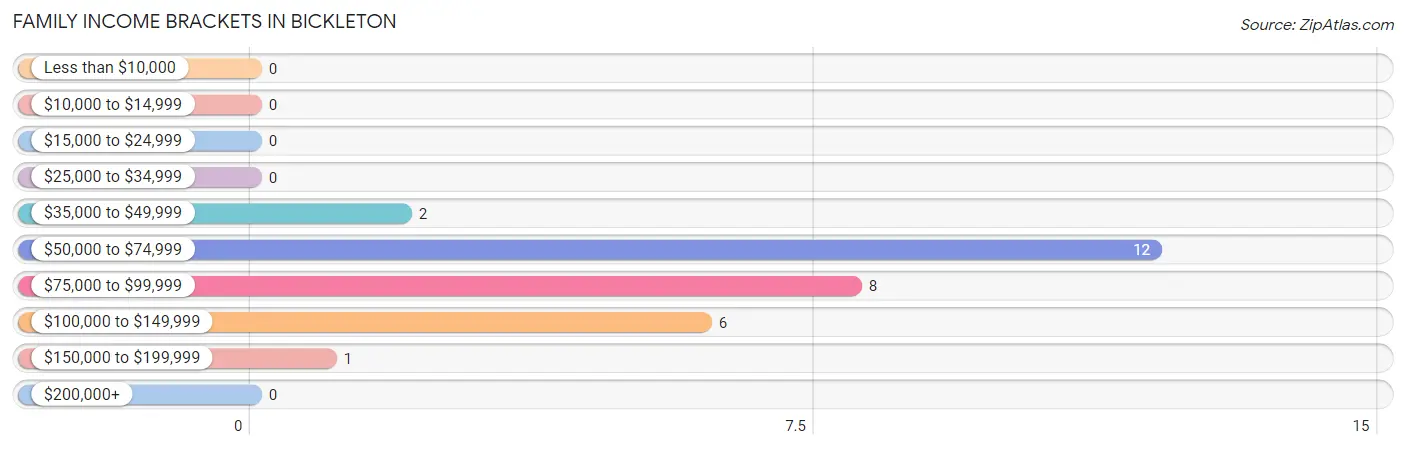
| Income Bracket | # Families | % Families |
| Less than $10,000 | 0 | 0.0% |
| $10,000 to $14,999 | 0 | 0.0% |
| $15,000 to $24,999 | 0 | 0.0% |
| $25,000 to $34,999 | 0 | 0.0% |
| $35,000 to $49,999 | 2 | 6.9% |
| $50,000 to $74,999 | 12 | 41.4% |
| $75,000 to $99,999 | 8 | 27.6% |
| $100,000 to $149,999 | 6 | 20.7% |
| $150,000 to $199,999 | 1 | 3.4% |
| $200,000+ | 0 | 0.0% |
Family Income by Famaliy Size in Bickleton
2-person families (24 | 82.8%) account for the highest median family income in Bickleton with $61,250 per family, while 2-person families (24 | 82.8%) have the highest median income of $30,625 per family member.
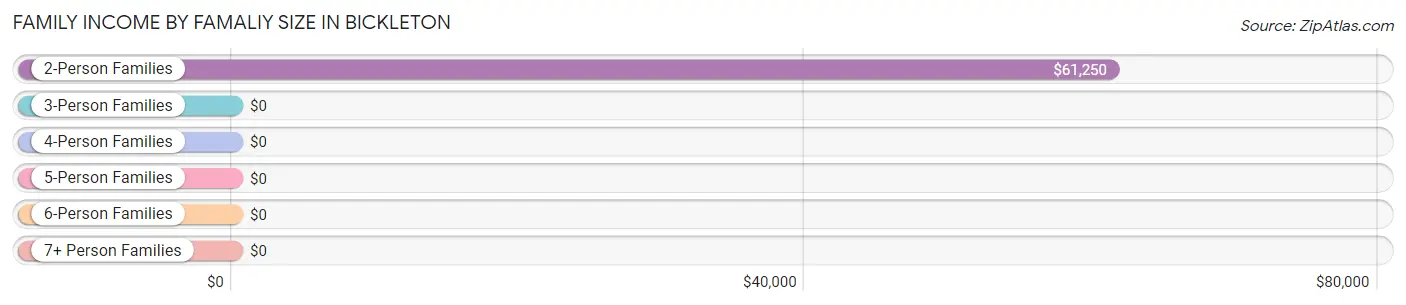
| Income Bracket | # Families | Median Income |
| 2-Person Families | 24 (82.8%) | $61,250 |
| 3-Person Families | 5 (17.2%) | $0 |
| 4-Person Families | 0 (0.0%) | $0 |
| 5-Person Families | 0 (0.0%) | $0 |
| 6-Person Families | 0 (0.0%) | $0 |
| 7+ Person Families | 0 (0.0%) | $0 |
| Total | 29 (100.0%) | $75,250 |
Family Income by Number of Earners in Bickleton
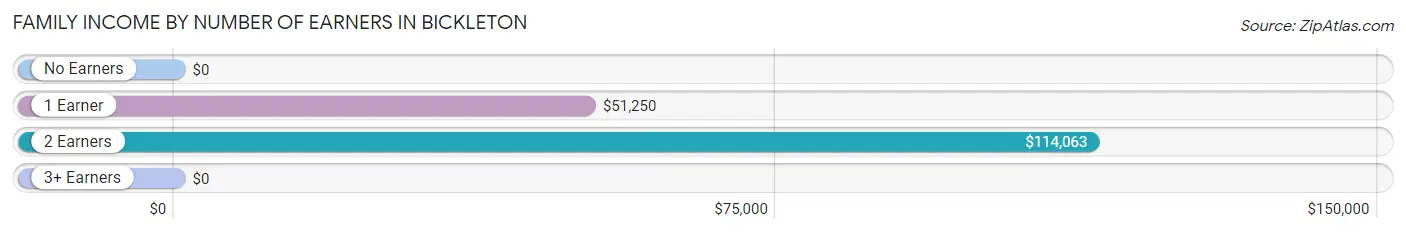
| Number of Earners | # Families | Median Income |
| No Earners | 12 (41.4%) | $0 |
| 1 Earner | 7 (24.1%) | $51,250 |
| 2 Earners | 9 (31.0%) | $114,063 |
| 3+ Earners | 1 (3.5%) | $0 |
| Total | 29 (100.0%) | $75,250 |
Household Income in Bickleton
Household Income Brackets in Bickleton
With 12 households falling in the category, the $50,000 to $74,999 income range is the most frequent in Bickleton, accounting for 27.9% of all households.
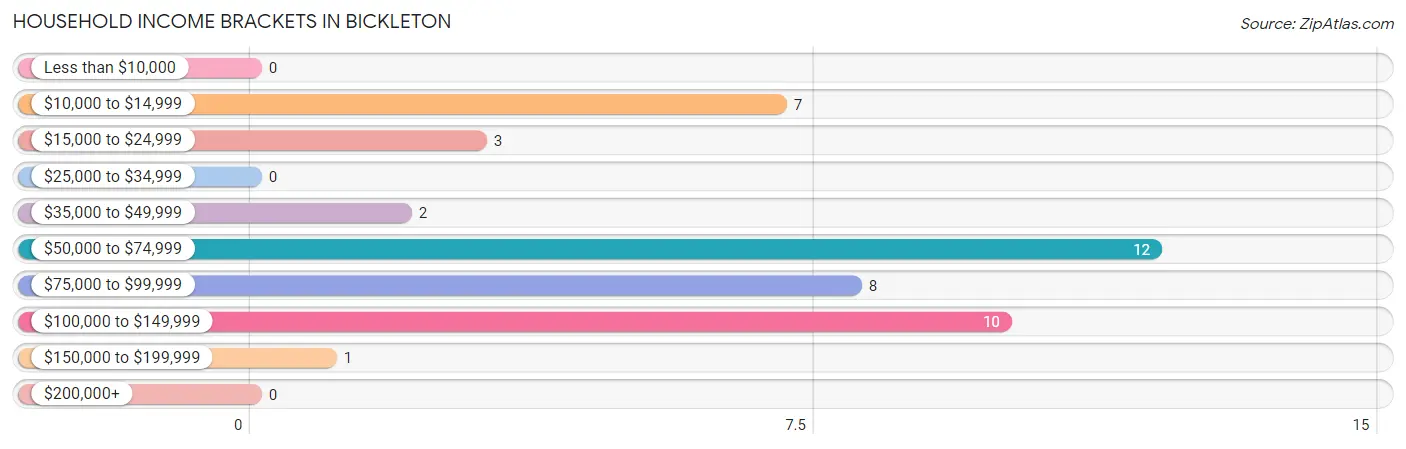
| Income Bracket | # Households | % Households |
| Less than $10,000 | 0 | 0.0% |
| $10,000 to $14,999 | 7 | 16.3% |
| $15,000 to $24,999 | 3 | 7.0% |
| $25,000 to $34,999 | 0 | 0.0% |
| $35,000 to $49,999 | 2 | 4.7% |
| $50,000 to $74,999 | 12 | 27.9% |
| $75,000 to $99,999 | 8 | 18.6% |
| $100,000 to $149,999 | 10 | 23.3% |
| $150,000 to $199,999 | 1 | 2.3% |
| $200,000+ | 0 | 0.0% |
Household Income by Householder Age in Bickleton
The median household income in Bickleton is $57,321, with the highest median household income of $90,000 found in the 25 to 44 years age bracket for the primary householder. A total of 8 households (18.6%) fall into this category.
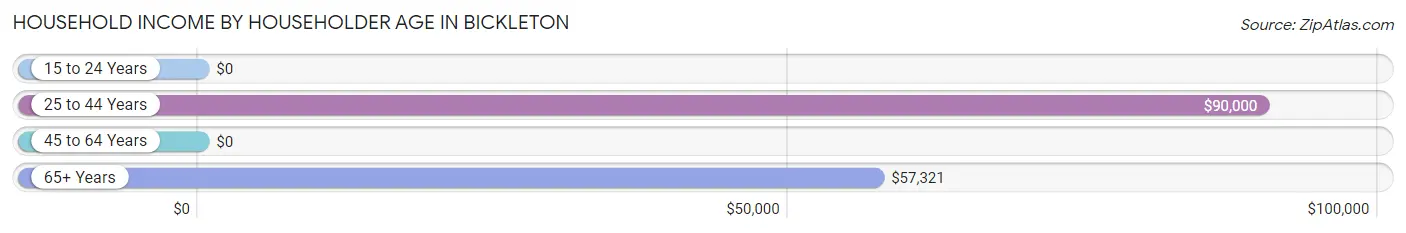
| Income Bracket | # Households | Median Income |
| 15 to 24 Years | 0 (0.0%) | $0 |
| 25 to 44 Years | 8 (18.6%) | $90,000 |
| 45 to 64 Years | 12 (27.9%) | $0 |
| 65+ Years | 23 (53.5%) | $57,321 |
| Total | 43 (100.0%) | $57,321 |
Poverty in Bickleton
Income Below Poverty by Sex and Age in Bickleton
With 19.4% poverty level for males and 4.8% for females among the residents of Bickleton, 55 to 64 year old males and 18 to 24 year old females are the most vulnerable to poverty, with 5 males (62.5%) and 2 females (100.0%) in their respective age groups living below the poverty level.
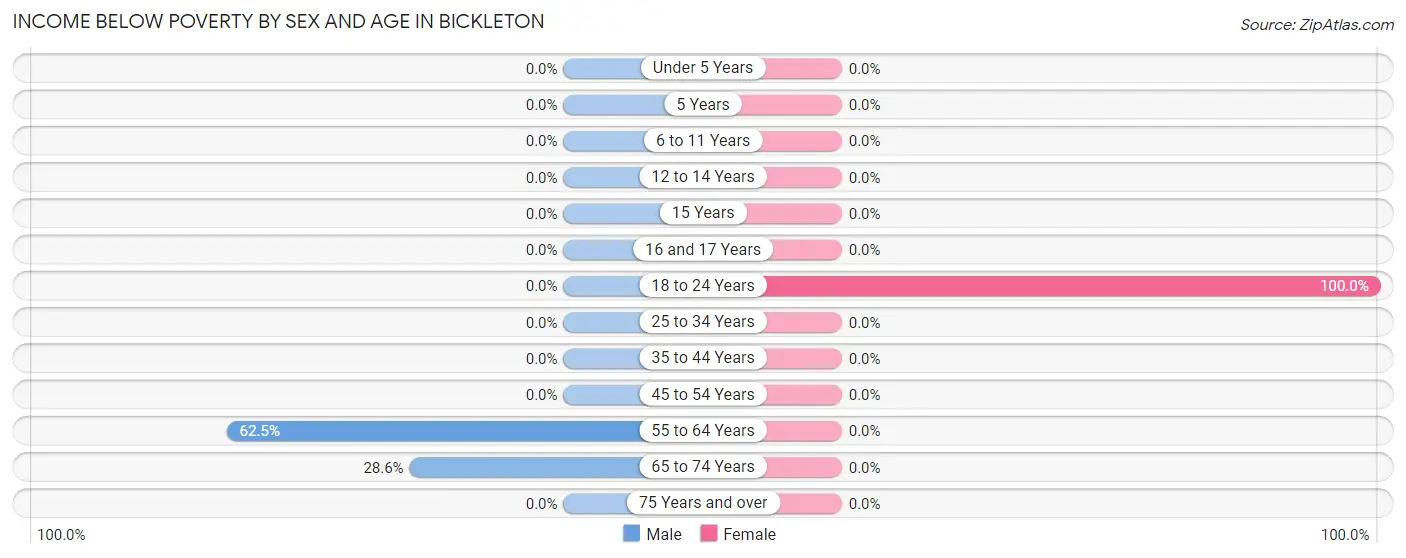
| Age Bracket | Male | Female |
| Under 5 Years | 0 (0.0%) | 0 (0.0%) |
| 5 Years | 0 (0.0%) | 0 (0.0%) |
| 6 to 11 Years | 0 (0.0%) | 0 (0.0%) |
| 12 to 14 Years | 0 (0.0%) | 0 (0.0%) |
| 15 Years | 0 (0.0%) | 0 (0.0%) |
| 16 and 17 Years | 0 (0.0%) | 0 (0.0%) |
| 18 to 24 Years | 0 (0.0%) | 2 (100.0%) |
| 25 to 34 Years | 0 (0.0%) | 0 (0.0%) |
| 35 to 44 Years | 0 (0.0%) | 0 (0.0%) |
| 45 to 54 Years | 0 (0.0%) | 0 (0.0%) |
| 55 to 64 Years | 5 (62.5%) | 0 (0.0%) |
| 65 to 74 Years | 2 (28.6%) | 0 (0.0%) |
| 75 Years and over | 0 (0.0%) | 0 (0.0%) |
| Total | 7 (19.4%) | 2 (4.8%) |
Income Above Poverty by Sex and Age in Bickleton
According to the poverty statistics in Bickleton, males aged 18 to 24 years and females aged under 5 years are the age groups that are most secure financially, with 100.0% of males and 100.0% of females in these age groups living above the poverty line.
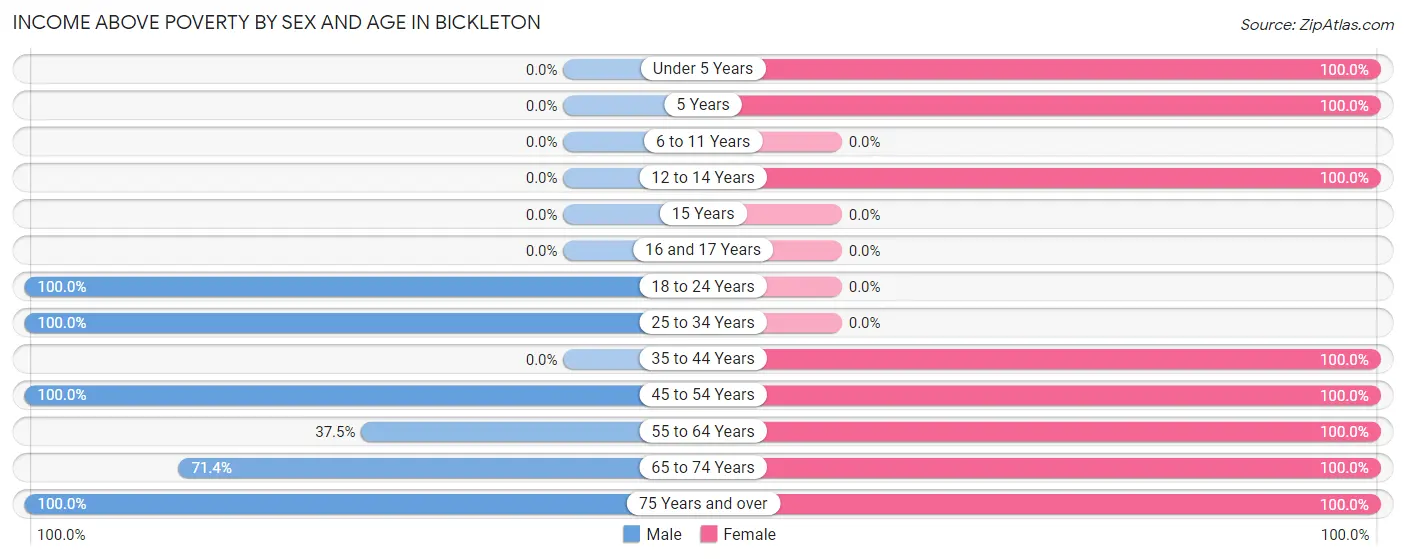
| Age Bracket | Male | Female |
| Under 5 Years | 0 (0.0%) | 2 (100.0%) |
| 5 Years | 0 (0.0%) | 2 (100.0%) |
| 6 to 11 Years | 0 (0.0%) | 0 (0.0%) |
| 12 to 14 Years | 0 (0.0%) | 5 (100.0%) |
| 15 Years | 0 (0.0%) | 0 (0.0%) |
| 16 and 17 Years | 0 (0.0%) | 0 (0.0%) |
| 18 to 24 Years | 2 (100.0%) | 0 (0.0%) |
| 25 to 34 Years | 2 (100.0%) | 0 (0.0%) |
| 35 to 44 Years | 0 (0.0%) | 6 (100.0%) |
| 45 to 54 Years | 7 (100.0%) | 1 (100.0%) |
| 55 to 64 Years | 3 (37.5%) | 8 (100.0%) |
| 65 to 74 Years | 5 (71.4%) | 9 (100.0%) |
| 75 Years and over | 10 (100.0%) | 7 (100.0%) |
| Total | 29 (80.6%) | 40 (95.2%) |
Income Below Poverty Among Married-Couple Families in Bickleton
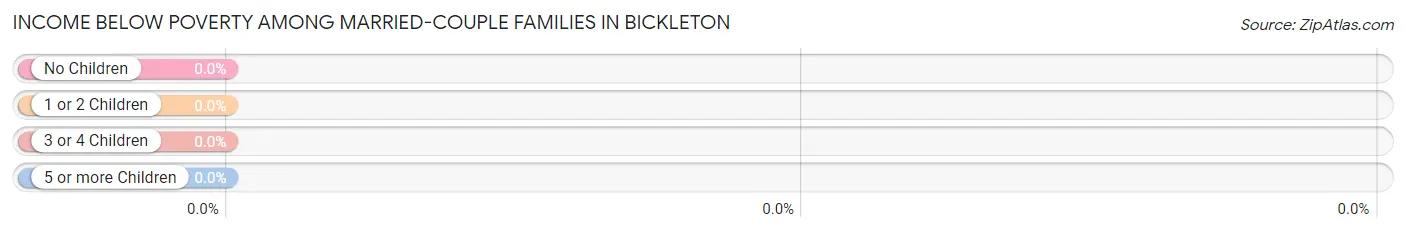
| Children | Above Poverty | Below Poverty |
| No Children | 21 (100.0%) | 0 (0.0%) |
| 1 or 2 Children | 4 (100.0%) | 0 (0.0%) |
| 3 or 4 Children | 0 (0.0%) | 0 (0.0%) |
| 5 or more Children | 0 (0.0%) | 0 (0.0%) |
| Total | 25 (100.0%) | 0 (0.0%) |
Income Below Poverty Among Single-Parent Households in Bickleton
| Children | Single Father | Single Mother |
| No Children | 0 (0.0%) | 0 (0.0%) |
| 1 or 2 Children | 0 (0.0%) | 0 (0.0%) |
| 3 or 4 Children | 0 (0.0%) | 0 (0.0%) |
| 5 or more Children | 0 (0.0%) | 0 (0.0%) |
| Total | 0 (0.0%) | 0 (0.0%) |
Income Below Poverty Among Married-Couple vs Single-Parent Households in Bickleton
| Children | Married-Couple Families | Single-Parent Households |
| No Children | 0 (0.0%) | 0 (0.0%) |
| 1 or 2 Children | 0 (0.0%) | 0 (0.0%) |
| 3 or 4 Children | 0 (0.0%) | 0 (0.0%) |
| 5 or more Children | 0 (0.0%) | 0 (0.0%) |
| Total | 0 (0.0%) | 0 (0.0%) |
Race in Bickleton
The most populous races in Bickleton are White / Caucasian (71 | 91.0%), and Two or more Races (7 | 9.0%).
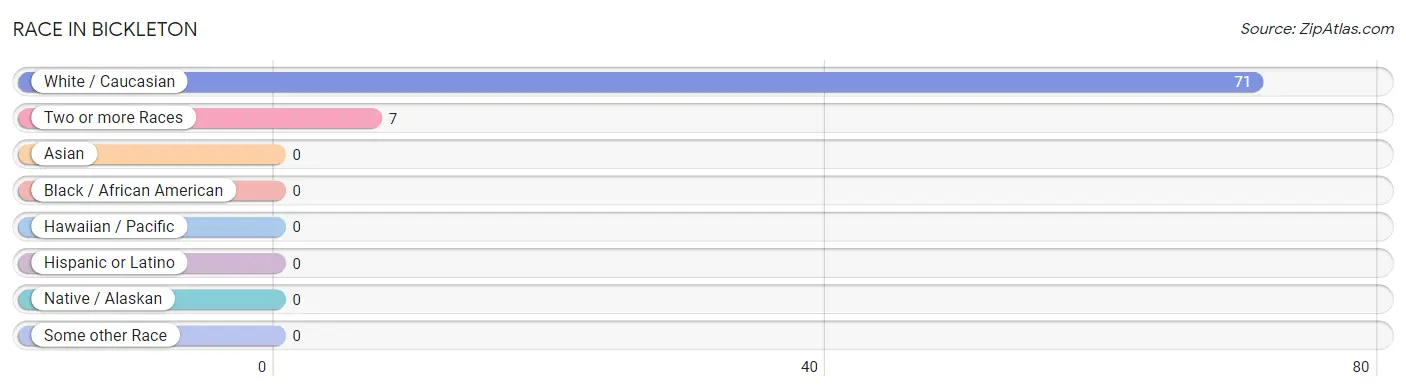
| Race | # Population | % Population |
| Asian | 0 | 0.0% |
| Black / African American | 0 | 0.0% |
| Hawaiian / Pacific | 0 | 0.0% |
| Hispanic or Latino | 0 | 0.0% |
| Native / Alaskan | 0 | 0.0% |
| White / Caucasian | 71 | 91.0% |
| Two or more Races | 7 | 9.0% |
| Some other Race | 0 | 0.0% |
| Total | 78 | 100.0% |
Ancestry in Bickleton
The most populous ancestries reported in Bickleton are German (21 | 26.9%), English (15 | 19.2%), Danish (9 | 11.5%), French (7 | 9.0%), and Norwegian (5 | 6.4%), together accounting for 73.1% of all Bickleton residents.
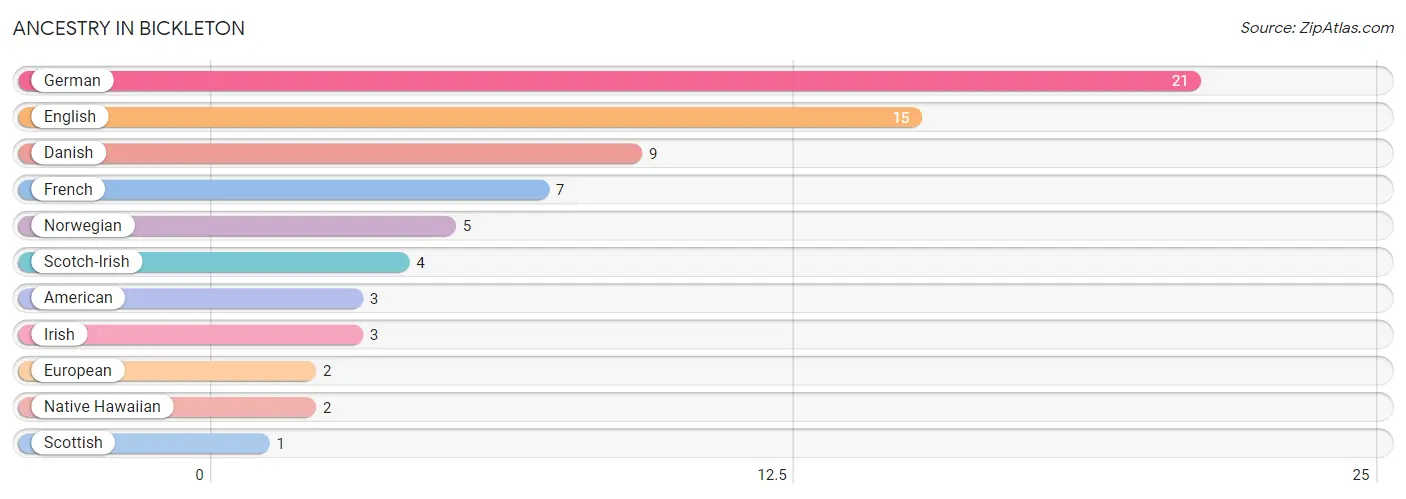
| Ancestry | # Population | % Population |
| American | 3 | 3.8% |
| Danish | 9 | 11.5% |
| English | 15 | 19.2% |
| European | 2 | 2.6% |
| French | 7 | 9.0% |
| German | 21 | 26.9% |
| Irish | 3 | 3.8% |
| Native Hawaiian | 2 | 2.6% |
| Norwegian | 5 | 6.4% |
| Scotch-Irish | 4 | 5.1% |
| Scottish | 1 | 1.3% | View All 11 Rows |
Immigrants in Bickleton

| Immigration Origin | # Population | % Population | View All 0 Rows |
Sex and Age in Bickleton
Sex and Age in Bickleton
The most populous age groups in Bickleton are 75 to 79 Years (10 | 27.8%) for men and 75 to 79 Years (7 | 16.7%) for women.
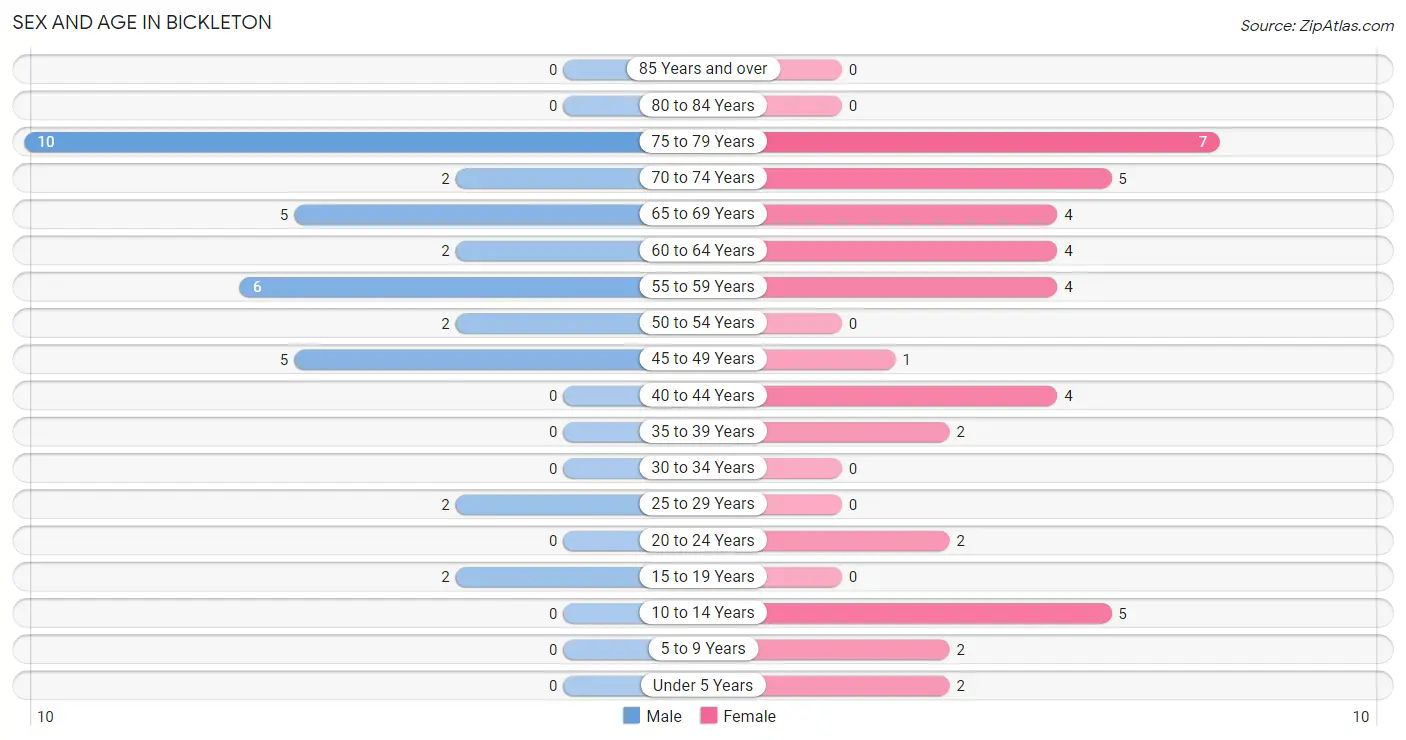
| Age Bracket | Male | Female |
| Under 5 Years | 0 (0.0%) | 2 (4.8%) |
| 5 to 9 Years | 0 (0.0%) | 2 (4.8%) |
| 10 to 14 Years | 0 (0.0%) | 5 (11.9%) |
| 15 to 19 Years | 2 (5.6%) | 0 (0.0%) |
| 20 to 24 Years | 0 (0.0%) | 2 (4.8%) |
| 25 to 29 Years | 2 (5.6%) | 0 (0.0%) |
| 30 to 34 Years | 0 (0.0%) | 0 (0.0%) |
| 35 to 39 Years | 0 (0.0%) | 2 (4.8%) |
| 40 to 44 Years | 0 (0.0%) | 4 (9.5%) |
| 45 to 49 Years | 5 (13.9%) | 1 (2.4%) |
| 50 to 54 Years | 2 (5.6%) | 0 (0.0%) |
| 55 to 59 Years | 6 (16.7%) | 4 (9.5%) |
| 60 to 64 Years | 2 (5.6%) | 4 (9.5%) |
| 65 to 69 Years | 5 (13.9%) | 4 (9.5%) |
| 70 to 74 Years | 2 (5.6%) | 5 (11.9%) |
| 75 to 79 Years | 10 (27.8%) | 7 (16.7%) |
| 80 to 84 Years | 0 (0.0%) | 0 (0.0%) |
| 85 Years and over | 0 (0.0%) | 0 (0.0%) |
| Total | 36 (100.0%) | 42 (100.0%) |
Families and Households in Bickleton
Median Family Size in Bickleton
The median family size in Bickleton is 2.14 persons per family, with married-couple families (25 | 86.2%) accounting for the largest median family size of 2.16 persons per family. On the other hand, single male/father families (2 | 6.9%) represent the smallest median family size with 2.00 persons per family.
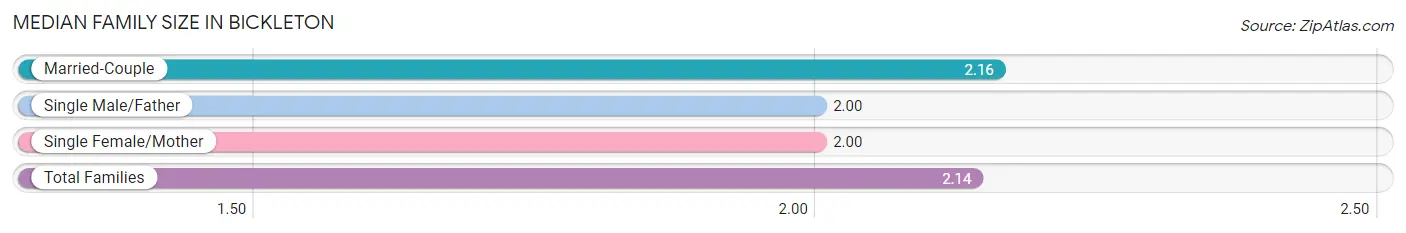
| Family Type | # Families | Family Size |
| Married-Couple | 25 (86.2%) | 2.16 |
| Single Male/Father | 2 (6.9%) | 2.00 |
| Single Female/Mother | 2 (6.9%) | 2.00 |
| Total Families | 29 (100.0%) | 2.14 |
Median Household Size in Bickleton
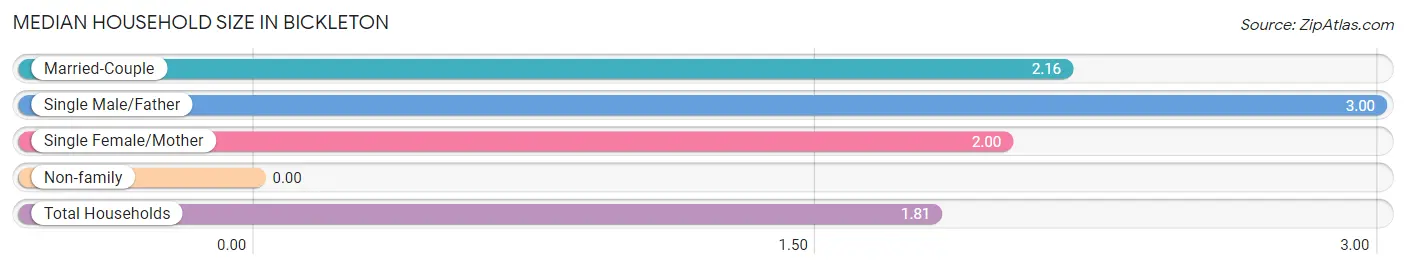
| Household Type | # Households | Household Size |
| Married-Couple | 25 (58.1%) | 2.16 |
| Single Male/Father | 2 (4.6%) | 3.00 |
| Single Female/Mother | 2 (4.6%) | 2.00 |
| Non-family | 14 (32.6%) | - |
| Total Households | 43 (100.0%) | 1.81 |
Household Size by Marriage Status in Bickleton
Out of a total of 43 households in Bickleton, 29 (67.4%) are family households, while 14 (32.6%) are nonfamily households. The most numerous type of family households are 2-person households, comprising 22, and the most common type of nonfamily households are 1-person households, comprising 14.
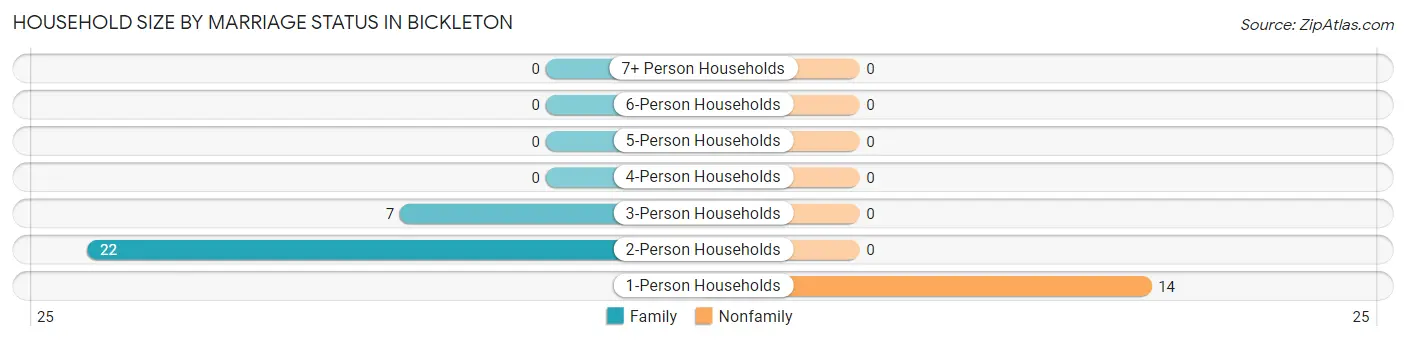
| Household Size | Family Households | Nonfamily Households |
| 1-Person Households | - | 14 (32.6%) |
| 2-Person Households | 22 (51.2%) | 0 (0.0%) |
| 3-Person Households | 7 (16.3%) | 0 (0.0%) |
| 4-Person Households | 0 (0.0%) | 0 (0.0%) |
| 5-Person Households | 0 (0.0%) | 0 (0.0%) |
| 6-Person Households | 0 (0.0%) | 0 (0.0%) |
| 7+ Person Households | 0 (0.0%) | 0 (0.0%) |
| Total | 29 (67.4%) | 14 (32.6%) |
Female Fertility in Bickleton
Fertility by Age in Bickleton
Average fertility rate in Bickleton is 222.0 births per 1,000 women. Women in the age bracket of 20 to 34 years have the highest fertility rate with 1,000.0 births per 1,000 women. Women in the age bracket of 20 to 34 years acount for 100.0% of all women with births.
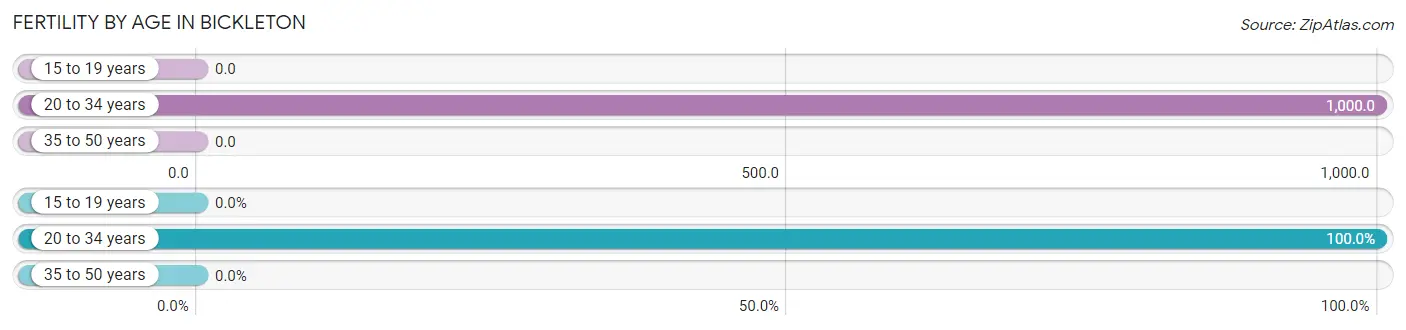
| Age Bracket | Women with Births | Births / 1,000 Women |
| 15 to 19 years | 0 (0.0%) | 0.0 |
| 20 to 34 years | 2 (100.0%) | 1,000.0 |
| 35 to 50 years | 0 (0.0%) | 0.0 |
| Total | 2 (100.0%) | 222.0 |
Fertility by Age by Marriage Status in Bickleton
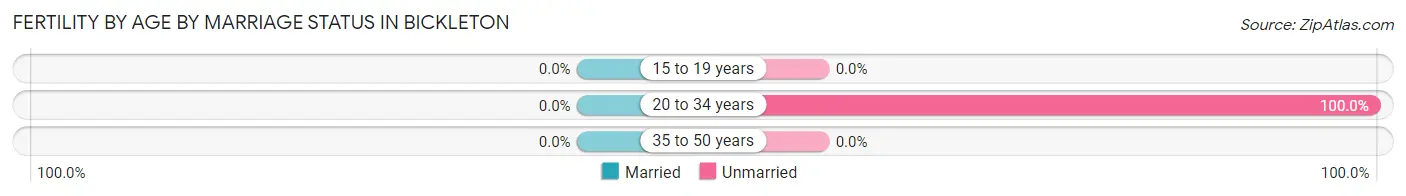
| Age Bracket | Married | Unmarried |
| 15 to 19 years | 0 (0.0%) | 0 (0.0%) |
| 20 to 34 years | 0 (0.0%) | 2 (100.0%) |
| 35 to 50 years | 0 (0.0%) | 0 (0.0%) |
| Total | 0 (0.0%) | 2 (100.0%) |
Fertility by Education in Bickleton
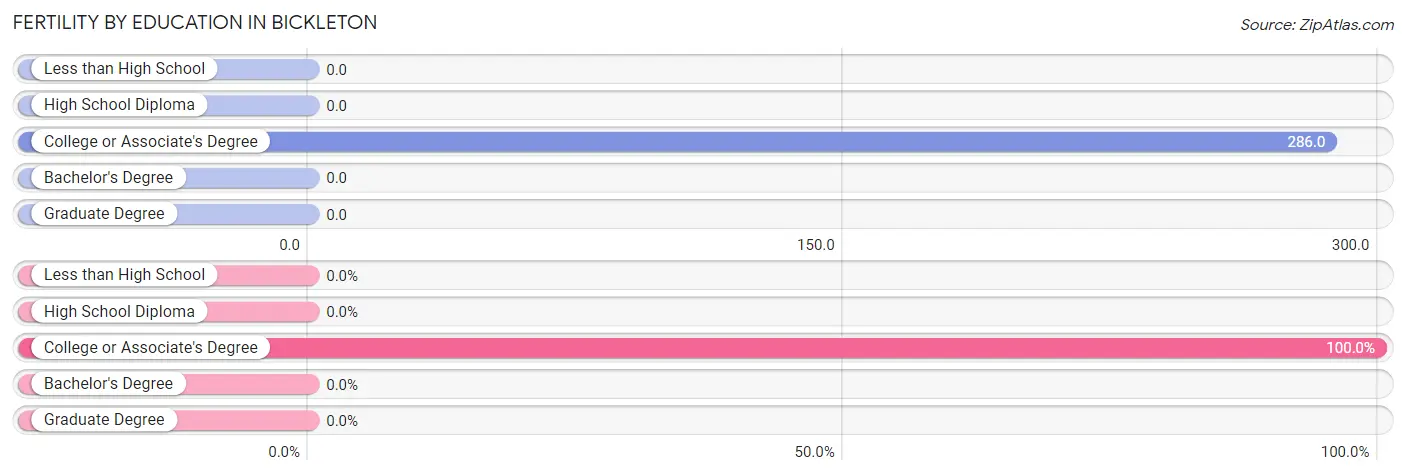
| Educational Attainment | Women with Births | Births / 1,000 Women |
| Less than High School | 0 (0.0%) | 0.0 |
| High School Diploma | 0 (0.0%) | 0.0 |
| College or Associate's Degree | 2 (100.0%) | 286.0 |
| Bachelor's Degree | 0 (0.0%) | 0.0 |
| Graduate Degree | 0 (0.0%) | 0.0 |
| Total | 2 (100.0%) | 222.0 |
Fertility by Education by Marriage Status in Bickleton
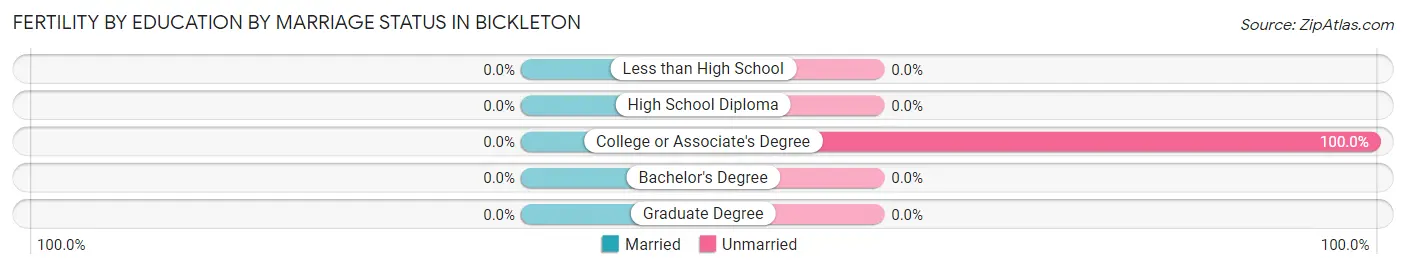
| Educational Attainment | Married | Unmarried |
| Less than High School | 0 (0.0%) | 0 (0.0%) |
| High School Diploma | 0 (0.0%) | 0 (0.0%) |
| College or Associate's Degree | 0 (0.0%) | 2 (100.0%) |
| Bachelor's Degree | 0 (0.0%) | 0 (0.0%) |
| Graduate Degree | 0 (0.0%) | 0 (0.0%) |
| Total | 0 (0.0%) | 2 (100.0%) |
Employment Characteristics in Bickleton
Employment by Class of Employer in Bickleton
Among the 32 employed individuals in Bickleton, private company employees (17 | 53.1%), not-for-profit organizations (7 | 21.9%), and local government employees (5 | 15.6%) make up the most common classes of employment.
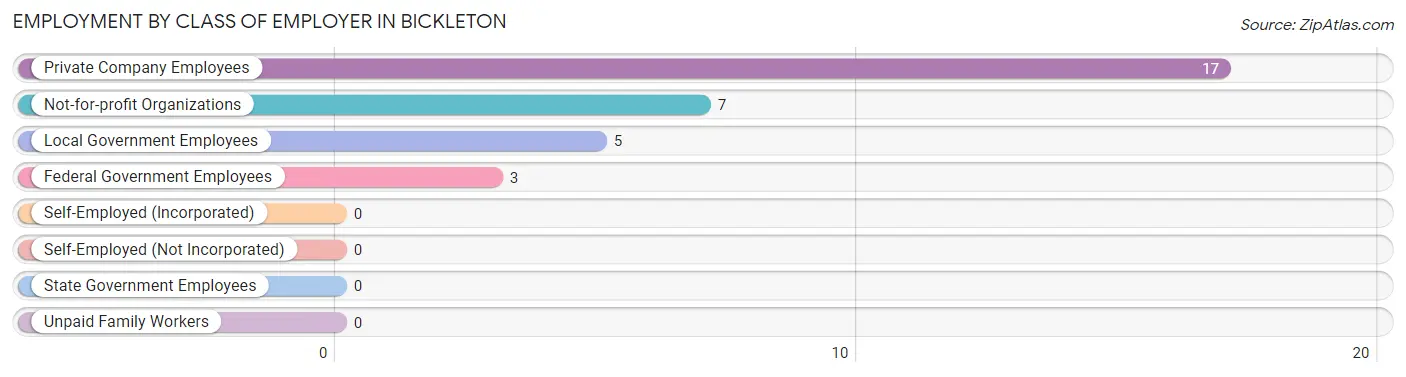
| Employer Class | # Employees | % Employees |
| Private Company Employees | 17 | 53.1% |
| Self-Employed (Incorporated) | 0 | 0.0% |
| Self-Employed (Not Incorporated) | 0 | 0.0% |
| Not-for-profit Organizations | 7 | 21.9% |
| Local Government Employees | 5 | 15.6% |
| State Government Employees | 0 | 0.0% |
| Federal Government Employees | 3 | 9.4% |
| Unpaid Family Workers | 0 | 0.0% |
| Total | 32 | 100.0% |
Employment Status by Age in Bickleton
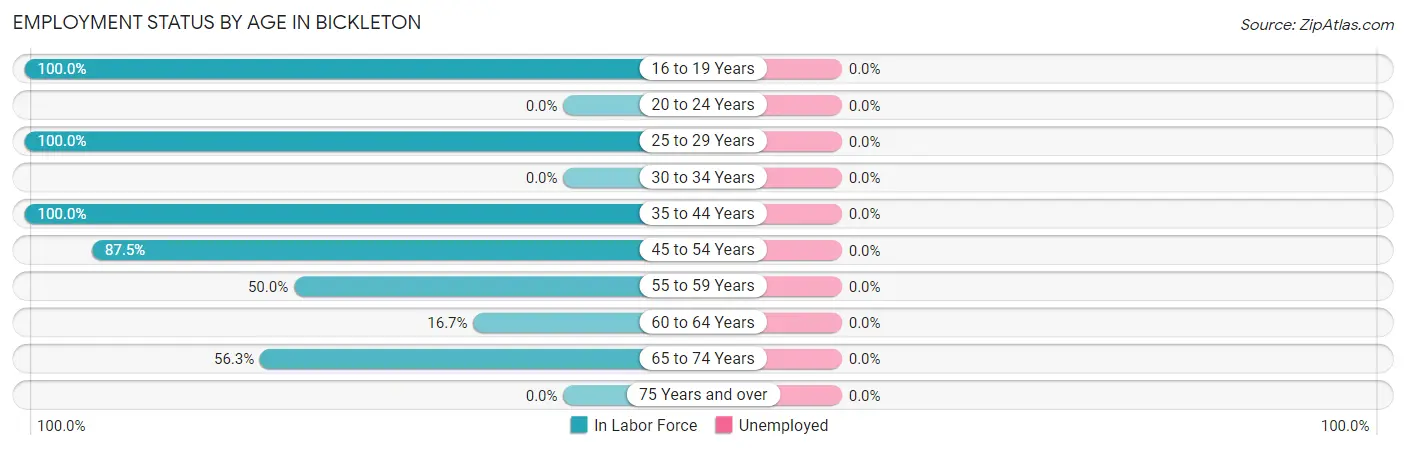
| Age Bracket | In Labor Force | Unemployed |
| 16 to 19 Years | 2 (100.0%) | 0 (0.0%) |
| 20 to 24 Years | 0 (0.0%) | 0 (0.0%) |
| 25 to 29 Years | 2 (100.0%) | 0 (0.0%) |
| 30 to 34 Years | 0 (0.0%) | 0 (0.0%) |
| 35 to 44 Years | 6 (100.0%) | 0 (0.0%) |
| 45 to 54 Years | 7 (87.5%) | 0 (0.0%) |
| 55 to 59 Years | 5 (50.0%) | 0 (0.0%) |
| 60 to 64 Years | 1 (16.7%) | 0 (0.0%) |
| 65 to 74 Years | 9 (56.3%) | 0 (0.0%) |
| 75 Years and over | 0 (0.0%) | 0 (0.0%) |
| Total | 32 (46.4%) | 0 (0.0%) |
Employment Status by Educational Attainment in Bickleton
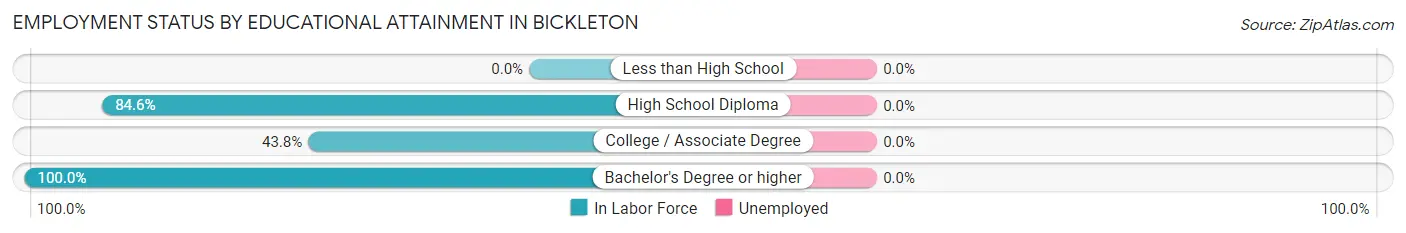
| Educational Attainment | In Labor Force | Unemployed |
| Less than High School | 0 (0.0%) | 0 (0.0%) |
| High School Diploma | 11 (84.6%) | 0 (0.0%) |
| College / Associate Degree | 7 (43.8%) | 0 (0.0%) |
| Bachelor's Degree or higher | 3 (100.0%) | 0 (0.0%) |
| Total | 21 (65.6%) | 0 (0.0%) |
Employment Occupations by Sex in Bickleton
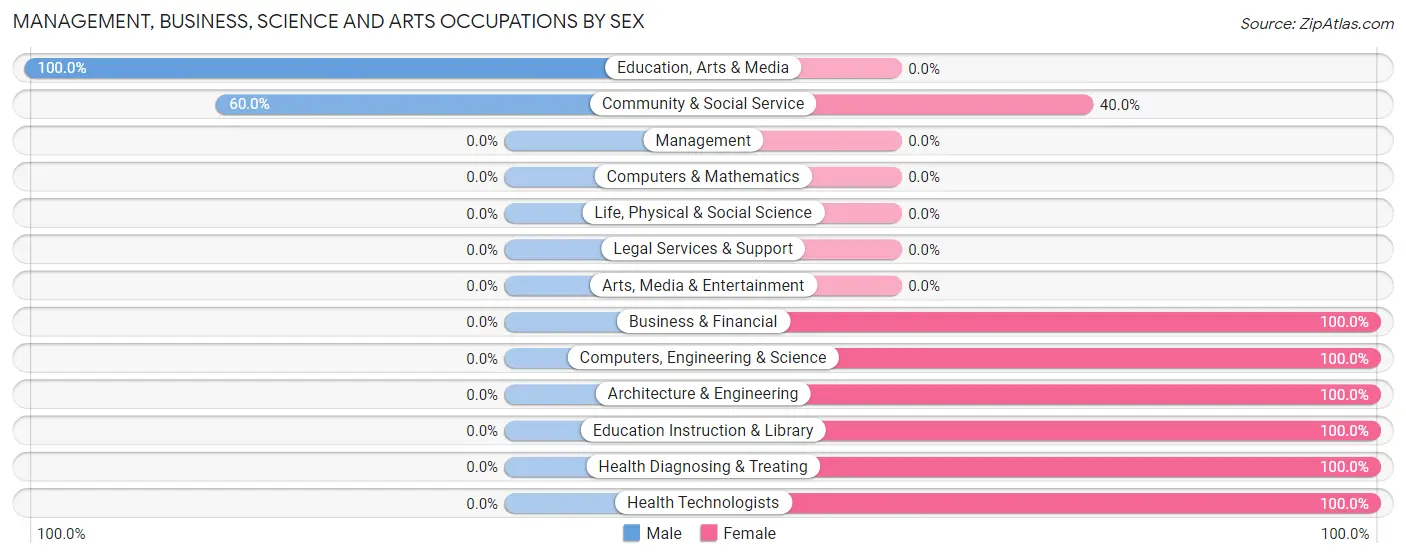
Management, Business, Science and Arts Occupations
The most common Management, Business, Science and Arts occupations in Bickleton are Community & Social Service (5 | 15.6%), Health Diagnosing & Treating (4 | 12.5%), Health Technologists (4 | 12.5%), Business & Financial (3 | 9.4%), and Education, Arts & Media (3 | 9.4%).
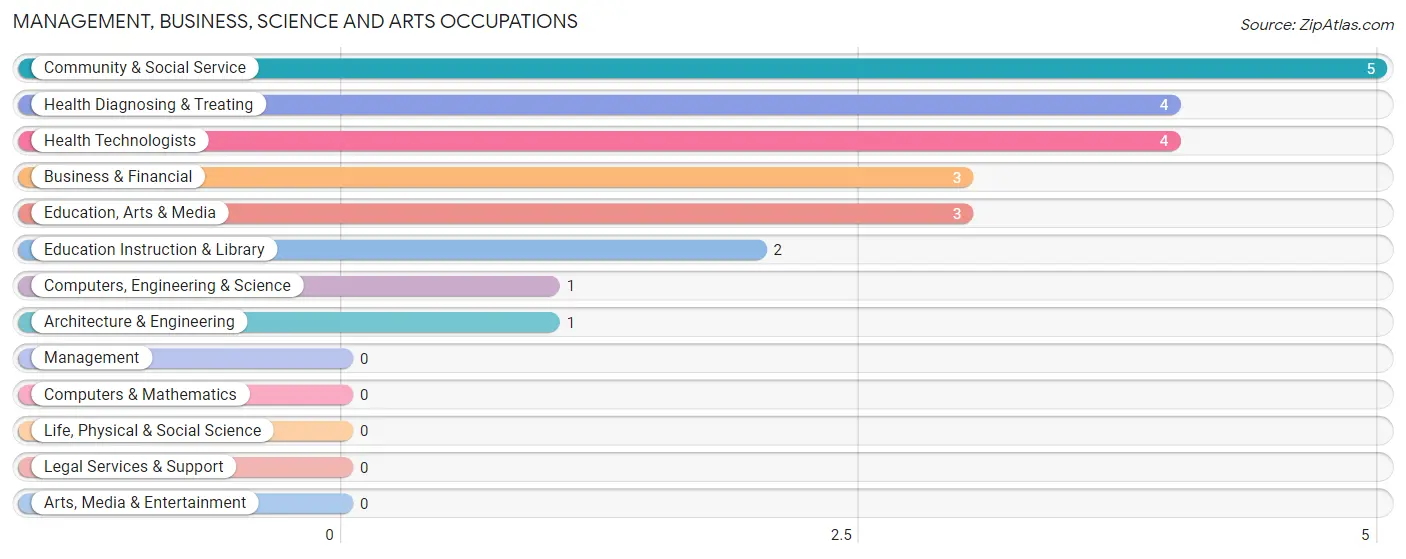
Management, Business, Science and Arts Occupations by Sex
Within the Management, Business, Science and Arts occupations in Bickleton, the most male-oriented occupations are Education, Arts & Media (100.0%), and Community & Social Service (60.0%), while the most female-oriented occupations are Business & Financial (100.0%), Computers, Engineering & Science (100.0%), and Architecture & Engineering (100.0%).
| Occupation | Male | Female |
| Management | 0 (0.0%) | 0 (0.0%) |
| Business & Financial | 0 (0.0%) | 3 (100.0%) |
| Computers, Engineering & Science | 0 (0.0%) | 1 (100.0%) |
| Computers & Mathematics | 0 (0.0%) | 0 (0.0%) |
| Architecture & Engineering | 0 (0.0%) | 1 (100.0%) |
| Life, Physical & Social Science | 0 (0.0%) | 0 (0.0%) |
| Community & Social Service | 3 (60.0%) | 2 (40.0%) |
| Education, Arts & Media | 3 (100.0%) | 0 (0.0%) |
| Legal Services & Support | 0 (0.0%) | 0 (0.0%) |
| Education Instruction & Library | 0 (0.0%) | 2 (100.0%) |
| Arts, Media & Entertainment | 0 (0.0%) | 0 (0.0%) |
| Health Diagnosing & Treating | 0 (0.0%) | 4 (100.0%) |
| Health Technologists | 0 (0.0%) | 4 (100.0%) |
| Total (Category) | 3 (23.1%) | 10 (76.9%) |
| Total (Overall) | 17 (53.1%) | 15 (46.9%) |
Services Occupations
Services Occupations by Sex
| Occupation | Male | Female |
| Healthcare Support | 0 (0.0%) | 0 (0.0%) |
| Security & Protection | 0 (0.0%) | 0 (0.0%) |
| Firefighting & Prevention | 0 (0.0%) | 0 (0.0%) |
| Law Enforcement | 0 (0.0%) | 0 (0.0%) |
| Food Preparation & Serving | 0 (0.0%) | 0 (0.0%) |
| Cleaning & Maintenance | 0 (0.0%) | 0 (0.0%) |
| Personal Care & Service | 0 (0.0%) | 0 (0.0%) |
| Total (Category) | 0 (0.0%) | 0 (0.0%) |
| Total (Overall) | 17 (53.1%) | 15 (46.9%) |
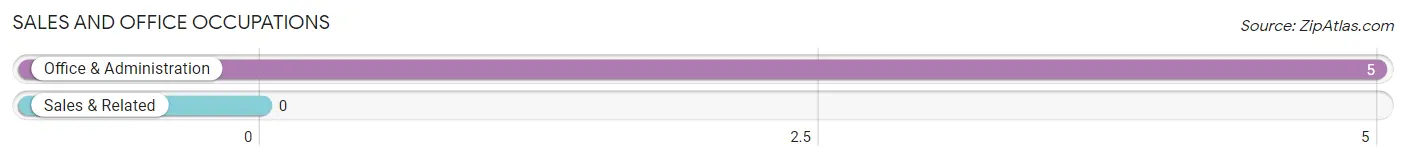
Sales and Office Occupations
The most common Sales and Office occupations in Bickleton are , and Office & Administration (5 | 15.6%).
Sales and Office Occupations by Sex
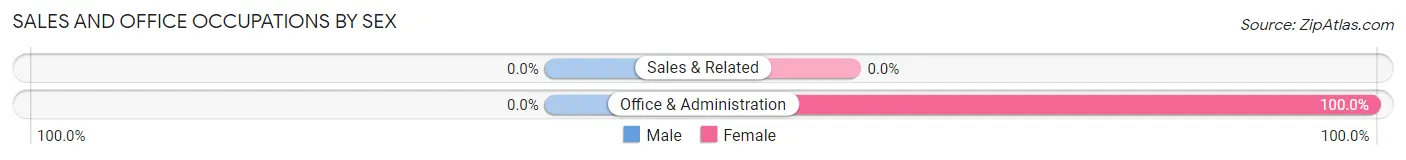
| Occupation | Male | Female |
| Sales & Related | 0 (0.0%) | 0 (0.0%) |
| Office & Administration | 0 (0.0%) | 5 (100.0%) |
| Total (Category) | 0 (0.0%) | 5 (100.0%) |
| Total (Overall) | 17 (53.1%) | 15 (46.9%) |
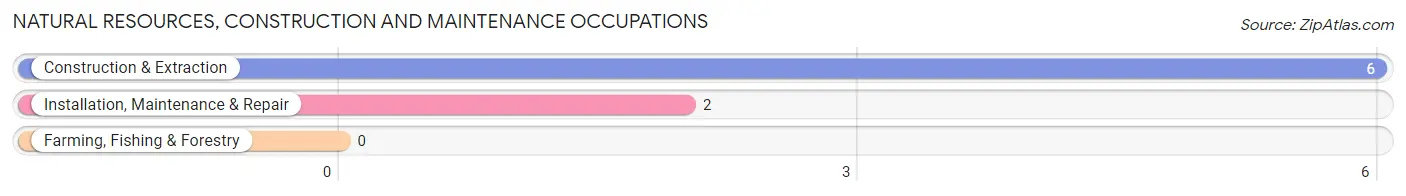
Natural Resources, Construction and Maintenance Occupations
The most common Natural Resources, Construction and Maintenance occupations in Bickleton are Construction & Extraction (6 | 18.8%), and Installation, Maintenance & Repair (2 | 6.2%).
Natural Resources, Construction and Maintenance Occupations by Sex
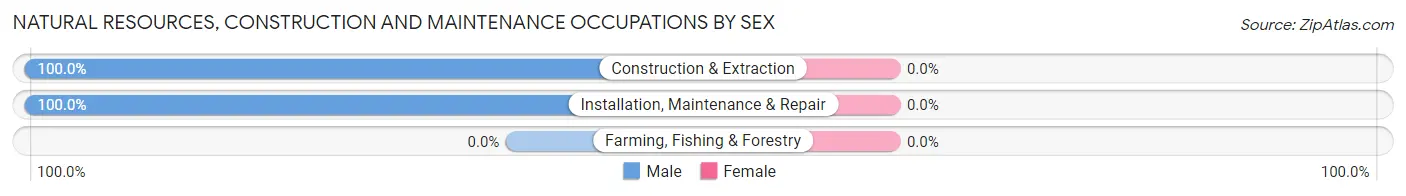
| Occupation | Male | Female |
| Farming, Fishing & Forestry | 0 (0.0%) | 0 (0.0%) |
| Construction & Extraction | 6 (100.0%) | 0 (0.0%) |
| Installation, Maintenance & Repair | 2 (100.0%) | 0 (0.0%) |
| Total (Category) | 8 (100.0%) | 0 (0.0%) |
| Total (Overall) | 17 (53.1%) | 15 (46.9%) |
Production, Transportation and Moving Occupations
The most common Production, Transportation and Moving occupations in Bickleton are Production (2 | 6.2%), Transportation (2 | 6.2%), and Material Moving (2 | 6.2%).
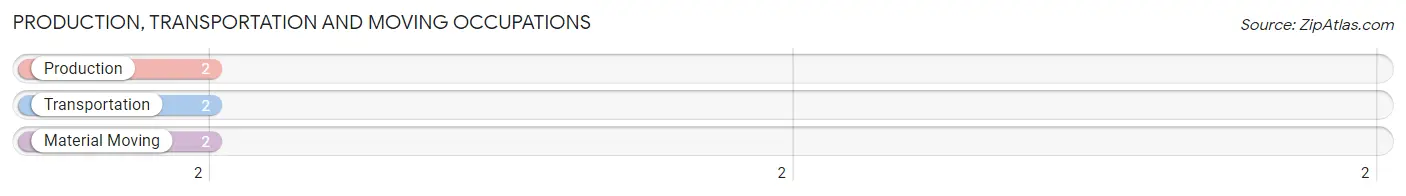
Production, Transportation and Moving Occupations by Sex

| Occupation | Male | Female |
| Production | 2 (100.0%) | 0 (0.0%) |
| Transportation | 2 (100.0%) | 0 (0.0%) |
| Material Moving | 2 (100.0%) | 0 (0.0%) |
| Total (Category) | 6 (100.0%) | 0 (0.0%) |
| Total (Overall) | 17 (53.1%) | 15 (46.9%) |
Employment Industries by Sex in Bickleton
Employment Industries in Bickleton
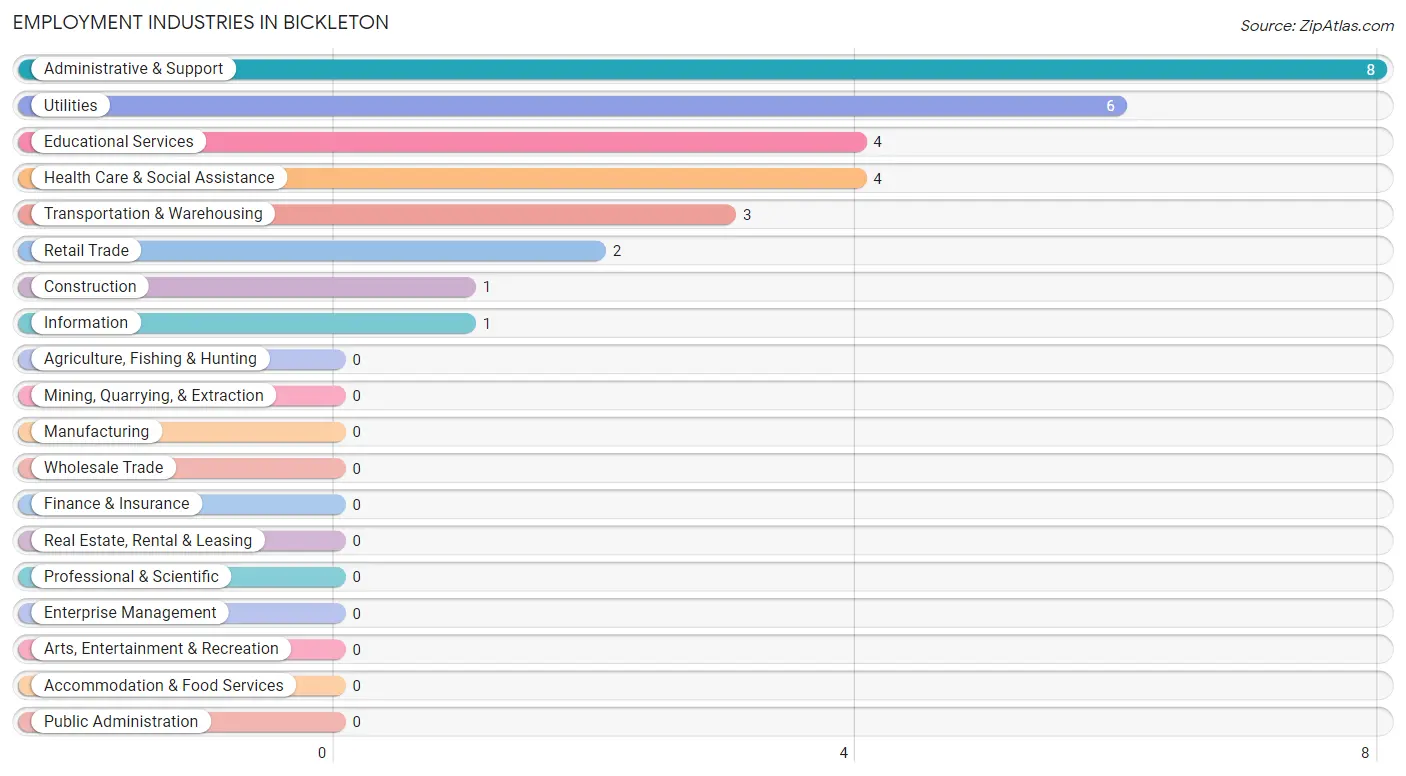
The major employment industries in Bickleton include Administrative & Support (8 | 25.0%), Utilities (6 | 18.8%), Educational Services (4 | 12.5%), Health Care & Social Assistance (4 | 12.5%), and Transportation & Warehousing (3 | 9.4%).
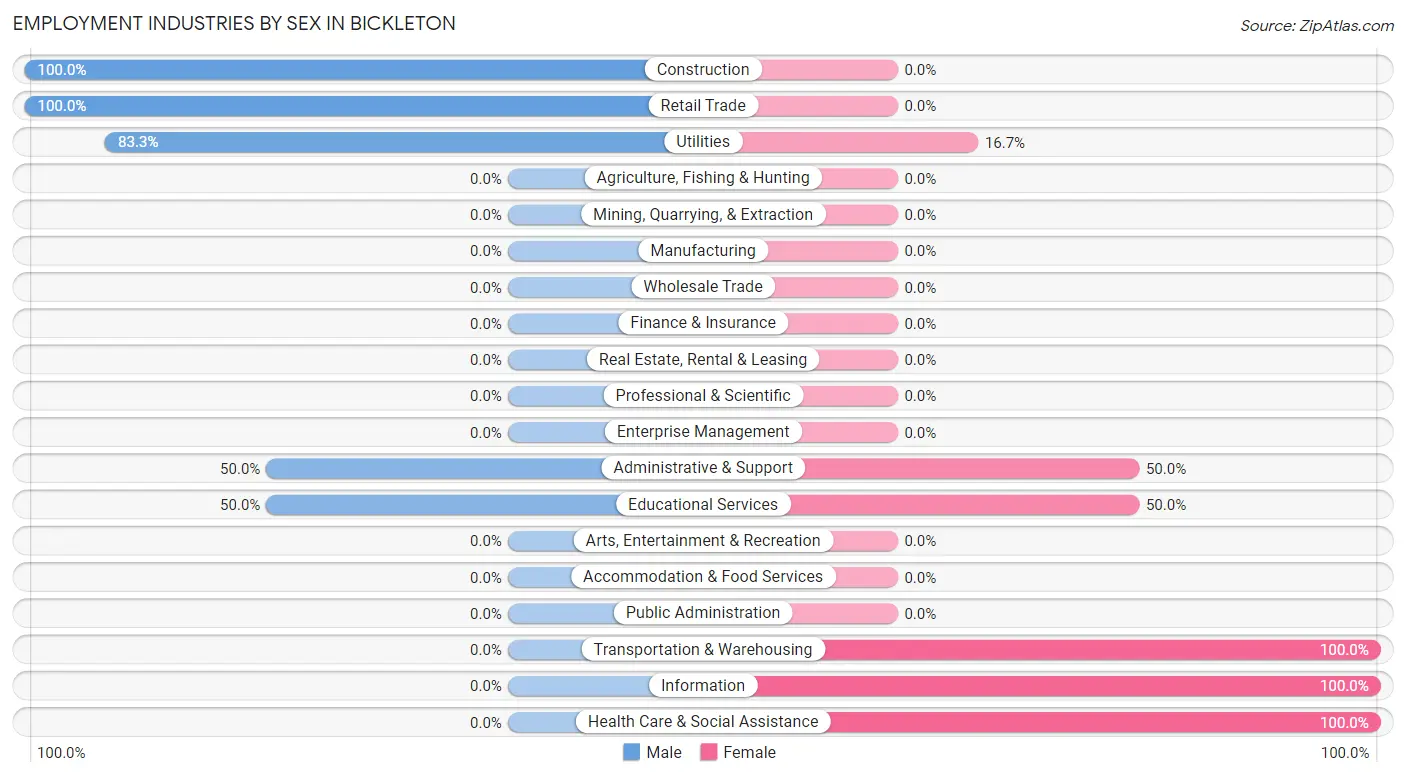
Employment Industries by Sex in Bickleton
The Bickleton industries that see more men than women are Construction (100.0%), Retail Trade (100.0%), and Utilities (83.3%), whereas the industries that tend to have a higher number of women are Transportation & Warehousing (100.0%), Information (100.0%), and Health Care & Social Assistance (100.0%).
| Industry | Male | Female |
| Agriculture, Fishing & Hunting | 0 (0.0%) | 0 (0.0%) |
| Mining, Quarrying, & Extraction | 0 (0.0%) | 0 (0.0%) |
| Construction | 1 (100.0%) | 0 (0.0%) |
| Manufacturing | 0 (0.0%) | 0 (0.0%) |
| Wholesale Trade | 0 (0.0%) | 0 (0.0%) |
| Retail Trade | 2 (100.0%) | 0 (0.0%) |
| Transportation & Warehousing | 0 (0.0%) | 3 (100.0%) |
| Utilities | 5 (83.3%) | 1 (16.7%) |
| Information | 0 (0.0%) | 1 (100.0%) |
| Finance & Insurance | 0 (0.0%) | 0 (0.0%) |
| Real Estate, Rental & Leasing | 0 (0.0%) | 0 (0.0%) |
| Professional & Scientific | 0 (0.0%) | 0 (0.0%) |
| Enterprise Management | 0 (0.0%) | 0 (0.0%) |
| Administrative & Support | 4 (50.0%) | 4 (50.0%) |
| Educational Services | 2 (50.0%) | 2 (50.0%) |
| Health Care & Social Assistance | 0 (0.0%) | 4 (100.0%) |
| Arts, Entertainment & Recreation | 0 (0.0%) | 0 (0.0%) |
| Accommodation & Food Services | 0 (0.0%) | 0 (0.0%) |
| Public Administration | 0 (0.0%) | 0 (0.0%) |
| Total | 17 (53.1%) | 15 (46.9%) |
Education in Bickleton
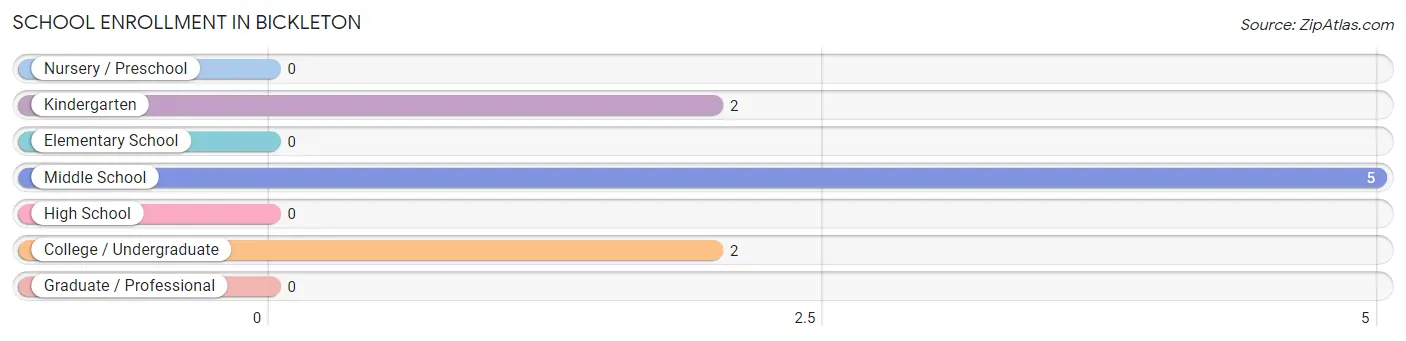
School Enrollment in Bickleton
The most common levels of schooling among the 9 students in Bickleton are middle school (5 | 55.6%), kindergarten (2 | 22.2%), and college / undergraduate (2 | 22.2%).
| School Level | # Students | % Students |
| Nursery / Preschool | 0 | 0.0% |
| Kindergarten | 2 | 22.2% |
| Elementary School | 0 | 0.0% |
| Middle School | 5 | 55.6% |
| High School | 0 | 0.0% |
| College / Undergraduate | 2 | 22.2% |
| Graduate / Professional | 0 | 0.0% |
| Total | 9 | 100.0% |
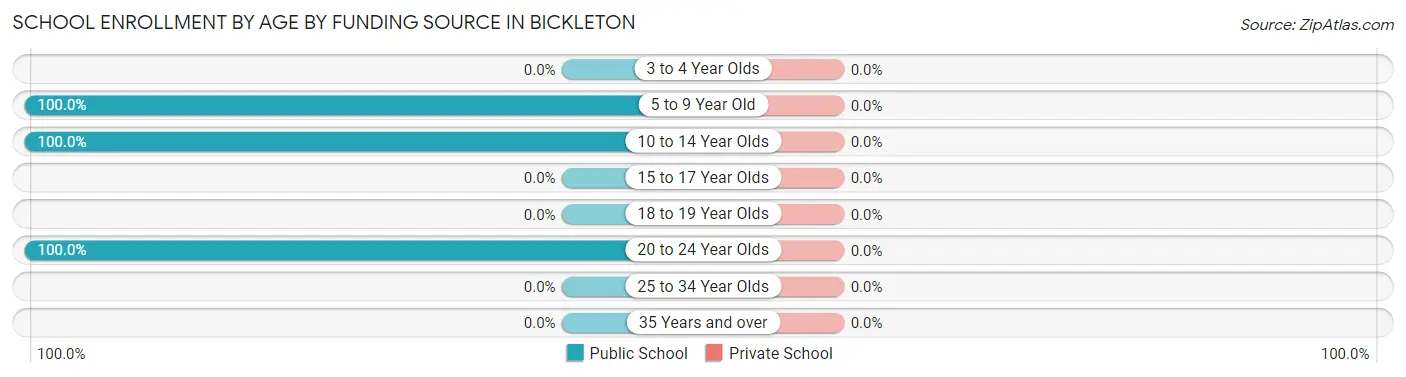
School Enrollment by Age by Funding Source in Bickleton
| Age Bracket | Public School | Private School |
| 3 to 4 Year Olds | 0 (0.0%) | 0 (0.0%) |
| 5 to 9 Year Old | 2 (100.0%) | 0 (0.0%) |
| 10 to 14 Year Olds | 5 (100.0%) | 0 (0.0%) |
| 15 to 17 Year Olds | 0 (0.0%) | 0 (0.0%) |
| 18 to 19 Year Olds | 0 (0.0%) | 0 (0.0%) |
| 20 to 24 Year Olds | 2 (100.0%) | 0 (0.0%) |
| 25 to 34 Year Olds | 0 (0.0%) | 0 (0.0%) |
| 35 Years and over | 0 (0.0%) | 0 (0.0%) |
| Total | 9 (100.0%) | 0 (0.0%) |
Educational Attainment by Field of Study in Bickleton
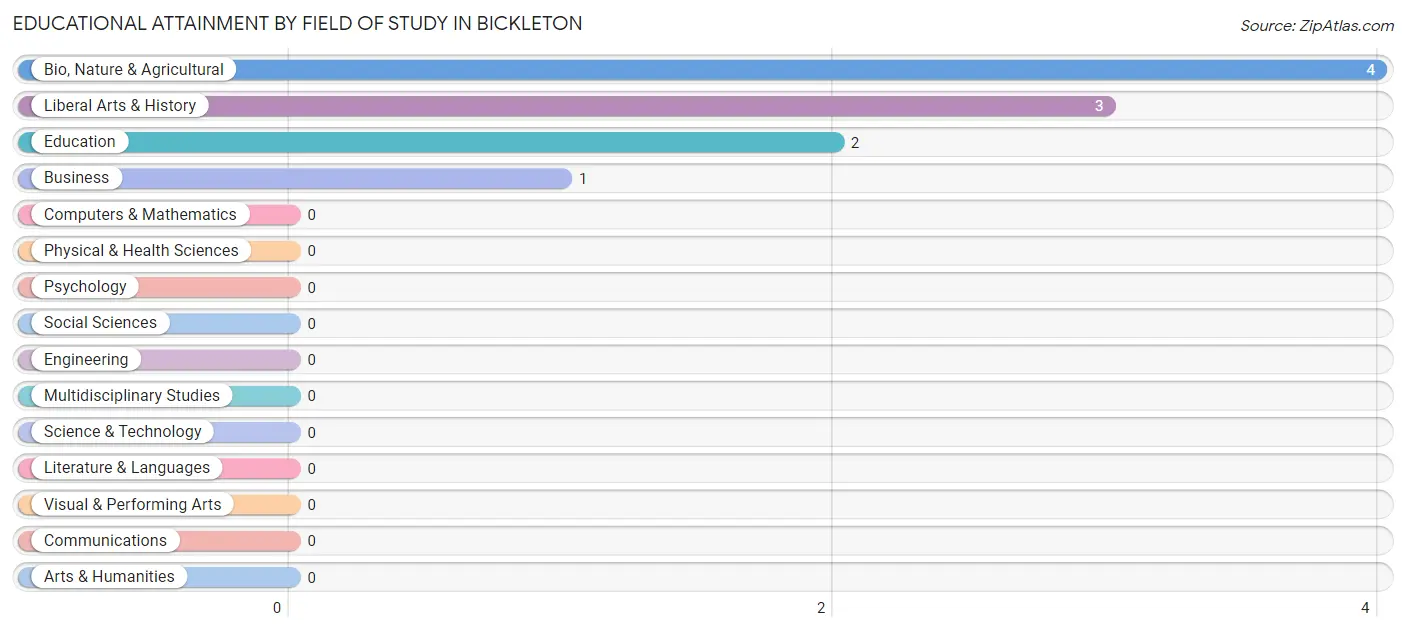
Bio, nature & agricultural (4 | 40.0%), liberal arts & history (3 | 30.0%), education (2 | 20.0%), and business (1 | 10.0%) are the most common fields of study among 10 individuals in Bickleton who have obtained a bachelor's degree or higher.
| Field of Study | # Graduates | % Graduates |
| Computers & Mathematics | 0 | 0.0% |
| Bio, Nature & Agricultural | 4 | 40.0% |
| Physical & Health Sciences | 0 | 0.0% |
| Psychology | 0 | 0.0% |
| Social Sciences | 0 | 0.0% |
| Engineering | 0 | 0.0% |
| Multidisciplinary Studies | 0 | 0.0% |
| Science & Technology | 0 | 0.0% |
| Business | 1 | 10.0% |
| Education | 2 | 20.0% |
| Literature & Languages | 0 | 0.0% |
| Liberal Arts & History | 3 | 30.0% |
| Visual & Performing Arts | 0 | 0.0% |
| Communications | 0 | 0.0% |
| Arts & Humanities | 0 | 0.0% |
| Total | 10 | 100.0% |
Transportation & Commute in Bickleton
Vehicle Availability by Sex in Bickleton
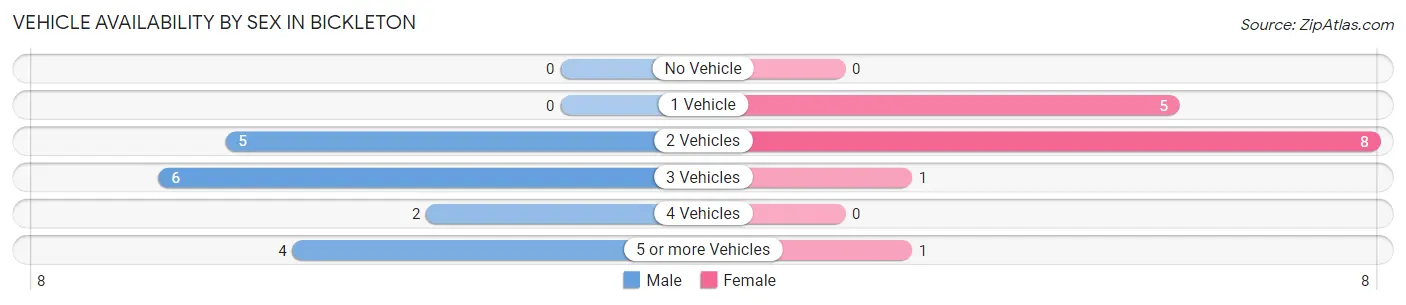
The most prevalent vehicle ownership categories in Bickleton are males with 3 vehicles (6, accounting for 35.3%) and females with 3 vehicles (1, making up 40.0%).
| Vehicles Available | Male | Female |
| No Vehicle | 0 (0.0%) | 0 (0.0%) |
| 1 Vehicle | 0 (0.0%) | 5 (33.3%) |
| 2 Vehicles | 5 (29.4%) | 8 (53.3%) |
| 3 Vehicles | 6 (35.3%) | 1 (6.7%) |
| 4 Vehicles | 2 (11.8%) | 0 (0.0%) |
| 5 or more Vehicles | 4 (23.5%) | 1 (6.7%) |
| Total | 17 (100.0%) | 15 (100.0%) |
Commute Time in Bickleton
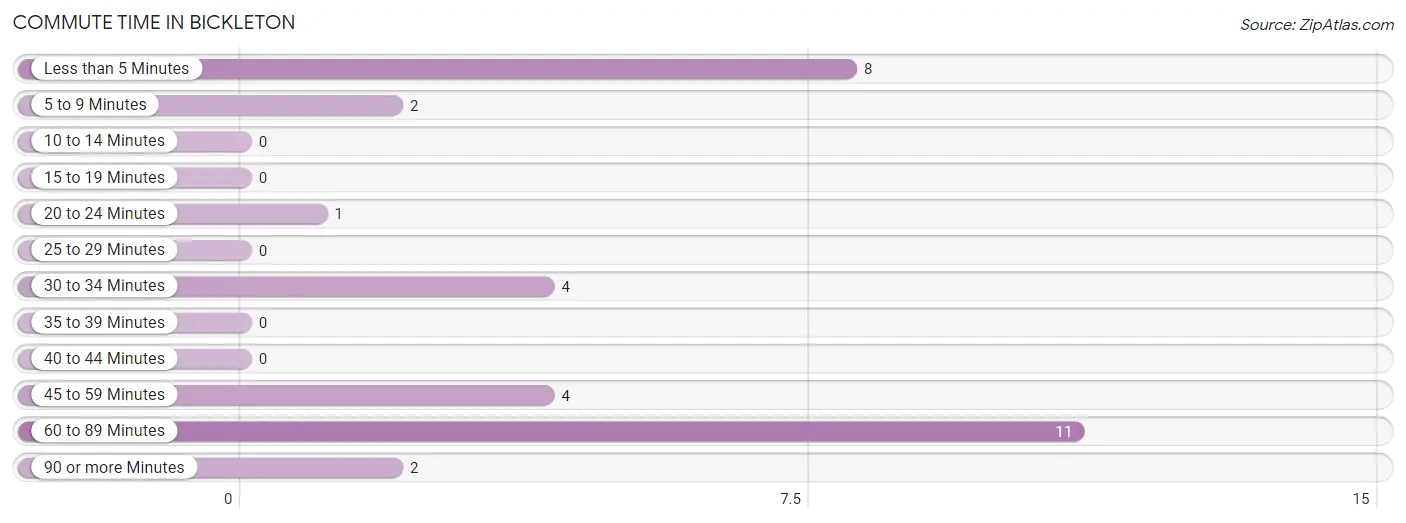
The most frequently occuring commute durations in Bickleton are 60 to 89 minutes (11 commuters, 34.4%), less than 5 minutes (8 commuters, 25.0%), and 30 to 34 minutes (4 commuters, 12.5%).
| Commute Time | # Commuters | % Commuters |
| Less than 5 Minutes | 8 | 25.0% |
| 5 to 9 Minutes | 2 | 6.2% |
| 10 to 14 Minutes | 0 | 0.0% |
| 15 to 19 Minutes | 0 | 0.0% |
| 20 to 24 Minutes | 1 | 3.1% |
| 25 to 29 Minutes | 0 | 0.0% |
| 30 to 34 Minutes | 4 | 12.5% |
| 35 to 39 Minutes | 0 | 0.0% |
| 40 to 44 Minutes | 0 | 0.0% |
| 45 to 59 Minutes | 4 | 12.5% |
| 60 to 89 Minutes | 11 | 34.4% |
| 90 or more Minutes | 2 | 6.2% |
Commute Time by Sex in Bickleton
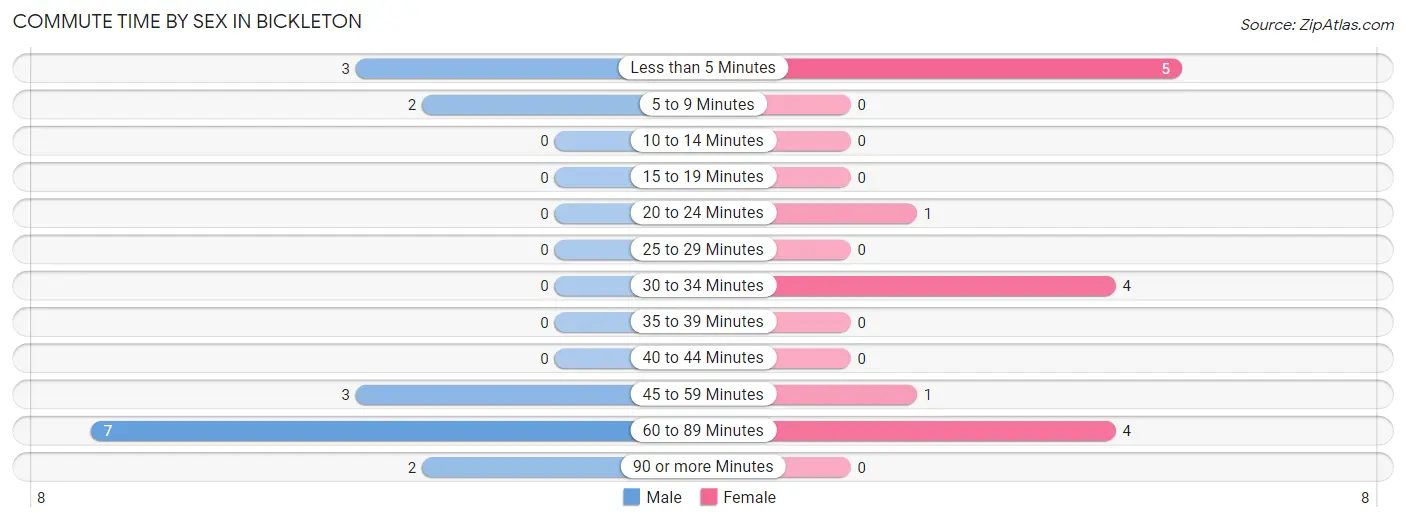
The most common commute times in Bickleton are 60 to 89 minutes (7 commuters, 41.2%) for males and less than 5 minutes (5 commuters, 33.3%) for females.
| Commute Time | Male | Female |
| Less than 5 Minutes | 3 (17.6%) | 5 (33.3%) |
| 5 to 9 Minutes | 2 (11.8%) | 0 (0.0%) |
| 10 to 14 Minutes | 0 (0.0%) | 0 (0.0%) |
| 15 to 19 Minutes | 0 (0.0%) | 0 (0.0%) |
| 20 to 24 Minutes | 0 (0.0%) | 1 (6.7%) |
| 25 to 29 Minutes | 0 (0.0%) | 0 (0.0%) |
| 30 to 34 Minutes | 0 (0.0%) | 4 (26.7%) |
| 35 to 39 Minutes | 0 (0.0%) | 0 (0.0%) |
| 40 to 44 Minutes | 0 (0.0%) | 0 (0.0%) |
| 45 to 59 Minutes | 3 (17.6%) | 1 (6.7%) |
| 60 to 89 Minutes | 7 (41.2%) | 4 (26.7%) |
| 90 or more Minutes | 2 (11.8%) | 0 (0.0%) |
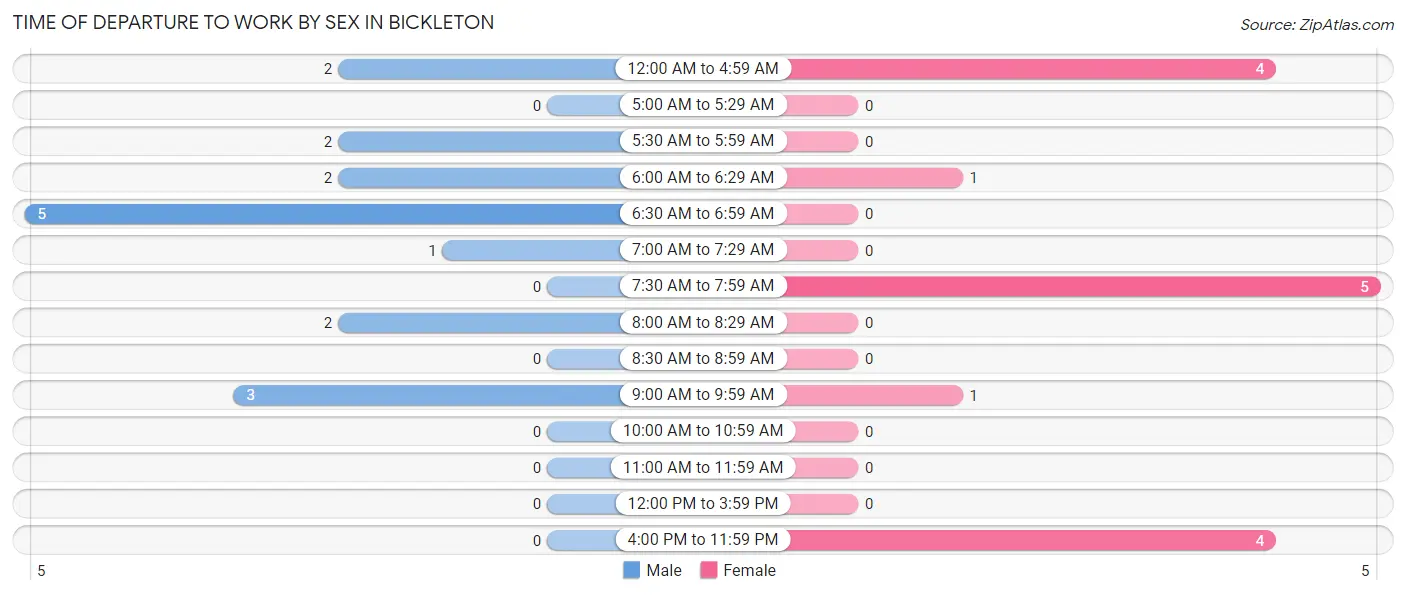
Time of Departure to Work by Sex in Bickleton
The most frequent times of departure to work in Bickleton are 6:30 AM to 6:59 AM (5, 29.4%) for males and 7:30 AM to 7:59 AM (5, 33.3%) for females.
| Time of Departure | Male | Female |
| 12:00 AM to 4:59 AM | 2 (11.8%) | 4 (26.7%) |
| 5:00 AM to 5:29 AM | 0 (0.0%) | 0 (0.0%) |
| 5:30 AM to 5:59 AM | 2 (11.8%) | 0 (0.0%) |
| 6:00 AM to 6:29 AM | 2 (11.8%) | 1 (6.7%) |
| 6:30 AM to 6:59 AM | 5 (29.4%) | 0 (0.0%) |
| 7:00 AM to 7:29 AM | 1 (5.9%) | 0 (0.0%) |
| 7:30 AM to 7:59 AM | 0 (0.0%) | 5 (33.3%) |
| 8:00 AM to 8:29 AM | 2 (11.8%) | 0 (0.0%) |
| 8:30 AM to 8:59 AM | 0 (0.0%) | 0 (0.0%) |
| 9:00 AM to 9:59 AM | 3 (17.6%) | 1 (6.7%) |
| 10:00 AM to 10:59 AM | 0 (0.0%) | 0 (0.0%) |
| 11:00 AM to 11:59 AM | 0 (0.0%) | 0 (0.0%) |
| 12:00 PM to 3:59 PM | 0 (0.0%) | 0 (0.0%) |
| 4:00 PM to 11:59 PM | 0 (0.0%) | 4 (26.7%) |
| Total | 17 (100.0%) | 15 (100.0%) |
Housing Occupancy in Bickleton
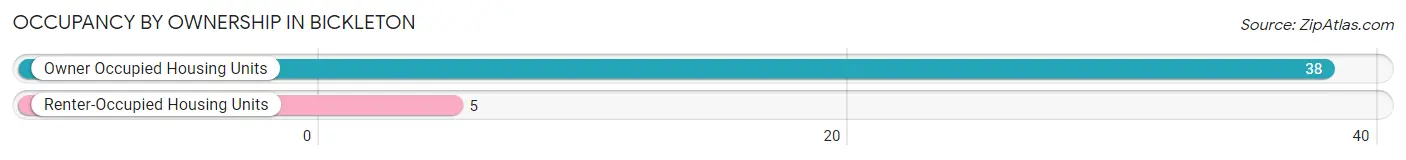
Occupancy by Ownership in Bickleton
Of the total 43 dwellings in Bickleton, owner-occupied units account for 38 (88.4%), while renter-occupied units make up 5 (11.6%).
| Occupancy | # Housing Units | % Housing Units |
| Owner Occupied Housing Units | 38 | 88.4% |
| Renter-Occupied Housing Units | 5 | 11.6% |
| Total Occupied Housing Units | 43 | 100.0% |
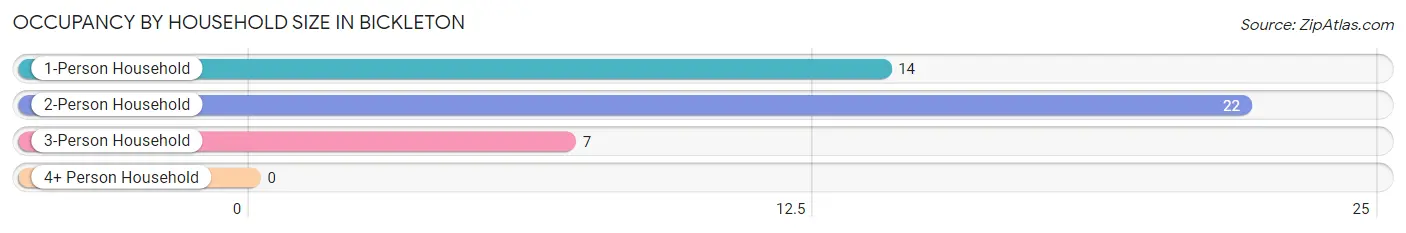
Occupancy by Household Size in Bickleton
| Household Size | # Housing Units | % Housing Units |
| 1-Person Household | 14 | 32.6% |
| 2-Person Household | 22 | 51.2% |
| 3-Person Household | 7 | 16.3% |
| 4+ Person Household | 0 | 0.0% |
| Total Housing Units | 43 | 100.0% |
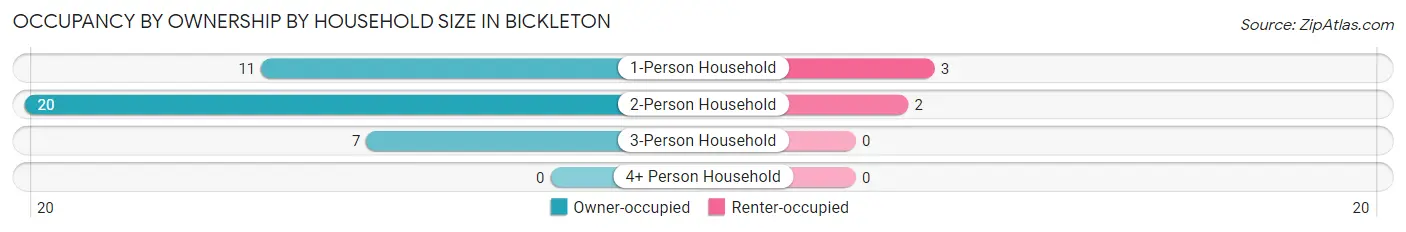
Occupancy by Ownership by Household Size in Bickleton
| Household Size | Owner-occupied | Renter-occupied |
| 1-Person Household | 11 (78.6%) | 3 (21.4%) |
| 2-Person Household | 20 (90.9%) | 2 (9.1%) |
| 3-Person Household | 7 (100.0%) | 0 (0.0%) |
| 4+ Person Household | 0 (0.0%) | 0 (0.0%) |
| Total Housing Units | 38 (88.4%) | 5 (11.6%) |
Occupancy by Educational Attainment in Bickleton
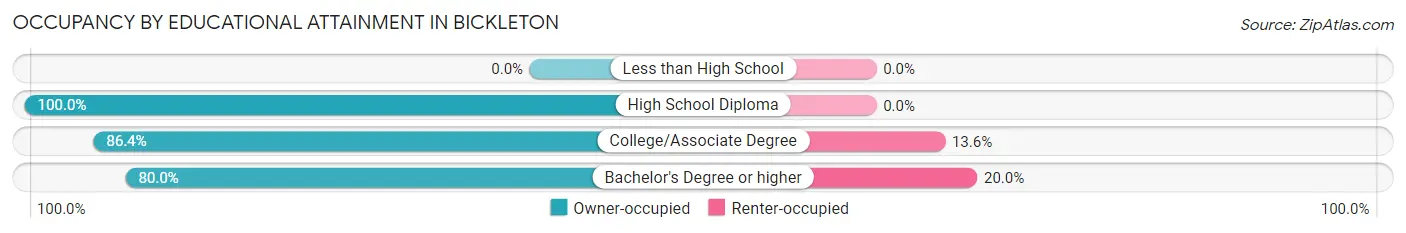
| Household Size | Owner-occupied | Renter-occupied |
| Less than High School | 0 (0.0%) | 0 (0.0%) |
| High School Diploma | 11 (100.0%) | 0 (0.0%) |
| College/Associate Degree | 19 (86.4%) | 3 (13.6%) |
| Bachelor's Degree or higher | 8 (80.0%) | 2 (20.0%) |
Occupancy by Age of Householder in Bickleton
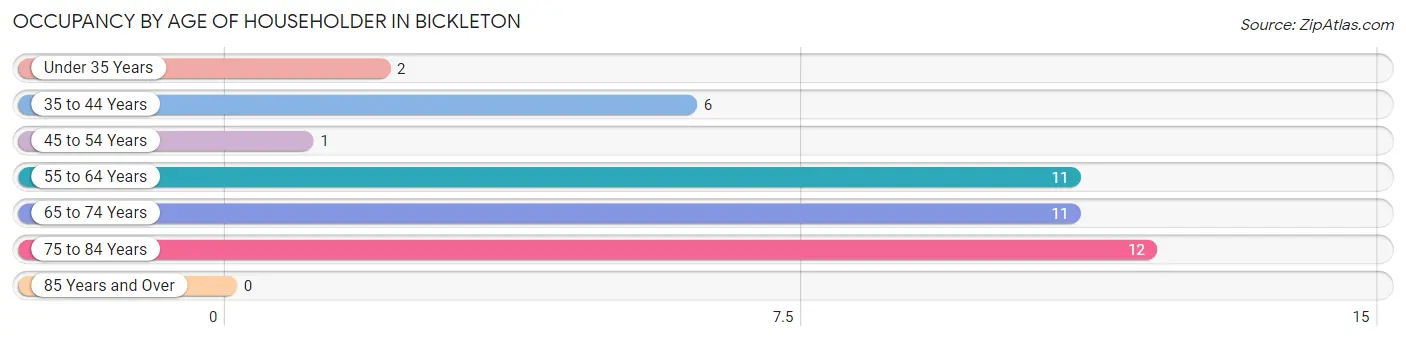
| Age Bracket | # Households | % Households |
| Under 35 Years | 2 | 4.6% |
| 35 to 44 Years | 6 | 14.0% |
| 45 to 54 Years | 1 | 2.3% |
| 55 to 64 Years | 11 | 25.6% |
| 65 to 74 Years | 11 | 25.6% |
| 75 to 84 Years | 12 | 27.9% |
| 85 Years and Over | 0 | 0.0% |
| Total | 43 | 100.0% |
Housing Finances in Bickleton
Median Income by Occupancy in Bickleton
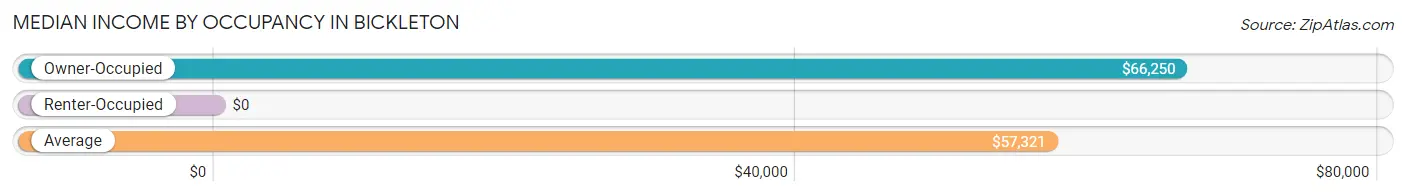
| Occupancy Type | # Households | Median Income |
| Owner-Occupied | 38 (88.4%) | $66,250 |
| Renter-Occupied | 5 (11.6%) | $0 |
| Average | 43 (100.0%) | $57,321 |
Occupancy by Householder Income Bracket in Bickleton
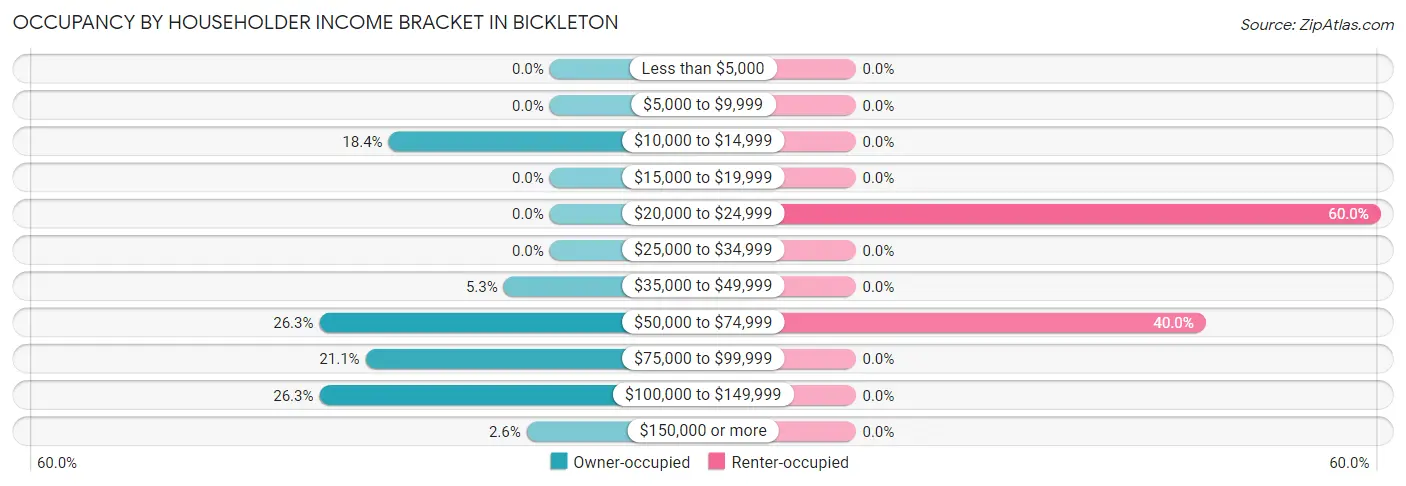
| Income Bracket | Owner-occupied | Renter-occupied |
| Less than $5,000 | 0 (0.0%) | 0 (0.0%) |
| $5,000 to $9,999 | 0 (0.0%) | 0 (0.0%) |
| $10,000 to $14,999 | 7 (18.4%) | 0 (0.0%) |
| $15,000 to $19,999 | 0 (0.0%) | 0 (0.0%) |
| $20,000 to $24,999 | 0 (0.0%) | 3 (60.0%) |
| $25,000 to $34,999 | 0 (0.0%) | 0 (0.0%) |
| $35,000 to $49,999 | 2 (5.3%) | 0 (0.0%) |
| $50,000 to $74,999 | 10 (26.3%) | 2 (40.0%) |
| $75,000 to $99,999 | 8 (21.0%) | 0 (0.0%) |
| $100,000 to $149,999 | 10 (26.3%) | 0 (0.0%) |
| $150,000 or more | 1 (2.6%) | 0 (0.0%) |
| Total | 38 (100.0%) | 5 (100.0%) |
Monthly Housing Cost Tiers in Bickleton
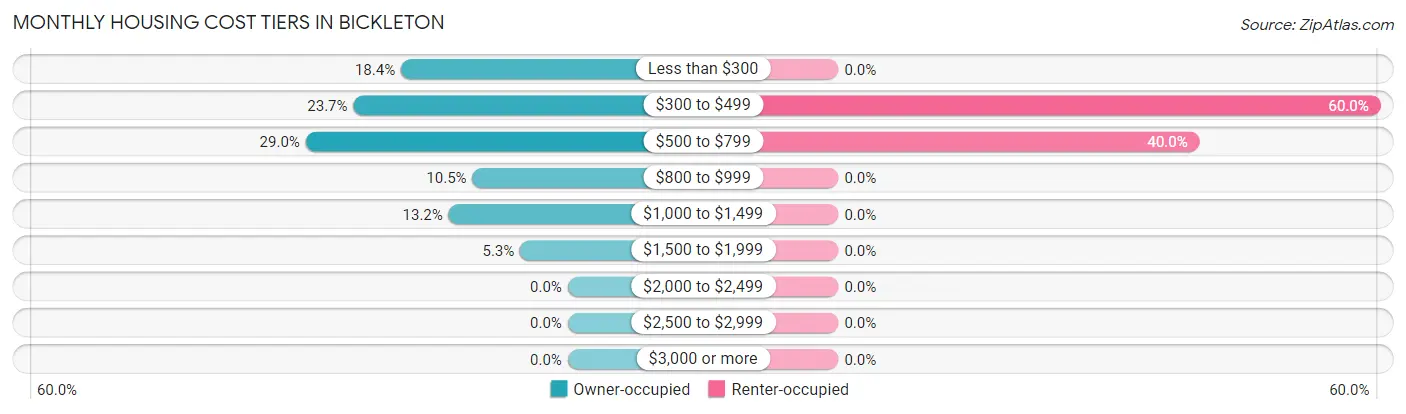
| Monthly Cost | Owner-occupied | Renter-occupied |
| Less than $300 | 7 (18.4%) | 0 (0.0%) |
| $300 to $499 | 9 (23.7%) | 3 (60.0%) |
| $500 to $799 | 11 (28.9%) | 2 (40.0%) |
| $800 to $999 | 4 (10.5%) | 0 (0.0%) |
| $1,000 to $1,499 | 5 (13.2%) | 0 (0.0%) |
| $1,500 to $1,999 | 2 (5.3%) | 0 (0.0%) |
| $2,000 to $2,499 | 0 (0.0%) | 0 (0.0%) |
| $2,500 to $2,999 | 0 (0.0%) | 0 (0.0%) |
| $3,000 or more | 0 (0.0%) | 0 (0.0%) |
| Total | 38 (100.0%) | 5 (100.0%) |
Physical Housing Characteristics in Bickleton
Housing Structures in Bickleton
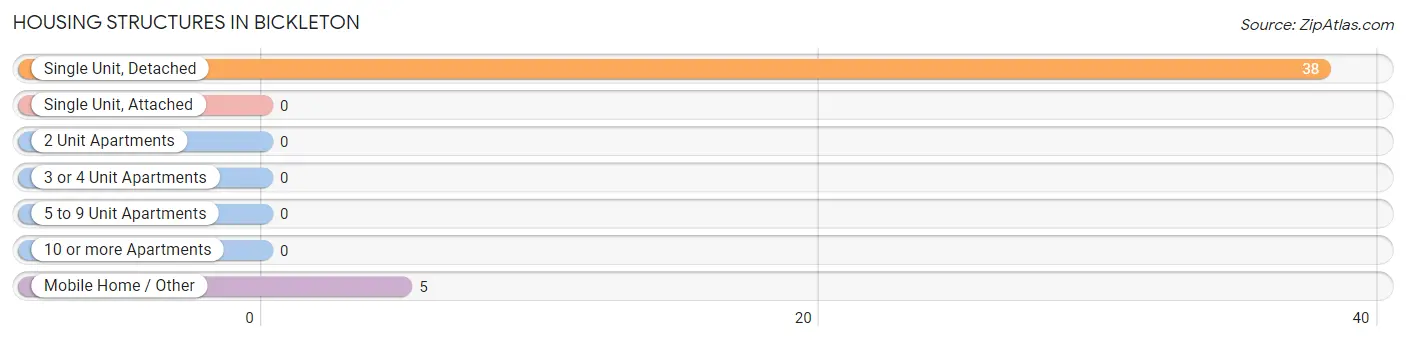
| Structure Type | # Housing Units | % Housing Units |
| Single Unit, Detached | 38 | 88.4% |
| Single Unit, Attached | 0 | 0.0% |
| 2 Unit Apartments | 0 | 0.0% |
| 3 or 4 Unit Apartments | 0 | 0.0% |
| 5 to 9 Unit Apartments | 0 | 0.0% |
| 10 or more Apartments | 0 | 0.0% |
| Mobile Home / Other | 5 | 11.6% |
| Total | 43 | 100.0% |
Housing Structures by Occupancy in Bickleton
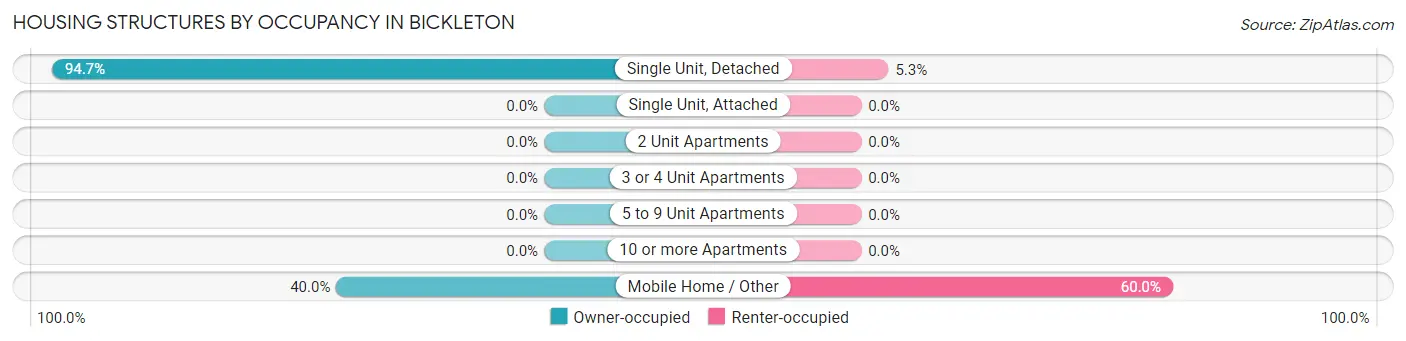
| Structure Type | Owner-occupied | Renter-occupied |
| Single Unit, Detached | 36 (94.7%) | 2 (5.3%) |
| Single Unit, Attached | 0 (0.0%) | 0 (0.0%) |
| 2 Unit Apartments | 0 (0.0%) | 0 (0.0%) |
| 3 or 4 Unit Apartments | 0 (0.0%) | 0 (0.0%) |
| 5 to 9 Unit Apartments | 0 (0.0%) | 0 (0.0%) |
| 10 or more Apartments | 0 (0.0%) | 0 (0.0%) |
| Mobile Home / Other | 2 (40.0%) | 3 (60.0%) |
| Total | 38 (88.4%) | 5 (11.6%) |
Housing Structures by Number of Rooms in Bickleton
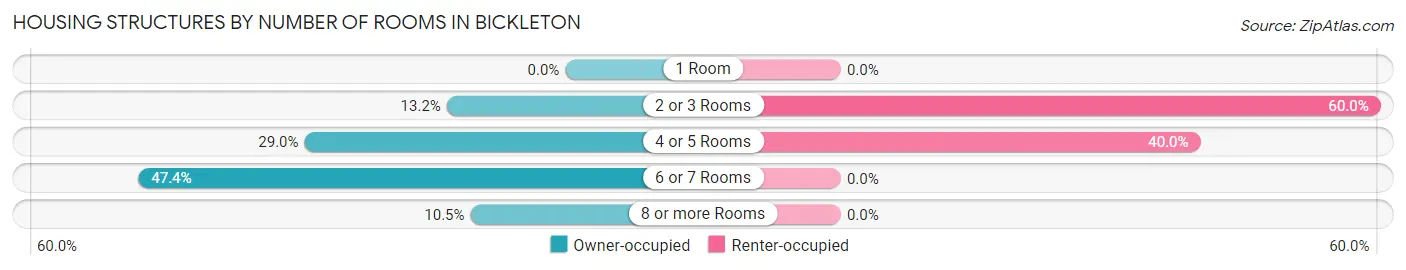
| Number of Rooms | Owner-occupied | Renter-occupied |
| 1 Room | 0 (0.0%) | 0 (0.0%) |
| 2 or 3 Rooms | 5 (13.2%) | 3 (60.0%) |
| 4 or 5 Rooms | 11 (28.9%) | 2 (40.0%) |
| 6 or 7 Rooms | 18 (47.4%) | 0 (0.0%) |
| 8 or more Rooms | 4 (10.5%) | 0 (0.0%) |
| Total | 38 (100.0%) | 5 (100.0%) |
Housing Structure by Heating Type in Bickleton
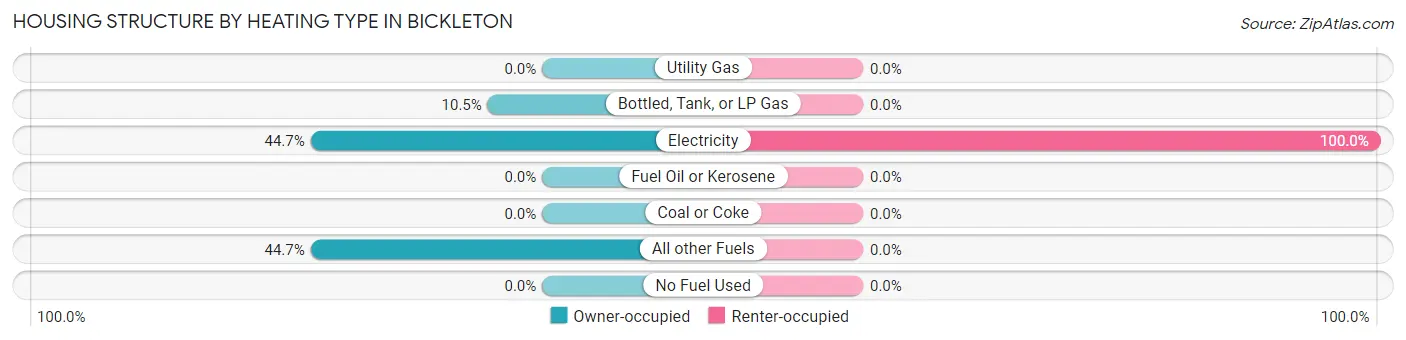
| Heating Type | Owner-occupied | Renter-occupied |
| Utility Gas | 0 (0.0%) | 0 (0.0%) |
| Bottled, Tank, or LP Gas | 4 (10.5%) | 0 (0.0%) |
| Electricity | 17 (44.7%) | 5 (100.0%) |
| Fuel Oil or Kerosene | 0 (0.0%) | 0 (0.0%) |
| Coal or Coke | 0 (0.0%) | 0 (0.0%) |
| All other Fuels | 17 (44.7%) | 0 (0.0%) |
| No Fuel Used | 0 (0.0%) | 0 (0.0%) |
| Total | 38 (100.0%) | 5 (100.0%) |
Household Vehicle Usage in Bickleton
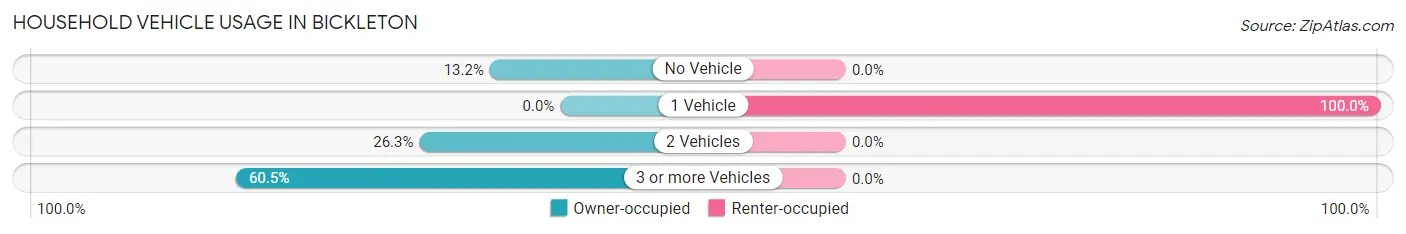
| Vehicles per Household | Owner-occupied | Renter-occupied |
| No Vehicle | 5 (13.2%) | 0 (0.0%) |
| 1 Vehicle | 0 (0.0%) | 5 (100.0%) |
| 2 Vehicles | 10 (26.3%) | 0 (0.0%) |
| 3 or more Vehicles | 23 (60.5%) | 0 (0.0%) |
| Total | 38 (100.0%) | 5 (100.0%) |
Real Estate & Mortgages in Bickleton
Real Estate and Mortgage Overview in Bickleton
| Characteristic | Without Mortgage | With Mortgage |
| Housing Units | 27 | 11 |
| Median Property Value | $148,200 | $171,900 |
| Median Household Income | $56,250 | $1 |
| Monthly Housing Costs | $417 | $0 |
| Real Estate Taxes | $957 | $0 |
Property Value by Mortgage Status in Bickleton
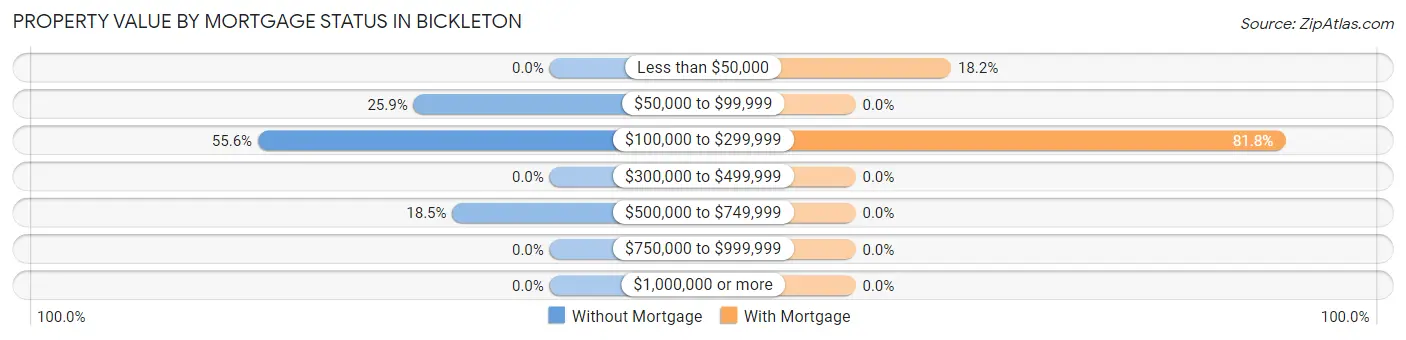
| Property Value | Without Mortgage | With Mortgage |
| Less than $50,000 | 0 (0.0%) | 2 (18.2%) |
| $50,000 to $99,999 | 7 (25.9%) | 0 (0.0%) |
| $100,000 to $299,999 | 15 (55.6%) | 9 (81.8%) |
| $300,000 to $499,999 | 0 (0.0%) | 0 (0.0%) |
| $500,000 to $749,999 | 5 (18.5%) | 0 (0.0%) |
| $750,000 to $999,999 | 0 (0.0%) | 0 (0.0%) |
| $1,000,000 or more | 0 (0.0%) | 0 (0.0%) |
| Total | 27 (100.0%) | 11 (100.0%) |
Household Income by Mortgage Status in Bickleton
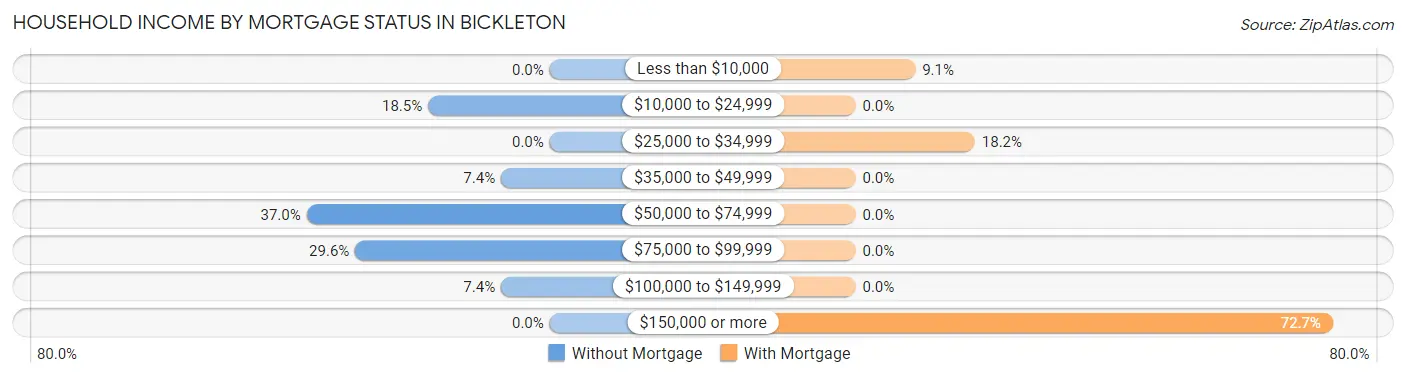
| Household Income | Without Mortgage | With Mortgage |
| Less than $10,000 | 0 (0.0%) | 1 (9.1%) |
| $10,000 to $24,999 | 5 (18.5%) | 0 (0.0%) |
| $25,000 to $34,999 | 0 (0.0%) | 2 (18.2%) |
| $35,000 to $49,999 | 2 (7.4%) | 0 (0.0%) |
| $50,000 to $74,999 | 10 (37.0%) | 0 (0.0%) |
| $75,000 to $99,999 | 8 (29.6%) | 0 (0.0%) |
| $100,000 to $149,999 | 2 (7.4%) | 0 (0.0%) |
| $150,000 or more | 0 (0.0%) | 8 (72.7%) |
| Total | 27 (100.0%) | 11 (100.0%) |
Property Value to Household Income Ratio in Bickleton
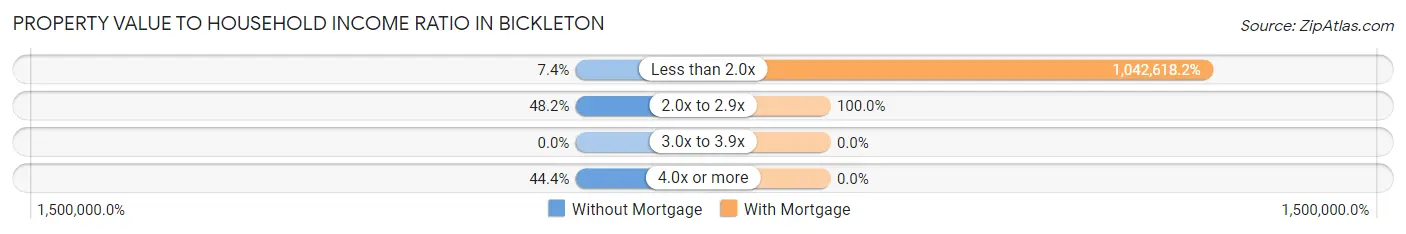
| Value-to-Income Ratio | Without Mortgage | With Mortgage |
| Less than 2.0x | 2 (7.4%) | 114,688 (1,042,618.2%) |
| 2.0x to 2.9x | 13 (48.1%) | 11 (100.0%) |
| 3.0x to 3.9x | 0 (0.0%) | 0 (0.0%) |
| 4.0x or more | 12 (44.4%) | 0 (0.0%) |
| Total | 27 (100.0%) | 11 (100.0%) |
Real Estate Taxes by Mortgage Status in Bickleton
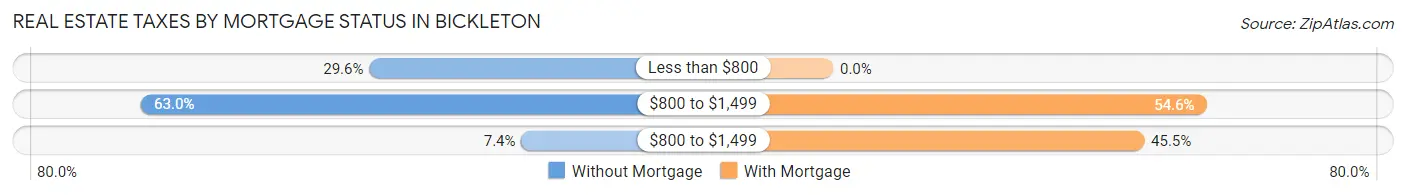
| Property Taxes | Without Mortgage | With Mortgage |
| Less than $800 | 8 (29.6%) | 0 (0.0%) |
| $800 to $1,499 | 17 (63.0%) | 6 (54.5%) |
| $800 to $1,499 | 2 (7.4%) | 5 (45.5%) |
| Total | 27 (100.0%) | 11 (100.0%) |
Health & Disability in Bickleton
Health Insurance Coverage by Age in Bickleton
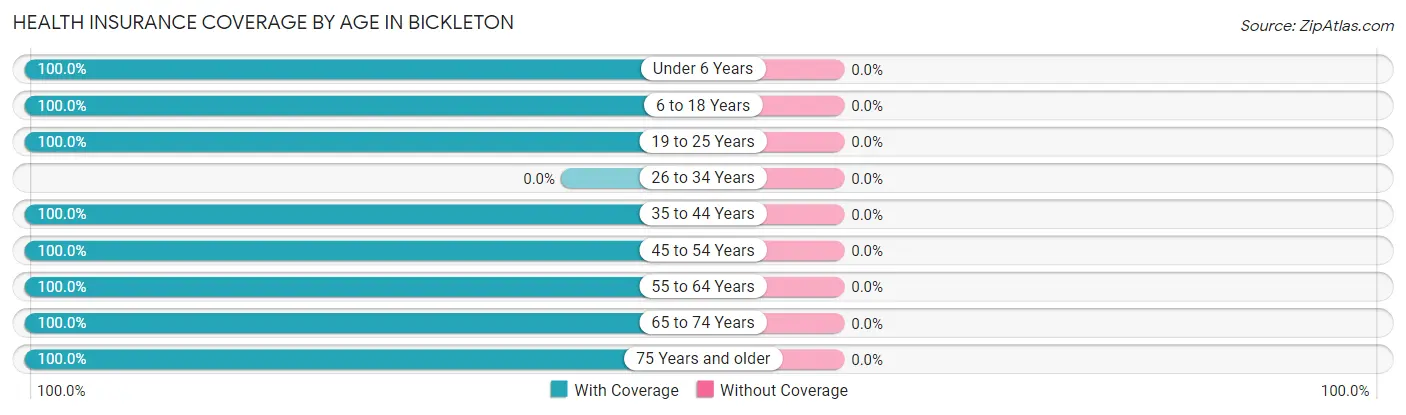
| Age Bracket | With Coverage | Without Coverage |
| Under 6 Years | 4 (100.0%) | 0 (0.0%) |
| 6 to 18 Years | 7 (100.0%) | 0 (0.0%) |
| 19 to 25 Years | 4 (100.0%) | 0 (0.0%) |
| 26 to 34 Years | 0 (0.0%) | 0 (0.0%) |
| 35 to 44 Years | 6 (100.0%) | 0 (0.0%) |
| 45 to 54 Years | 8 (100.0%) | 0 (0.0%) |
| 55 to 64 Years | 16 (100.0%) | 0 (0.0%) |
| 65 to 74 Years | 16 (100.0%) | 0 (0.0%) |
| 75 Years and older | 17 (100.0%) | 0 (0.0%) |
| Total | 78 (100.0%) | 0 (0.0%) |
Health Insurance Coverage by Citizenship Status in Bickleton
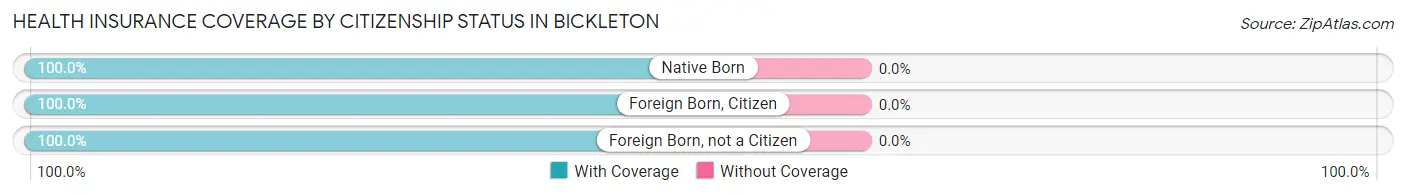
| Citizenship Status | With Coverage | Without Coverage |
| Native Born | 4 (100.0%) | 0 (0.0%) |
| Foreign Born, Citizen | 7 (100.0%) | 0 (0.0%) |
| Foreign Born, not a Citizen | 4 (100.0%) | 0 (0.0%) |
Health Insurance Coverage by Household Income in Bickleton
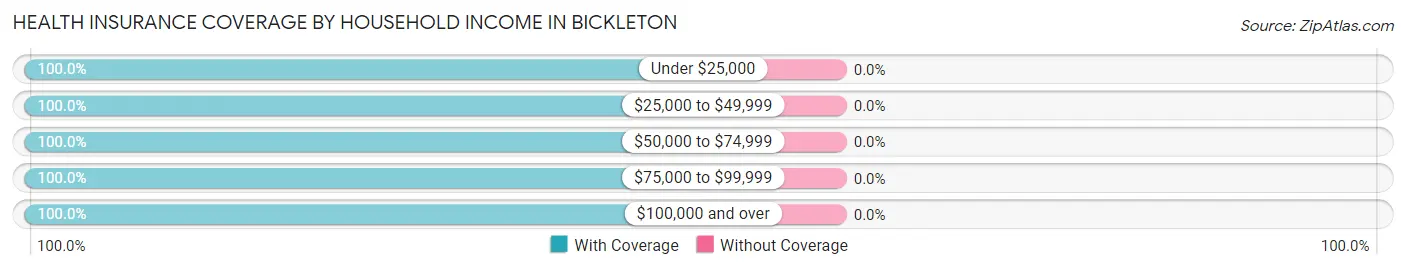
| Household Income | With Coverage | Without Coverage |
| Under $25,000 | 10 (100.0%) | 0 (0.0%) |
| $25,000 to $49,999 | 6 (100.0%) | 0 (0.0%) |
| $50,000 to $74,999 | 21 (100.0%) | 0 (0.0%) |
| $75,000 to $99,999 | 18 (100.0%) | 0 (0.0%) |
| $100,000 and over | 23 (100.0%) | 0 (0.0%) |
Public vs Private Health Insurance Coverage by Age in Bickleton
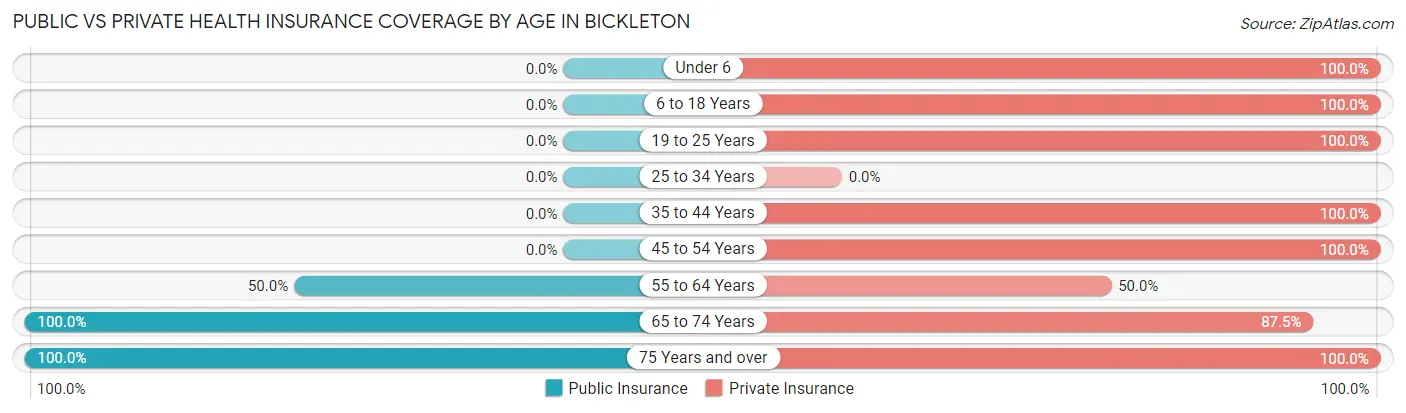
| Age Bracket | Public Insurance | Private Insurance |
| Under 6 | 0 (0.0%) | 4 (100.0%) |
| 6 to 18 Years | 0 (0.0%) | 7 (100.0%) |
| 19 to 25 Years | 0 (0.0%) | 4 (100.0%) |
| 25 to 34 Years | 0 (0.0%) | 0 (0.0%) |
| 35 to 44 Years | 0 (0.0%) | 6 (100.0%) |
| 45 to 54 Years | 0 (0.0%) | 8 (100.0%) |
| 55 to 64 Years | 8 (50.0%) | 8 (50.0%) |
| 65 to 74 Years | 16 (100.0%) | 14 (87.5%) |
| 75 Years and over | 17 (100.0%) | 17 (100.0%) |
| Total | 41 (52.6%) | 68 (87.2%) |
Disability Status by Sex by Age in Bickleton
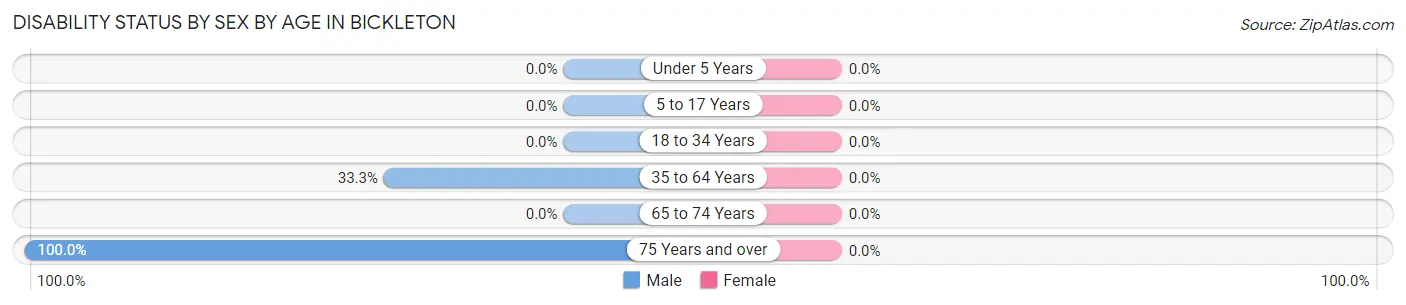
| Age Bracket | Male | Female |
| Under 5 Years | 0 (0.0%) | 0 (0.0%) |
| 5 to 17 Years | 0 (0.0%) | 0 (0.0%) |
| 18 to 34 Years | 0 (0.0%) | 0 (0.0%) |
| 35 to 64 Years | 5 (33.3%) | 0 (0.0%) |
| 65 to 74 Years | 0 (0.0%) | 0 (0.0%) |
| 75 Years and over | 10 (100.0%) | 0 (0.0%) |
Disability Class by Sex by Age in Bickleton
Disability Class: Hearing Difficulty
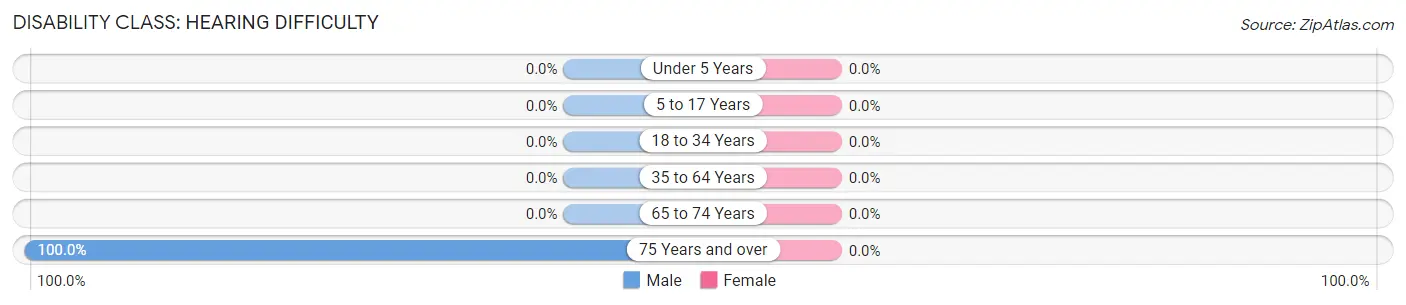
| Age Bracket | Male | Female |
| Under 5 Years | 0 (0.0%) | 0 (0.0%) |
| 5 to 17 Years | 0 (0.0%) | 0 (0.0%) |
| 18 to 34 Years | 0 (0.0%) | 0 (0.0%) |
| 35 to 64 Years | 0 (0.0%) | 0 (0.0%) |
| 65 to 74 Years | 0 (0.0%) | 0 (0.0%) |
| 75 Years and over | 10 (100.0%) | 0 (0.0%) |
Disability Class: Vision Difficulty
| Age Bracket | Male | Female |
| Under 5 Years | 0 (0.0%) | 0 (0.0%) |
| 5 to 17 Years | 0 (0.0%) | 0 (0.0%) |
| 18 to 34 Years | 0 (0.0%) | 0 (0.0%) |
| 35 to 64 Years | 0 (0.0%) | 0 (0.0%) |
| 65 to 74 Years | 0 (0.0%) | 0 (0.0%) |
| 75 Years and over | 0 (0.0%) | 0 (0.0%) |
Disability Class: Cognitive Difficulty
| Age Bracket | Male | Female |
| 5 to 17 Years | 0 (0.0%) | 0 (0.0%) |
| 18 to 34 Years | 0 (0.0%) | 0 (0.0%) |
| 35 to 64 Years | 0 (0.0%) | 0 (0.0%) |
| 65 to 74 Years | 0 (0.0%) | 0 (0.0%) |
| 75 Years and over | 0 (0.0%) | 0 (0.0%) |
Disability Class: Ambulatory Difficulty
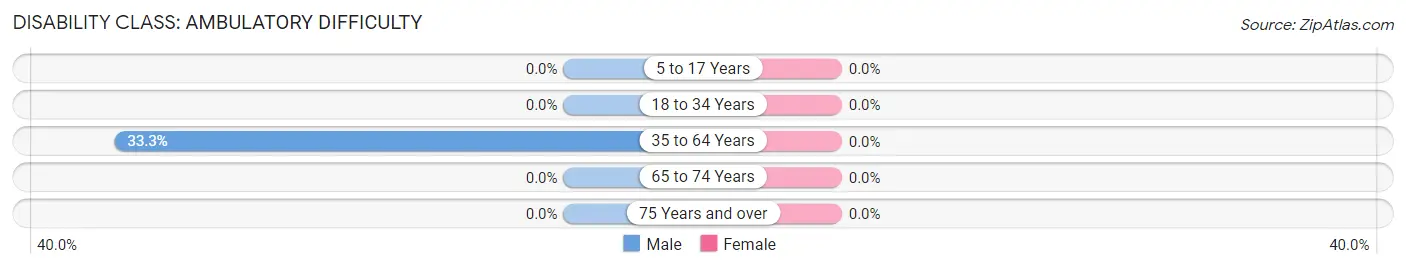
| Age Bracket | Male | Female |
| 5 to 17 Years | 0 (0.0%) | 0 (0.0%) |
| 18 to 34 Years | 0 (0.0%) | 0 (0.0%) |
| 35 to 64 Years | 5 (33.3%) | 0 (0.0%) |
| 65 to 74 Years | 0 (0.0%) | 0 (0.0%) |
| 75 Years and over | 0 (0.0%) | 0 (0.0%) |
Disability Class: Self-Care Difficulty
| Age Bracket | Male | Female |
| 5 to 17 Years | 0 (0.0%) | 0 (0.0%) |
| 18 to 34 Years | 0 (0.0%) | 0 (0.0%) |
| 35 to 64 Years | 0 (0.0%) | 0 (0.0%) |
| 65 to 74 Years | 0 (0.0%) | 0 (0.0%) |
| 75 Years and over | 0 (0.0%) | 0 (0.0%) |
Technology Access in Bickleton
Computing Device Access in Bickleton
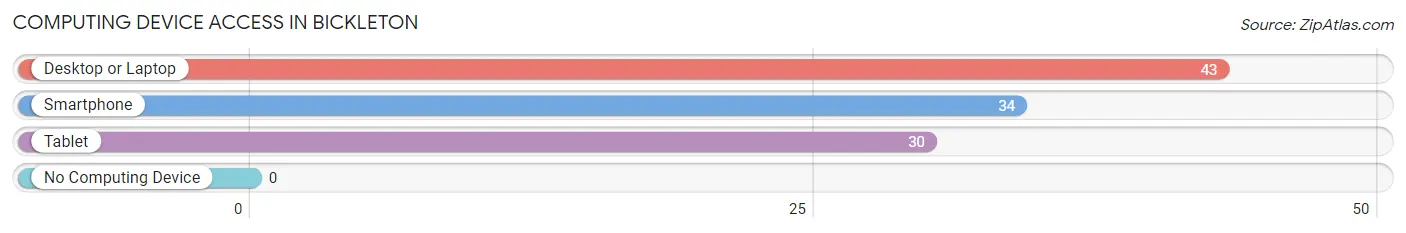
| Device Type | # Households | % Households |
| Desktop or Laptop | 43 | 100.0% |
| Smartphone | 34 | 79.1% |
| Tablet | 30 | 69.8% |
| No Computing Device | 0 | 0.0% |
| Total | 43 | 100.0% |
Internet Access in Bickleton
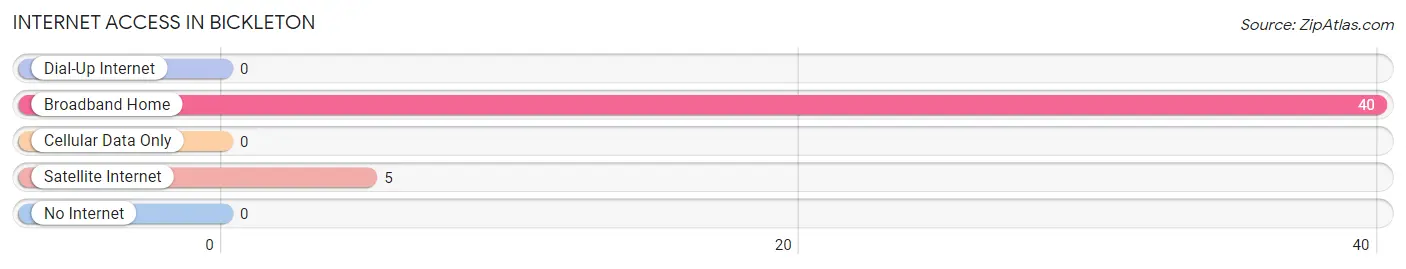
| Internet Type | # Households | % Households |
| Dial-Up Internet | 0 | 0.0% |
| Broadband Home | 40 | 93.0% |
| Cellular Data Only | 0 | 0.0% |
| Satellite Internet | 5 | 11.6% |
| No Internet | 0 | 0.0% |
| Total | 43 | 100.0% |
Bickleton Summary
Bickleton is a small town located in the southeastern corner of Washington State, in the United States. It is situated in the foothills of the Cascade Mountains, and is part of the Yakima Valley. The town has a population of approximately 200 people, and is located in Klickitat County.
History
Bickleton was founded in 1891 by a group of settlers from the Midwest. The town was named after the Bickleton family, who were among the first settlers. The town was originally a farming community, and the main crops grown were wheat, barley, and oats. In the early 1900s, the town began to grow and prosper, and by the 1920s, it had become a thriving community.
In the 1930s, the town was hit hard by the Great Depression, and many of the businesses and farms in the area closed. However, the town was able to survive, and in the 1940s, it began to experience a resurgence. The town was home to a number of businesses, including a general store, a bank, a hotel, and a movie theater.
In the 1950s, the town began to decline again, as many of the businesses closed and the population began to dwindle. However, in the late 1970s, the town began to experience a revival, as new businesses opened and the population began to grow again. Today, Bickleton is a small, rural community, with a population of approximately 200 people.
Geography
Bickleton is located in the southeastern corner of Washington State, in the United States. It is situated in the foothills of the Cascade Mountains, and is part of the Yakima Valley. The town is located at an elevation of 1,890 feet (576 meters), and is surrounded by rolling hills and farmland. The town is located approximately 30 miles (48 kilometers) east of Yakima, and is accessible via State Route 22.
Economy
The economy of Bickleton is largely based on agriculture. The town is home to a number of farms, which produce a variety of crops, including wheat, barley, oats, and hay. The town is also home to a number of small businesses, including a general store, a bank, a hotel, and a movie theater.
Demographics
As of the 2010 census, the population of Bickleton was approximately 200 people. The town is predominantly white, with a small Hispanic population. The median household income in the town is $35,000, and the median home value is $90,000. The town has a low unemployment rate, and the majority of the population is employed in the agricultural sector.
Common Questions
What is Per Capita Income in Bickleton?
Per Capita income in Bickleton is $36,308.
What is the Median Family Income in Bickleton?
Median Family Income in Bickleton is $75,250.
What is the Median Household income in Bickleton?
Median Household Income in Bickleton is $57,321.
What is Inequality or Gini Index in Bickleton?
Inequality or Gini Index in Bickleton is 0.34.
What is the Total Population of Bickleton?
Total Population of Bickleton is 78.
What is the Total Male Population of Bickleton?
Total Male Population of Bickleton is 36.
What is the Total Female Population of Bickleton?
Total Female Population of Bickleton is 42.
What is the Ratio of Males per 100 Females in Bickleton?
There are 85.71 Males per 100 Females in Bickleton.
What is the Ratio of Females per 100 Males in Bickleton?
There are 116.67 Females per 100 Males in Bickleton.
What is the Median Population Age in Bickleton?
Median Population Age in Bickleton is 59.5 Years.
What is the Average Family Size in Bickleton
Average Family Size in Bickleton is 2.1 People.
What is the Average Household Size in Bickleton
Average Household Size in Bickleton is 1.8 People.
How Large is the Labor Force in Bickleton?
There are 32 People in the Labor Forcein in Bickleton.
What is the Percentage of People in the Labor Force in Bickleton?
46.4% of People are in the Labor Force in Bickleton.