Zip Codes with the Highest Percentage of Population Employed in Health Diagnosing & Treating in Bellingham, WA
RELATED REPORTS & OPTIONS
Health Diagnosing & Treating
Bellingham
Compare Zip Codes
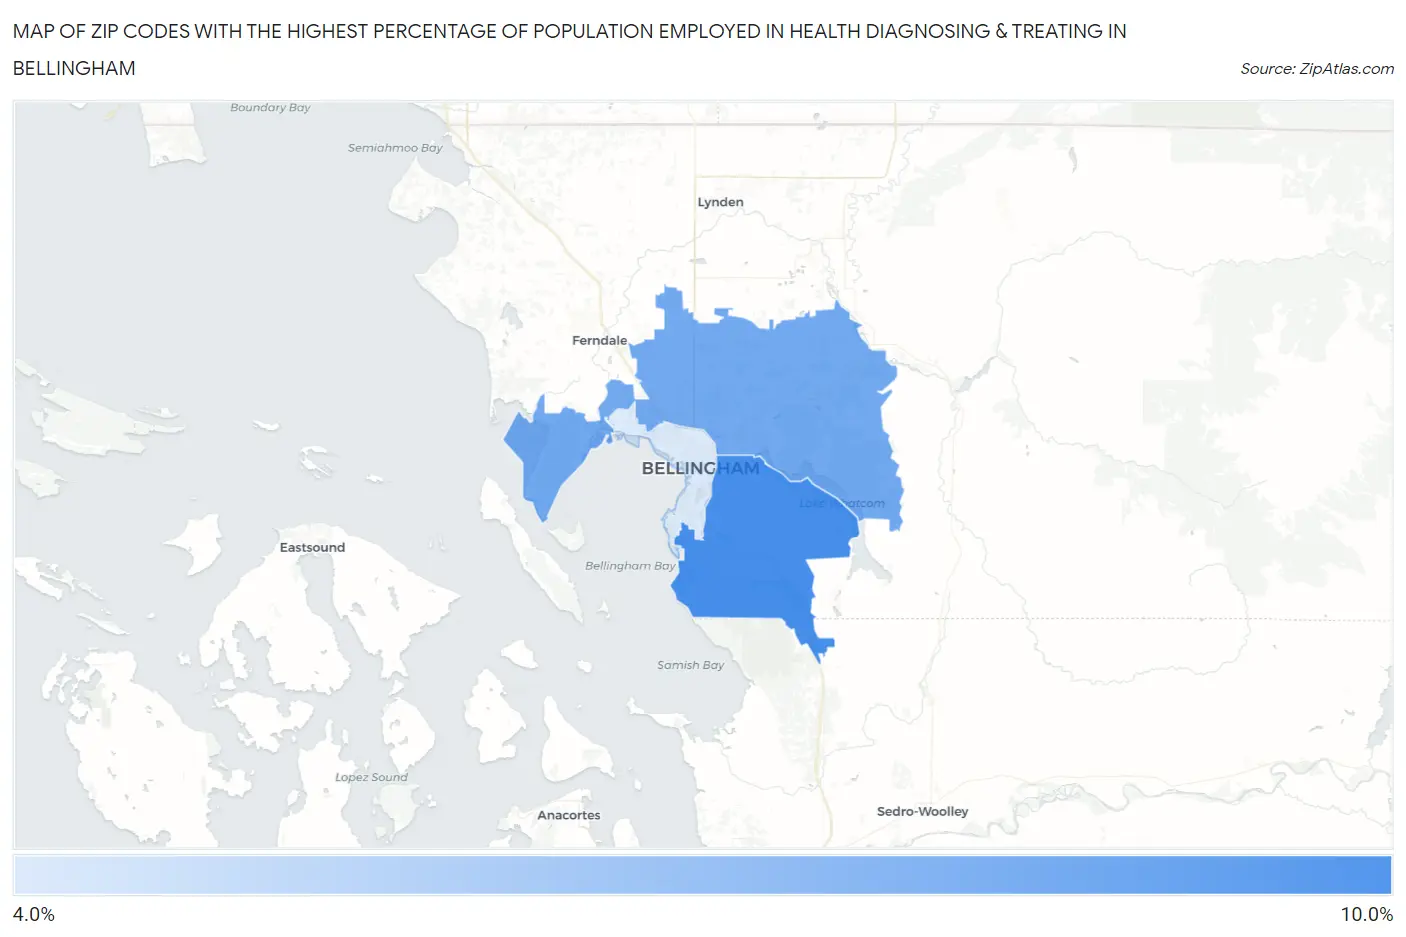
Map of Zip Codes with the Highest Percentage of Population Employed in Health Diagnosing & Treating in Bellingham
4.8%
8.2%
Zip Codes with the Highest Percentage of Population Employed in Health Diagnosing & Treating in Bellingham, WA
| Zip Code | % Employed | vs State | vs National | |
| 1. | 98229 | 8.2% | 5.6%(+2.68)#65 | 6.2%(+1.99)#6,935 |
| 2. | 98226 | 7.2% | 5.6%(+1.69)#108 | 6.2%(+0.999)#9,585 |
| 3. | 98225 | 4.8% | 5.6%(-0.756)#291 | 6.2%(-1.45)#18,501 |
1
Common Questions
What are the Top Zip Codes with the Highest Percentage of Population Employed in Health Diagnosing & Treating in Bellingham, WA?
Top Zip Codes with the Highest Percentage of Population Employed in Health Diagnosing & Treating in Bellingham, WA are:
What zip code has the Highest Percentage of Population Employed in Health Diagnosing & Treating in Bellingham, WA?
98229 has the Highest Percentage of Population Employed in Health Diagnosing & Treating in Bellingham, WA with 8.2%.
What is the Percentage of Population Employed in Health Diagnosing & Treating in Bellingham, WA?
Percentage of Population Employed in Health Diagnosing & Treating in Bellingham is 6.1%.
What is the Percentage of Population Employed in Health Diagnosing & Treating in Washington?
Percentage of Population Employed in Health Diagnosing & Treating in Washington is 5.6%.
What is the Percentage of Population Employed in Health Diagnosing & Treating in the United States?
Percentage of Population Employed in Health Diagnosing & Treating in the United States is 6.2%.