Gorst, WA Map & Demographics
Gorst Map
Gorst Overview
$33,231
PER CAPITA INCOME
$125,296
AVG FAMILY INCOME
$114,464
AVG HOUSEHOLD INCOME
67.4%
WAGE / INCOME GAP [ % ]
32.6¢/ $1
WAGE / INCOME GAP [ $ ]
0.23
INEQUALITY / GINI INDEX
495
TOTAL POPULATION
187
MALE POPULATION
308
FEMALE POPULATION
60.71
MALES / 100 FEMALES
164.71
FEMALES / 100 MALES
40.4
MEDIAN AGE
2.9
AVG FAMILY SIZE
2.7
AVG HOUSEHOLD SIZE
255
LABOR FORCE [ PEOPLE ]
79.7%
PERCENT IN LABOR FORCE
10.2%
UNEMPLOYMENT RATE
Gorst Area Codes
Income in Gorst
Income Overview in Gorst
Per Capita Income in Gorst is $33,231, while median incomes of families and households are $125,296 and $114,464 respectively.
| Characteristic | Number | Measure |
| Per Capita Income | 495 | $33,231 |
| Median Family Income | 162 | $125,296 |
| Mean Family Income | 162 | $94,348 |
| Median Household Income | 186 | $114,464 |
| Mean Household Income | 186 | $93,705 |
| Income Deficit | 162 | $0 |
| Wage / Income Gap (%) | 495 | 67.40% |
| Wage / Income Gap ($) | 495 | 32.60¢ per $1 |
| Gini / Inequality Index | 495 | 0.23 |
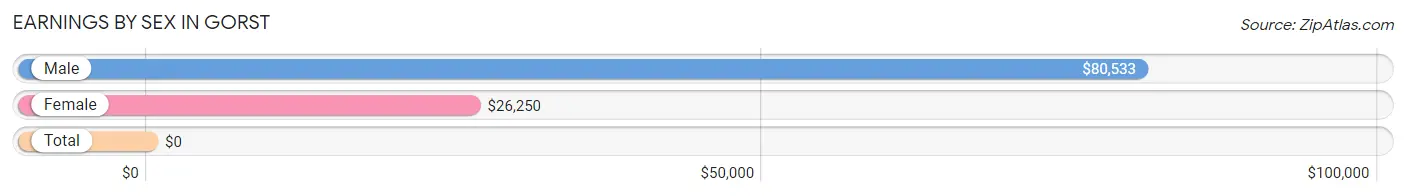
Earnings by Sex in Gorst
| Sex | Number | Average Earnings |
| Male | 148 (60.9%) | $80,533 |
| Female | 95 (39.1%) | $26,250 |
| Total | 243 (100.0%) | $0 |
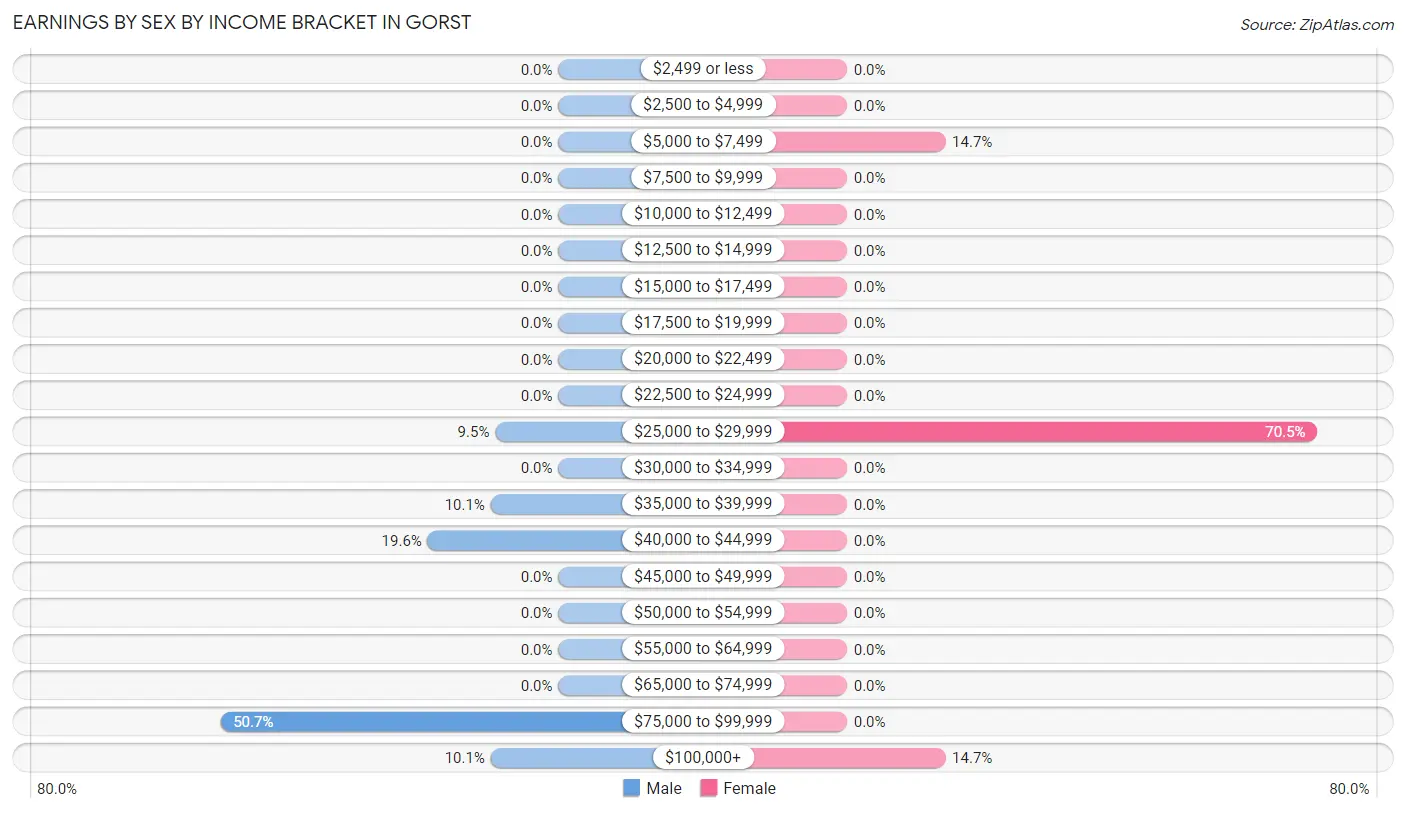
Earnings by Sex by Income Bracket in Gorst
The most common earnings brackets in Gorst are $75,000 to $99,999 for men (75 | 50.7%) and $25,000 to $29,999 for women (67 | 70.5%).
| Income | Male | Female |
| $2,499 or less | 0 (0.0%) | 0 (0.0%) |
| $2,500 to $4,999 | 0 (0.0%) | 0 (0.0%) |
| $5,000 to $7,499 | 0 (0.0%) | 14 (14.7%) |
| $7,500 to $9,999 | 0 (0.0%) | 0 (0.0%) |
| $10,000 to $12,499 | 0 (0.0%) | 0 (0.0%) |
| $12,500 to $14,999 | 0 (0.0%) | 0 (0.0%) |
| $15,000 to $17,499 | 0 (0.0%) | 0 (0.0%) |
| $17,500 to $19,999 | 0 (0.0%) | 0 (0.0%) |
| $20,000 to $22,499 | 0 (0.0%) | 0 (0.0%) |
| $22,500 to $24,999 | 0 (0.0%) | 0 (0.0%) |
| $25,000 to $29,999 | 14 (9.5%) | 67 (70.5%) |
| $30,000 to $34,999 | 0 (0.0%) | 0 (0.0%) |
| $35,000 to $39,999 | 15 (10.1%) | 0 (0.0%) |
| $40,000 to $44,999 | 29 (19.6%) | 0 (0.0%) |
| $45,000 to $49,999 | 0 (0.0%) | 0 (0.0%) |
| $50,000 to $54,999 | 0 (0.0%) | 0 (0.0%) |
| $55,000 to $64,999 | 0 (0.0%) | 0 (0.0%) |
| $65,000 to $74,999 | 0 (0.0%) | 0 (0.0%) |
| $75,000 to $99,999 | 75 (50.7%) | 0 (0.0%) |
| $100,000+ | 15 (10.1%) | 14 (14.7%) |
| Total | 148 (100.0%) | 95 (100.0%) |
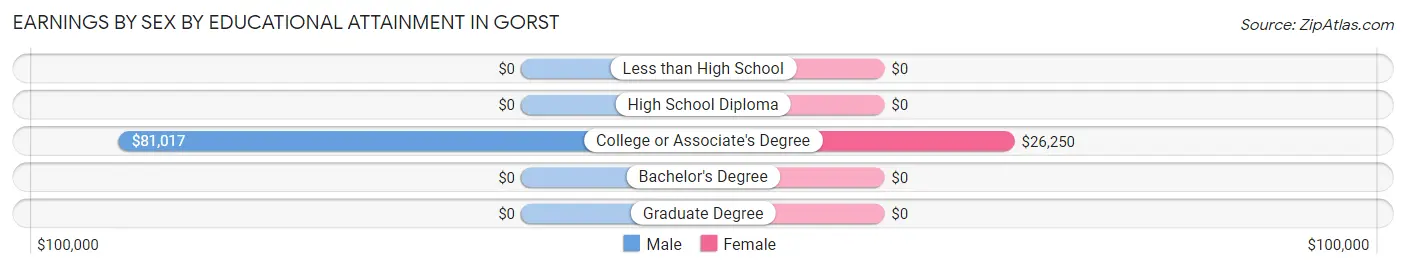
Earnings by Sex by Educational Attainment in Gorst
Average earnings in Gorst are $80,533 for men and $26,250 for women, a difference of 67.4%. Men with an educational attainment of college or associate's degree enjoy the highest average annual earnings of $81,017, while those with college or associate's degree education earn the least with $81,017. Women with an educational attainment of college or associate's degree earn the most with the average annual earnings of $26,250, while those with college or associate's degree education have the smallest earnings of $26,250.
| Educational Attainment | Male Income | Female Income |
| Less than High School | - | - |
| High School Diploma | - | - |
| College or Associate's Degree | $81,017 | $26,250 |
| Bachelor's Degree | - | - |
| Graduate Degree | - | - |
| Total | $80,533 | $26,250 |
Family Income in Gorst
Family Income Brackets in Gorst
According to the Gorst family income data, there are 90 families falling into the $100,000 to $149,999 income range, which is the most common income bracket and makes up 55.6% of all families.
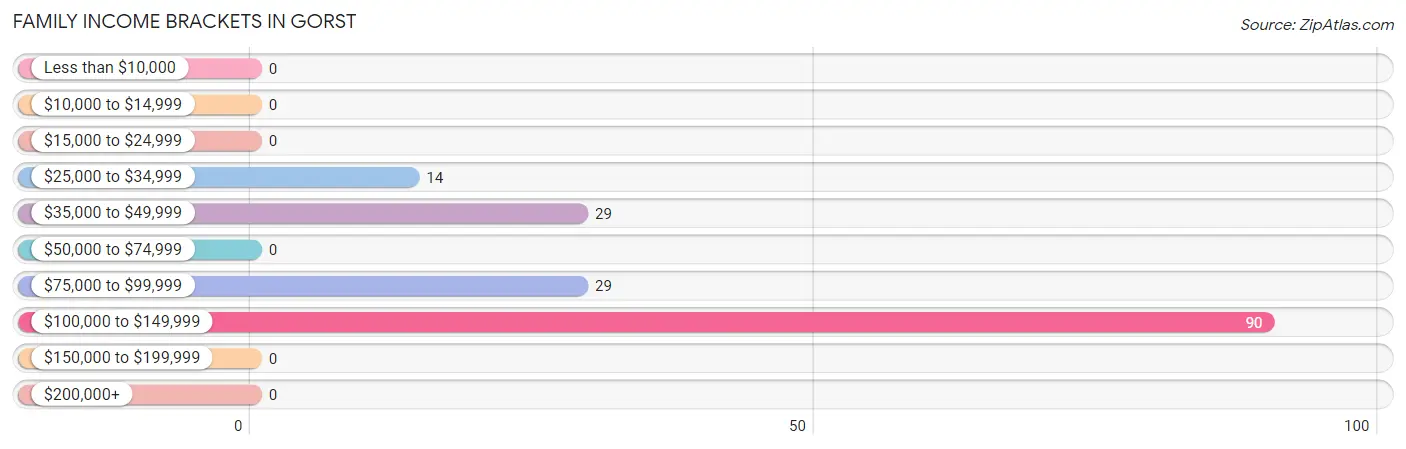
| Income Bracket | # Families | % Families |
| Less than $10,000 | 0 | 0.0% |
| $10,000 to $14,999 | 0 | 0.0% |
| $15,000 to $24,999 | 0 | 0.0% |
| $25,000 to $34,999 | 14 | 8.6% |
| $35,000 to $49,999 | 29 | 17.9% |
| $50,000 to $74,999 | 0 | 0.0% |
| $75,000 to $99,999 | 29 | 17.9% |
| $100,000 to $149,999 | 90 | 55.6% |
| $150,000 to $199,999 | 0 | 0.0% |
| $200,000+ | 0 | 0.0% |
Family Income by Famaliy Size in Gorst
| Income Bracket | # Families | Median Income |
| 2-Person Families | 72 (44.4%) | $0 |
| 3-Person Families | 29 (17.9%) | $0 |
| 4-Person Families | 0 (0.0%) | $0 |
| 5-Person Families | 0 (0.0%) | $0 |
| 6-Person Families | 61 (37.7%) | $0 |
| 7+ Person Families | 0 (0.0%) | $0 |
| Total | 162 (100.0%) | $125,296 |
Family Income by Number of Earners in Gorst
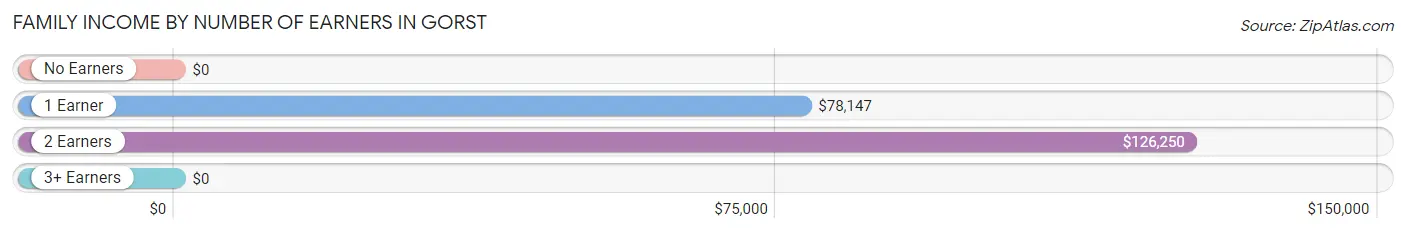
| Number of Earners | # Families | Median Income |
| No Earners | 0 (0.0%) | $0 |
| 1 Earner | 73 (45.1%) | $78,147 |
| 2 Earners | 89 (54.9%) | $126,250 |
| 3+ Earners | 0 (0.0%) | $0 |
| Total | 162 (100.0%) | $125,296 |
Household Income in Gorst
Household Income Brackets in Gorst
With 104 households falling in the category, the $100,000 to $149,999 income range is the most frequent in Gorst, accounting for 55.9% of all households.
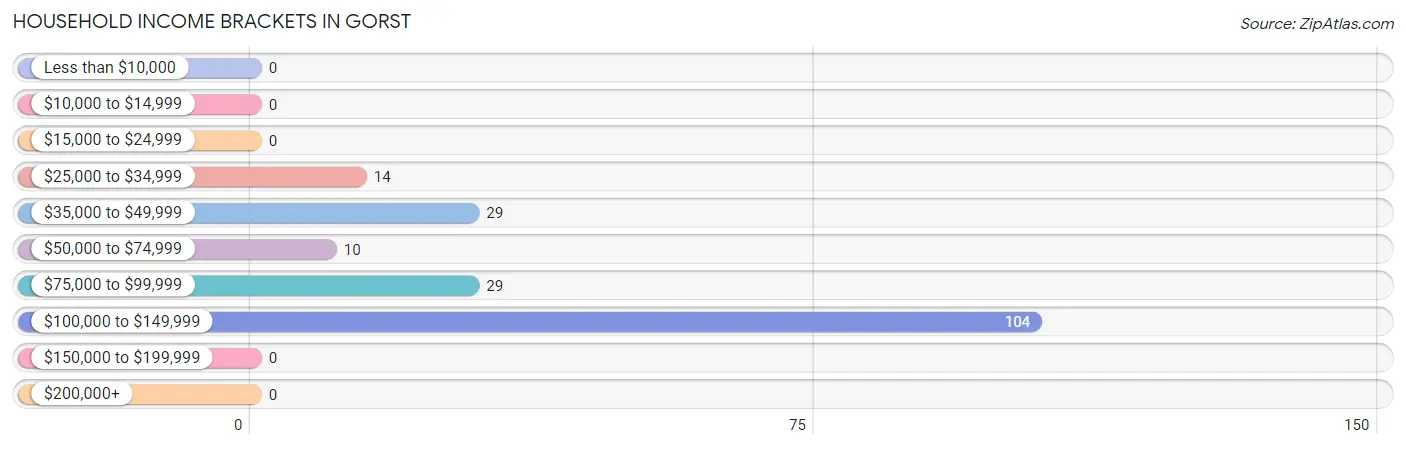
| Income Bracket | # Households | % Households |
| Less than $10,000 | 0 | 0.0% |
| $10,000 to $14,999 | 0 | 0.0% |
| $15,000 to $24,999 | 0 | 0.0% |
| $25,000 to $34,999 | 14 | 7.5% |
| $35,000 to $49,999 | 29 | 15.6% |
| $50,000 to $74,999 | 10 | 5.4% |
| $75,000 to $99,999 | 29 | 15.6% |
| $100,000 to $149,999 | 104 | 55.9% |
| $150,000 to $199,999 | 0 | 0.0% |
| $200,000+ | 0 | 0.0% |
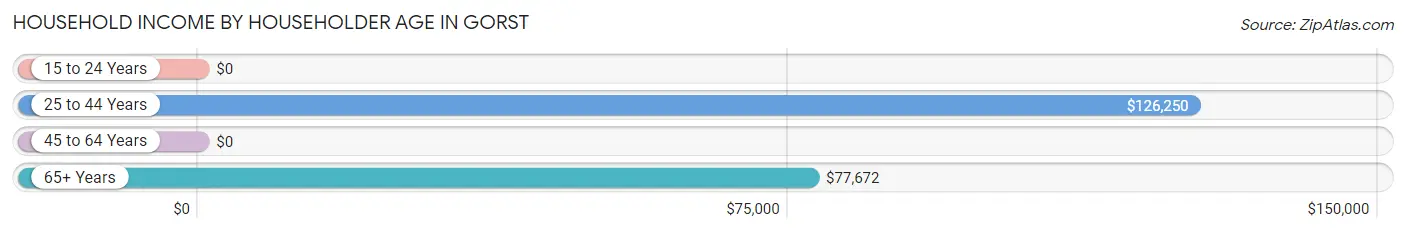
Household Income by Householder Age in Gorst
The median household income in Gorst is $114,464, with the highest median household income of $126,250 found in the 25 to 44 years age bracket for the primary householder. A total of 43 households (23.1%) fall into this category.
| Income Bracket | # Households | Median Income |
| 15 to 24 Years | 0 (0.0%) | $0 |
| 25 to 44 Years | 43 (23.1%) | $126,250 |
| 45 to 64 Years | 61 (32.8%) | $0 |
| 65+ Years | 82 (44.1%) | $77,672 |
| Total | 186 (100.0%) | $114,464 |
Poverty in Gorst
Income Below Poverty by Sex and Age in Gorst
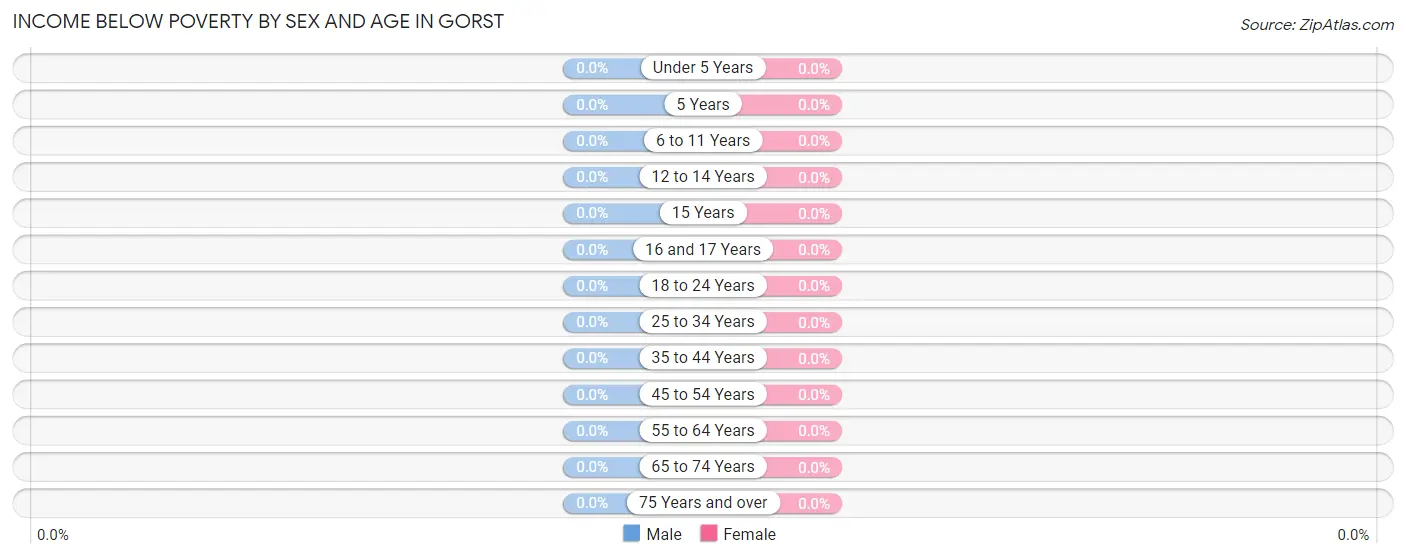
| Age Bracket | Male | Female |
| Under 5 Years | 0 (0.0%) | 0 (0.0%) |
| 5 Years | 0 (0.0%) | 0 (0.0%) |
| 6 to 11 Years | 0 (0.0%) | 0 (0.0%) |
| 12 to 14 Years | 0 (0.0%) | 0 (0.0%) |
| 15 Years | 0 (0.0%) | 0 (0.0%) |
| 16 and 17 Years | 0 (0.0%) | 0 (0.0%) |
| 18 to 24 Years | 0 (0.0%) | 0 (0.0%) |
| 25 to 34 Years | 0 (0.0%) | 0 (0.0%) |
| 35 to 44 Years | 0 (0.0%) | 0 (0.0%) |
| 45 to 54 Years | 0 (0.0%) | 0 (0.0%) |
| 55 to 64 Years | 0 (0.0%) | 0 (0.0%) |
| 65 to 74 Years | 0 (0.0%) | 0 (0.0%) |
| 75 Years and over | 0 (0.0%) | 0 (0.0%) |
| Total | 0 (0.0%) | 0 (0.0%) |
Income Above Poverty by Sex and Age in Gorst
According to the poverty statistics in Gorst, males aged under 5 years and females aged 5 years are the age groups that are most secure financially, with 100.0% of males and 100.0% of females in these age groups living above the poverty line.
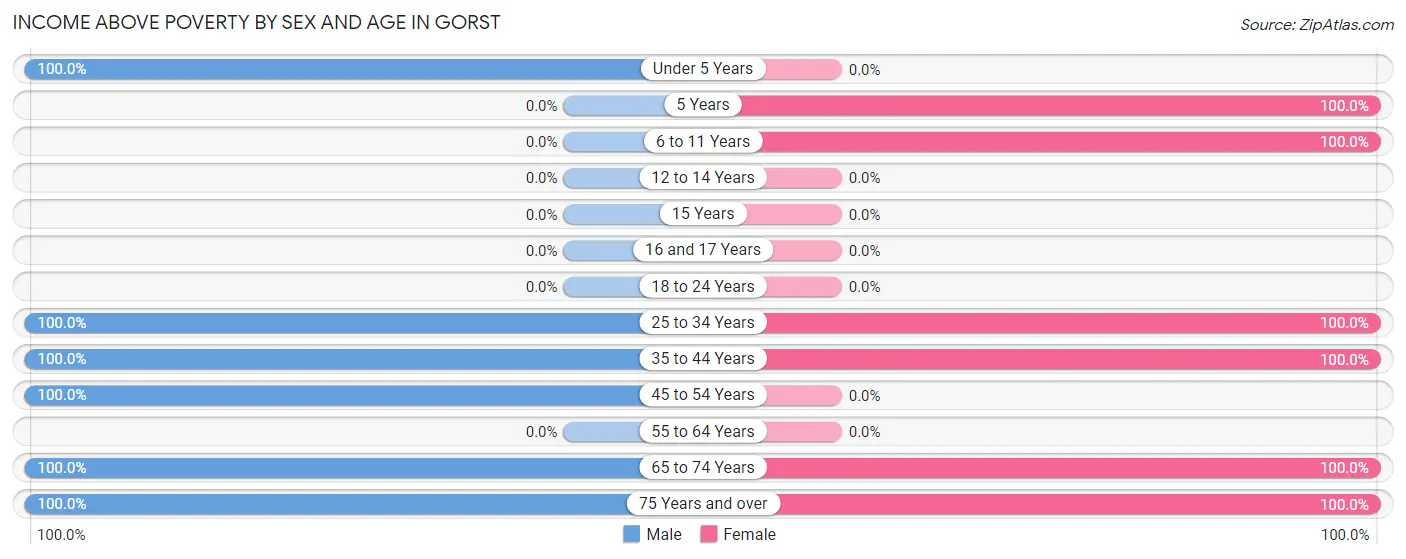
| Age Bracket | Male | Female |
| Under 5 Years | 13 (100.0%) | 0 (0.0%) |
| 5 Years | 0 (0.0%) | 12 (100.0%) |
| 6 to 11 Years | 0 (0.0%) | 150 (100.0%) |
| 12 to 14 Years | 0 (0.0%) | 0 (0.0%) |
| 15 Years | 0 (0.0%) | 0 (0.0%) |
| 16 and 17 Years | 0 (0.0%) | 0 (0.0%) |
| 18 to 24 Years | 0 (0.0%) | 0 (0.0%) |
| 25 to 34 Years | 29 (100.0%) | 28 (100.0%) |
| 35 to 44 Years | 15 (100.0%) | 51 (100.0%) |
| 45 to 54 Years | 87 (100.0%) | 0 (0.0%) |
| 55 to 64 Years | 0 (0.0%) | 0 (0.0%) |
| 65 to 74 Years | 14 (100.0%) | 39 (100.0%) |
| 75 Years and over | 29 (100.0%) | 28 (100.0%) |
| Total | 187 (100.0%) | 308 (100.0%) |
Income Below Poverty Among Married-Couple Families in Gorst
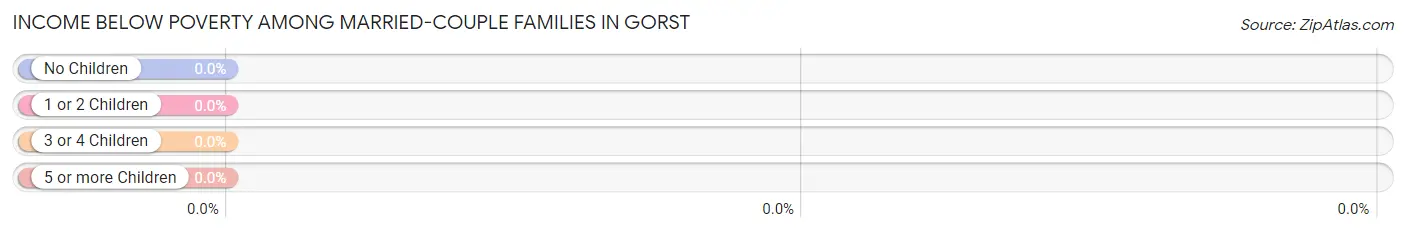
| Children | Above Poverty | Below Poverty |
| No Children | 43 (100.0%) | 0 (0.0%) |
| 1 or 2 Children | 29 (100.0%) | 0 (0.0%) |
| 3 or 4 Children | 61 (100.0%) | 0 (0.0%) |
| 5 or more Children | 0 (0.0%) | 0 (0.0%) |
| Total | 133 (100.0%) | 0 (0.0%) |
Income Below Poverty Among Single-Parent Households in Gorst
| Children | Single Father | Single Mother |
| No Children | 0 (0.0%) | 0 (0.0%) |
| 1 or 2 Children | 0 (0.0%) | 0 (0.0%) |
| 3 or 4 Children | 0 (0.0%) | 0 (0.0%) |
| 5 or more Children | 0 (0.0%) | 0 (0.0%) |
| Total | 0 (0.0%) | 0 (0.0%) |
Income Below Poverty Among Married-Couple vs Single-Parent Households in Gorst
| Children | Married-Couple Families | Single-Parent Households |
| No Children | 0 (0.0%) | 0 (0.0%) |
| 1 or 2 Children | 0 (0.0%) | 0 (0.0%) |
| 3 or 4 Children | 0 (0.0%) | 0 (0.0%) |
| 5 or more Children | 0 (0.0%) | 0 (0.0%) |
| Total | 0 (0.0%) | 0 (0.0%) |
Race in Gorst
The most populous races in Gorst are Hispanic or Latino (266 | 53.7%), Two or more Races (266 | 53.7%), and White / Caucasian (229 | 46.3%).
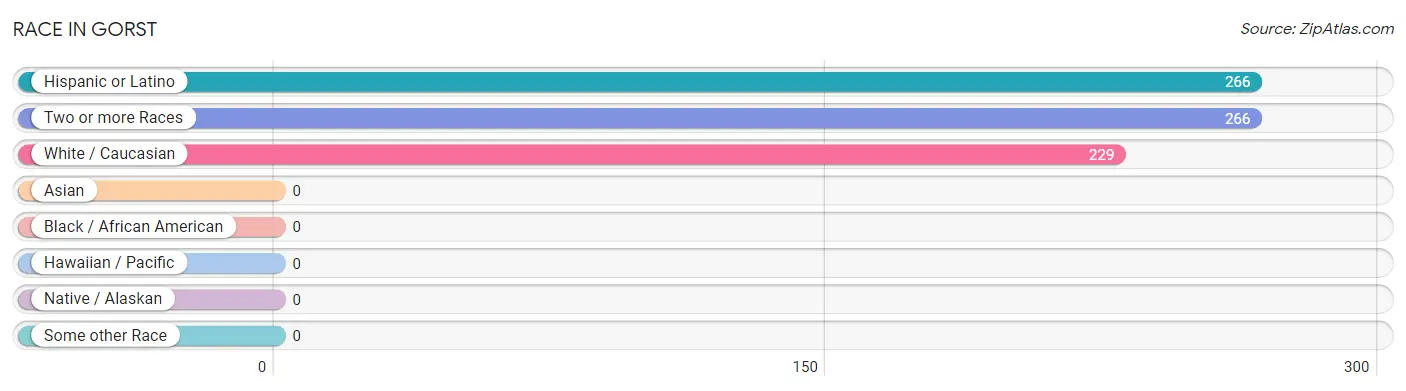
| Race | # Population | % Population |
| Asian | 0 | 0.0% |
| Black / African American | 0 | 0.0% |
| Hawaiian / Pacific | 0 | 0.0% |
| Hispanic or Latino | 266 | 53.7% |
| Native / Alaskan | 0 | 0.0% |
| White / Caucasian | 229 | 46.3% |
| Two or more Races | 266 | 53.7% |
| Some other Race | 0 | 0.0% |
| Total | 495 | 100.0% |
Ancestry in Gorst
The most populous ancestries reported in Gorst are Mexican (136 | 27.5%), English (89 | 18.0%), Central American (75 | 15.1%), Salvadoran (75 | 15.1%), and Norwegian (67 | 13.5%), together accounting for 89.3% of all Gorst residents.
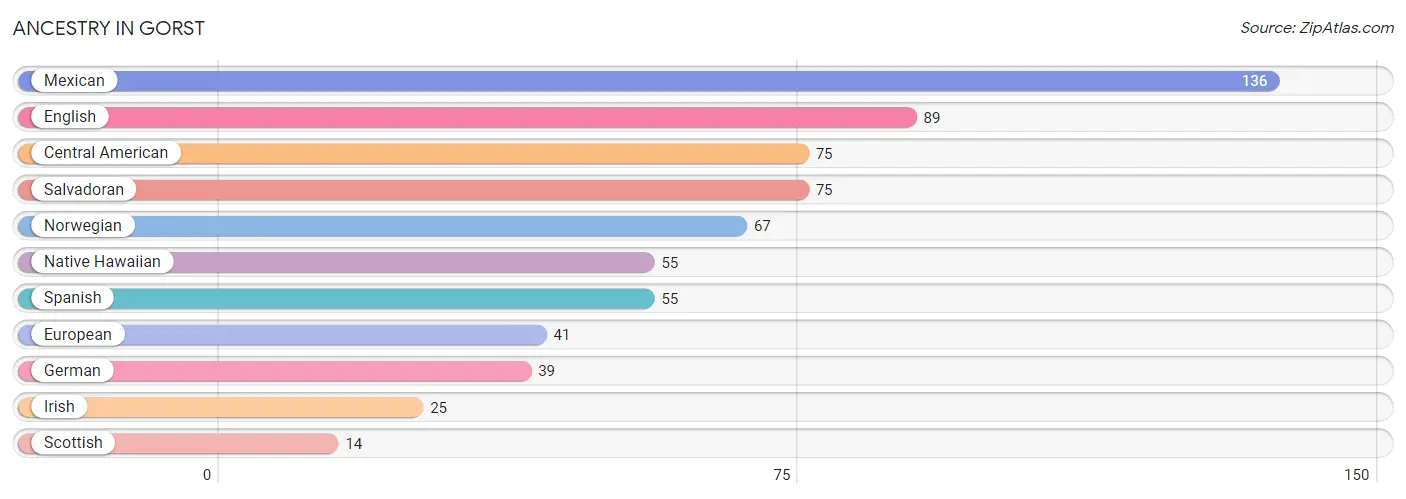
| Ancestry | # Population | % Population |
| Central American | 75 | 15.1% |
| English | 89 | 18.0% |
| European | 41 | 8.3% |
| German | 39 | 7.9% |
| Irish | 25 | 5.1% |
| Mexican | 136 | 27.5% |
| Native Hawaiian | 55 | 11.1% |
| Norwegian | 67 | 13.5% |
| Salvadoran | 75 | 15.1% |
| Scottish | 14 | 2.8% |
| Spanish | 55 | 11.1% | View All 11 Rows |
Immigrants in Gorst

| Immigration Origin | # Population | % Population | View All 0 Rows |
Sex and Age in Gorst
Sex and Age in Gorst
The most populous age groups in Gorst are 50 to 54 Years (61 | 32.6%) for men and 5 to 9 Years (87 | 28.2%) for women.
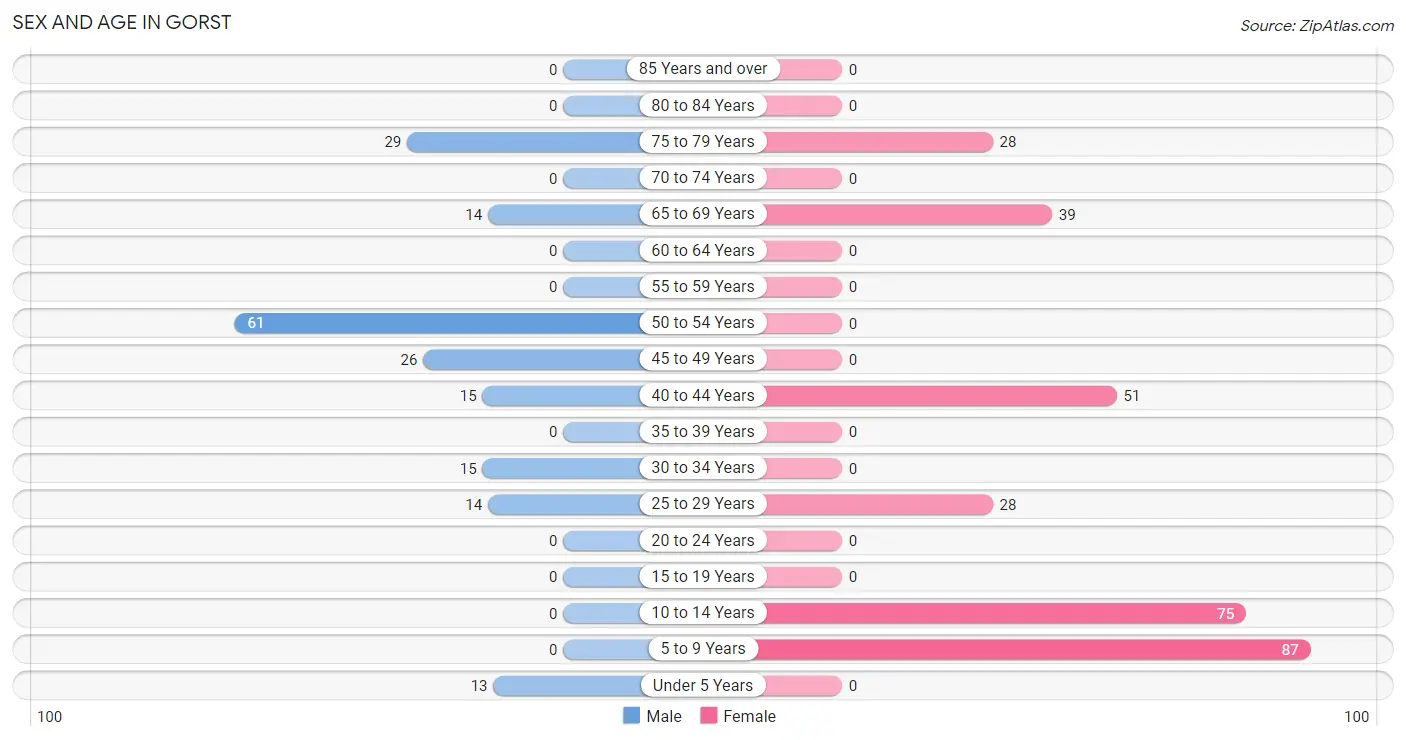
| Age Bracket | Male | Female |
| Under 5 Years | 13 (7.0%) | 0 (0.0%) |
| 5 to 9 Years | 0 (0.0%) | 87 (28.2%) |
| 10 to 14 Years | 0 (0.0%) | 75 (24.3%) |
| 15 to 19 Years | 0 (0.0%) | 0 (0.0%) |
| 20 to 24 Years | 0 (0.0%) | 0 (0.0%) |
| 25 to 29 Years | 14 (7.5%) | 28 (9.1%) |
| 30 to 34 Years | 15 (8.0%) | 0 (0.0%) |
| 35 to 39 Years | 0 (0.0%) | 0 (0.0%) |
| 40 to 44 Years | 15 (8.0%) | 51 (16.6%) |
| 45 to 49 Years | 26 (13.9%) | 0 (0.0%) |
| 50 to 54 Years | 61 (32.6%) | 0 (0.0%) |
| 55 to 59 Years | 0 (0.0%) | 0 (0.0%) |
| 60 to 64 Years | 0 (0.0%) | 0 (0.0%) |
| 65 to 69 Years | 14 (7.5%) | 39 (12.7%) |
| 70 to 74 Years | 0 (0.0%) | 0 (0.0%) |
| 75 to 79 Years | 29 (15.5%) | 28 (9.1%) |
| 80 to 84 Years | 0 (0.0%) | 0 (0.0%) |
| 85 Years and over | 0 (0.0%) | 0 (0.0%) |
| Total | 187 (100.0%) | 308 (100.0%) |
Families and Households in Gorst
Median Family Size in Gorst
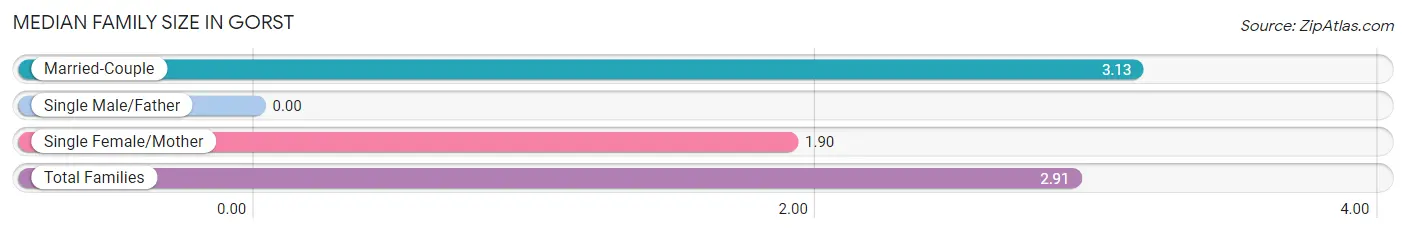
| Family Type | # Families | Family Size |
| Married-Couple | 133 (82.1%) | 3.13 |
| Single Male/Father | 0 (0.0%) | - |
| Single Female/Mother | 29 (17.9%) | 1.90 |
| Total Families | 162 (100.0%) | 2.91 |
Median Household Size in Gorst
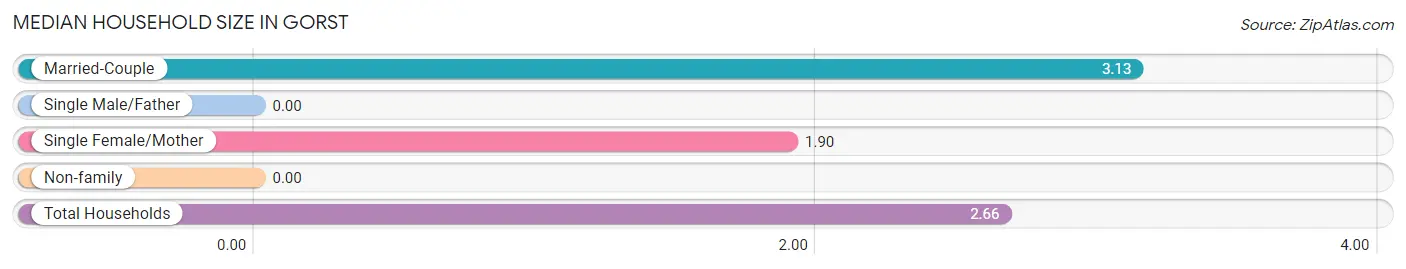
| Household Type | # Households | Household Size |
| Married-Couple | 133 (71.5%) | 3.13 |
| Single Male/Father | 0 (0.0%) | - |
| Single Female/Mother | 29 (15.6%) | 1.90 |
| Non-family | 24 (12.9%) | - |
| Total Households | 186 (100.0%) | 2.66 |
Household Size by Marriage Status in Gorst
Out of a total of 186 households in Gorst, 162 (87.1%) are family households, while 24 (12.9%) are nonfamily households. The most numerous type of family households are 2-person households, comprising 72, and the most common type of nonfamily households are 1-person households, comprising 24.
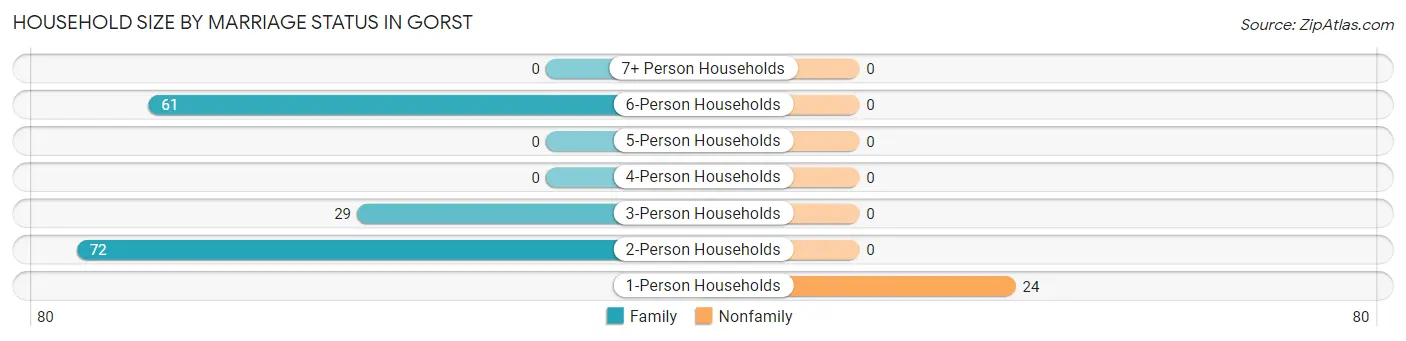
| Household Size | Family Households | Nonfamily Households |
| 1-Person Households | - | 24 (12.9%) |
| 2-Person Households | 72 (38.7%) | 0 (0.0%) |
| 3-Person Households | 29 (15.6%) | 0 (0.0%) |
| 4-Person Households | 0 (0.0%) | 0 (0.0%) |
| 5-Person Households | 0 (0.0%) | 0 (0.0%) |
| 6-Person Households | 61 (32.8%) | 0 (0.0%) |
| 7+ Person Households | 0 (0.0%) | 0 (0.0%) |
| Total | 162 (87.1%) | 24 (12.9%) |
Female Fertility in Gorst
Fertility by Age in Gorst
Average fertility rate in Gorst is 177.0 births per 1,000 women. Women in the age bracket of 20 to 34 years have the highest fertility rate with 500.0 births per 1,000 women. Women in the age bracket of 20 to 34 years acount for 100.0% of all women with births.
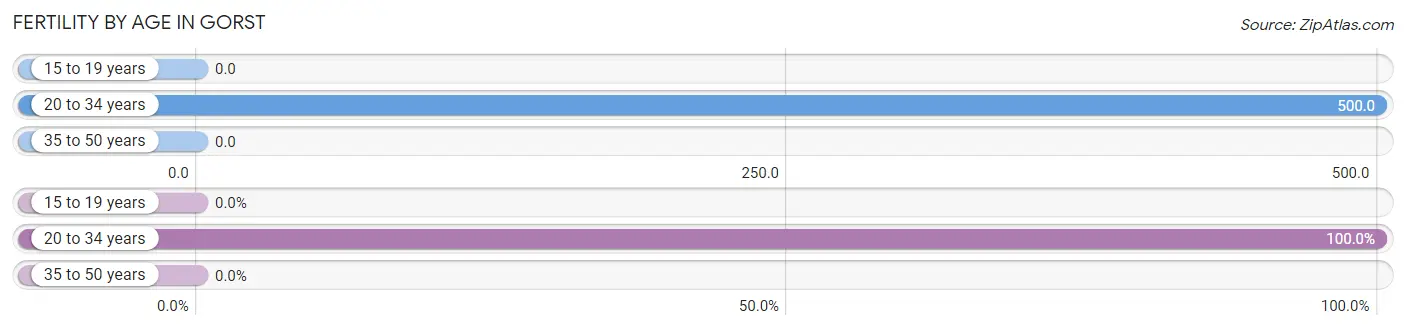
| Age Bracket | Women with Births | Births / 1,000 Women |
| 15 to 19 years | 0 (0.0%) | 0.0 |
| 20 to 34 years | 14 (100.0%) | 500.0 |
| 35 to 50 years | 0 (0.0%) | 0.0 |
| Total | 14 (100.0%) | 177.0 |
Fertility by Age by Marriage Status in Gorst
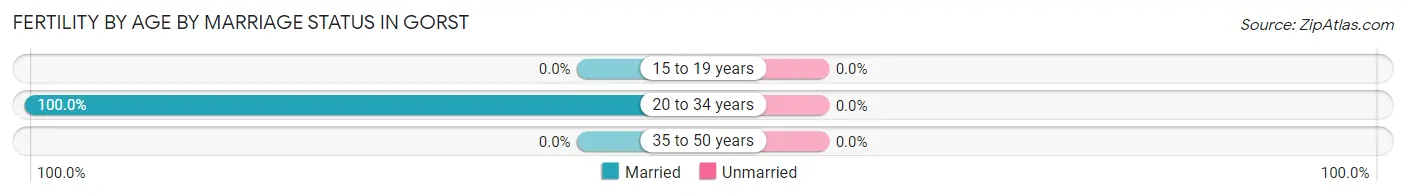
| Age Bracket | Married | Unmarried |
| 15 to 19 years | 0 (0.0%) | 0 (0.0%) |
| 20 to 34 years | 14 (100.0%) | 0 (0.0%) |
| 35 to 50 years | 0 (0.0%) | 0 (0.0%) |
| Total | 14 (100.0%) | 0 (0.0%) |
Fertility by Education in Gorst
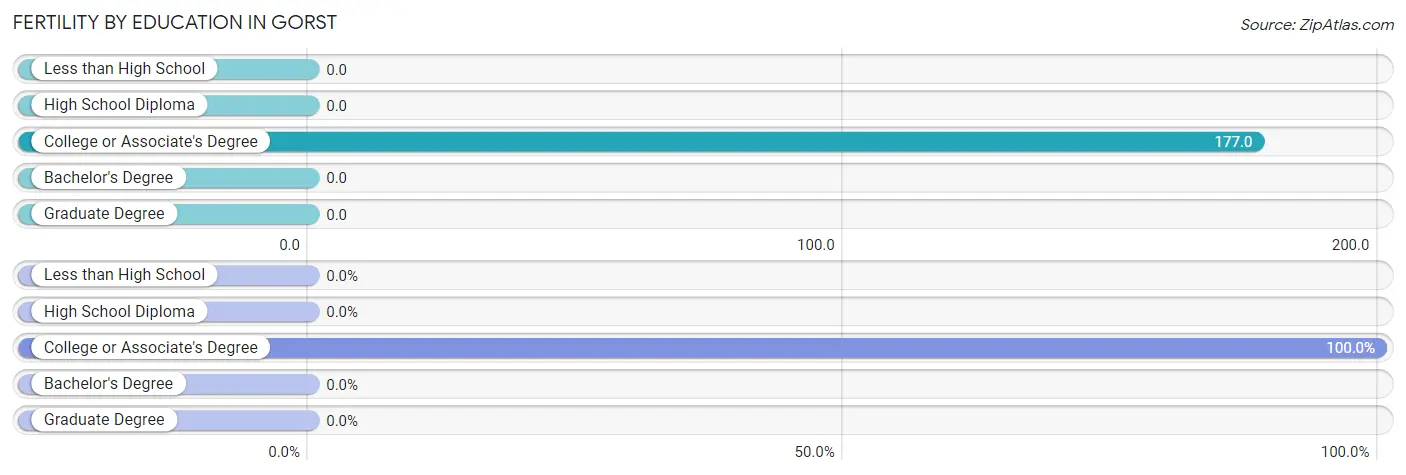
| Educational Attainment | Women with Births | Births / 1,000 Women |
| Less than High School | 0 (0.0%) | 0.0 |
| High School Diploma | 0 (0.0%) | 0.0 |
| College or Associate's Degree | 14 (100.0%) | 177.0 |
| Bachelor's Degree | 0 (0.0%) | 0.0 |
| Graduate Degree | 0 (0.0%) | 0.0 |
| Total | 14 (100.0%) | 177.0 |
Fertility by Education by Marriage Status in Gorst
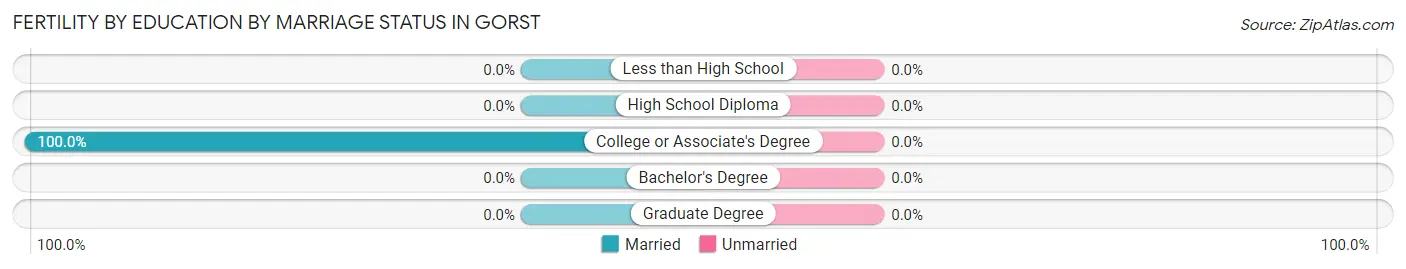
| Educational Attainment | Married | Unmarried |
| Less than High School | 0 (0.0%) | 0 (0.0%) |
| High School Diploma | 0 (0.0%) | 0 (0.0%) |
| College or Associate's Degree | 14 (100.0%) | 0 (0.0%) |
| Bachelor's Degree | 0 (0.0%) | 0 (0.0%) |
| Graduate Degree | 0 (0.0%) | 0 (0.0%) |
| Total | 14 (100.0%) | 0 (0.0%) |
Employment Characteristics in Gorst
Employment by Class of Employer in Gorst
Among the 229 employed individuals in Gorst, federal government employees (75 | 32.8%), private company employees (73 | 31.9%), and local government employees (38 | 16.6%) make up the most common classes of employment.
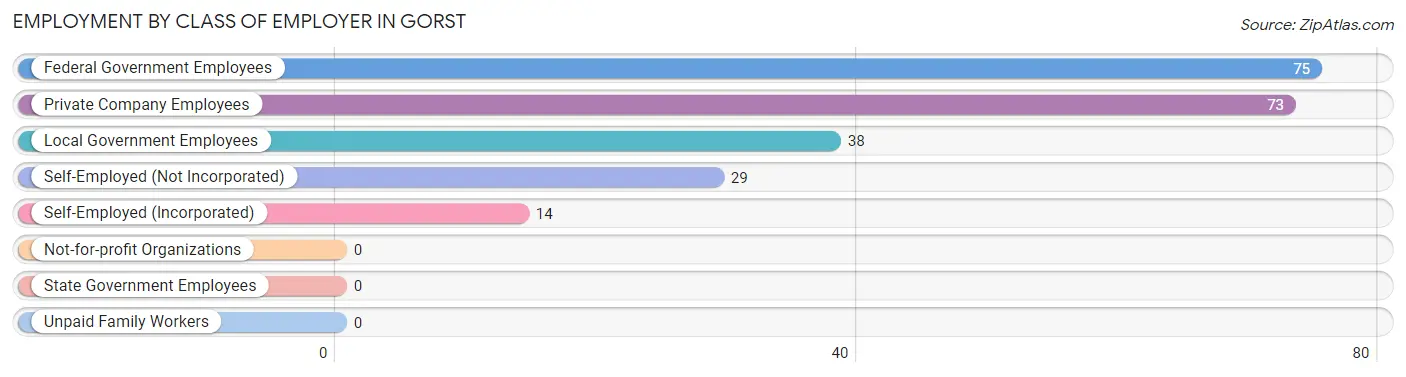
| Employer Class | # Employees | % Employees |
| Private Company Employees | 73 | 31.9% |
| Self-Employed (Incorporated) | 14 | 6.1% |
| Self-Employed (Not Incorporated) | 29 | 12.7% |
| Not-for-profit Organizations | 0 | 0.0% |
| Local Government Employees | 38 | 16.6% |
| State Government Employees | 0 | 0.0% |
| Federal Government Employees | 75 | 32.8% |
| Unpaid Family Workers | 0 | 0.0% |
| Total | 229 | 100.0% |
Employment Status by Age in Gorst
According to the labor force statistics for Gorst, out of the total population over 16 years of age (320), 79.7% or 255 individuals are in the labor force, with 10.2% or 26 of them unemployed. The age group with the highest labor force participation rate is 30 to 34 years, with 100.0% or 15 individuals in the labor force. Within the labor force, the 45 to 54 years age range has the highest percentage of unemployed individuals, with 29.9% or 26 of them being unemployed.
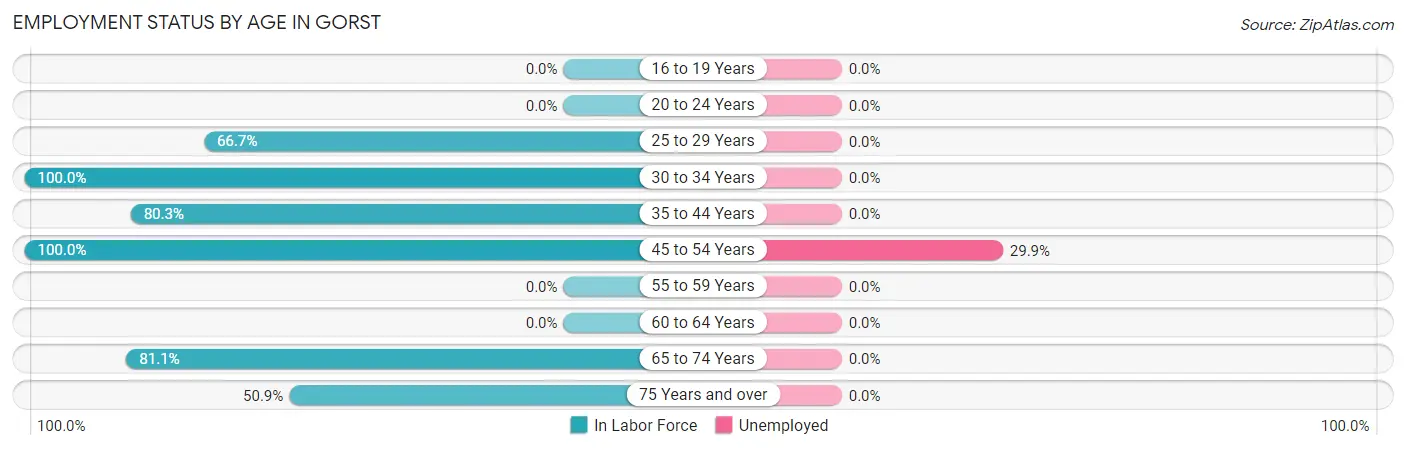
| Age Bracket | In Labor Force | Unemployed |
| 16 to 19 Years | 0 (0.0%) | 0 (0.0%) |
| 20 to 24 Years | 0 (0.0%) | 0 (0.0%) |
| 25 to 29 Years | 28 (66.7%) | 0 (0.0%) |
| 30 to 34 Years | 15 (100.0%) | 0 (0.0%) |
| 35 to 44 Years | 53 (80.3%) | 0 (0.0%) |
| 45 to 54 Years | 87 (100.0%) | 26 (29.9%) |
| 55 to 59 Years | 0 (0.0%) | 0 (0.0%) |
| 60 to 64 Years | 0 (0.0%) | 0 (0.0%) |
| 65 to 74 Years | 43 (81.1%) | 0 (0.0%) |
| 75 Years and over | 29 (50.9%) | 0 (0.0%) |
| Total | 255 (79.7%) | 26 (10.2%) |
Employment Status by Educational Attainment in Gorst
According to labor force statistics for Gorst, 87.1% of individuals (183) out of the total population between 25 and 64 years of age (210) are in the labor force, with 14.2% or 26 of them being unemployed. The group with the highest labor force participation rate are those with the educational attainment of college / associate degree, with 87.1% or 183 individuals in the labor force. Within the labor force, individuals with college / associate degree education have the highest percentage of unemployment, with 14.2% or 26 of them being unemployed.
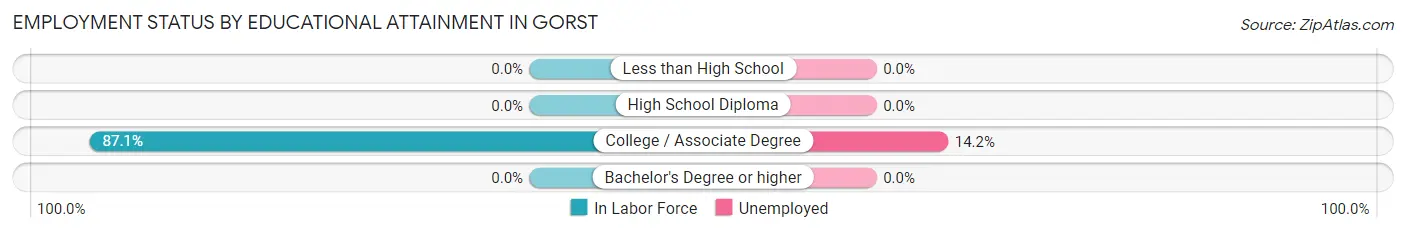
| Educational Attainment | In Labor Force | Unemployed |
| Less than High School | 0 (0.0%) | 0 (0.0%) |
| High School Diploma | 0 (0.0%) | 0 (0.0%) |
| College / Associate Degree | 183 (87.1%) | 30 (14.2%) |
| Bachelor's Degree or higher | 0 (0.0%) | 0 (0.0%) |
| Total | 183 (87.1%) | 30 (14.2%) |
Employment Occupations by Sex in Gorst
Management, Business, Science and Arts Occupations
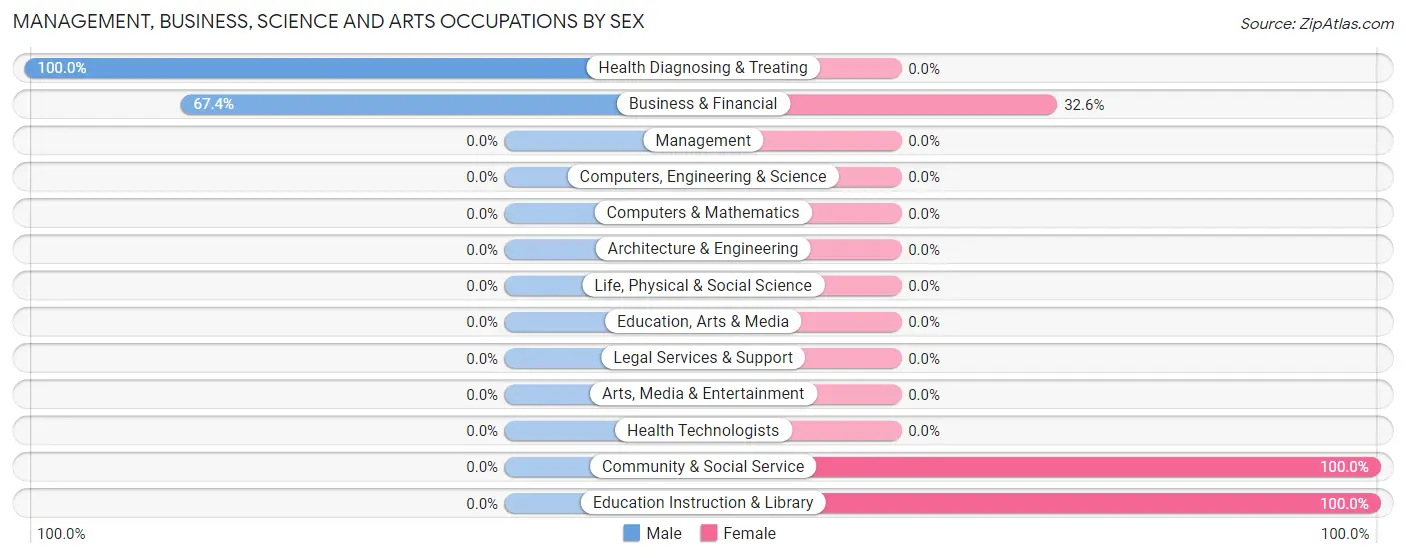
The most common Management, Business, Science and Arts occupations in Gorst are Health Diagnosing & Treating (75 | 32.8%), Business & Financial (43 | 18.8%), Community & Social Service (38 | 16.6%), and Education Instruction & Library (38 | 16.6%).
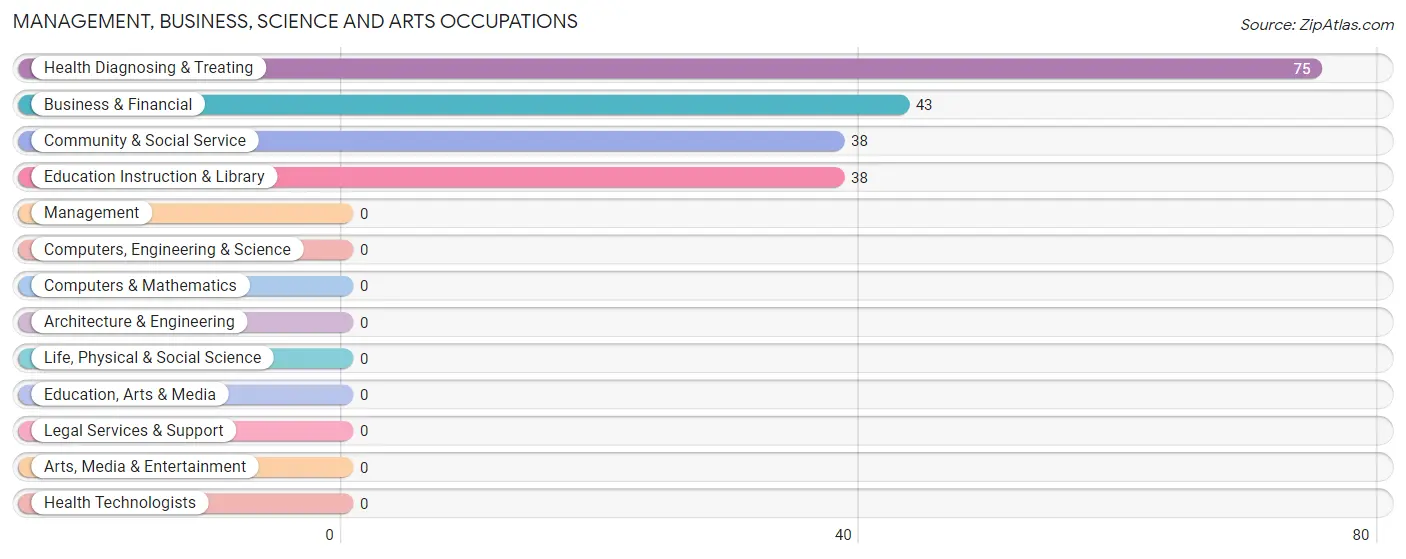
Management, Business, Science and Arts Occupations by Sex
Within the Management, Business, Science and Arts occupations in Gorst, the most male-oriented occupations are Health Diagnosing & Treating (100.0%), and Business & Financial (67.4%), while the most female-oriented occupations are Community & Social Service (100.0%), Education Instruction & Library (100.0%), and Business & Financial (32.6%).
| Occupation | Male | Female |
| Management | 0 (0.0%) | 0 (0.0%) |
| Business & Financial | 29 (67.4%) | 14 (32.6%) |
| Computers, Engineering & Science | 0 (0.0%) | 0 (0.0%) |
| Computers & Mathematics | 0 (0.0%) | 0 (0.0%) |
| Architecture & Engineering | 0 (0.0%) | 0 (0.0%) |
| Life, Physical & Social Science | 0 (0.0%) | 0 (0.0%) |
| Community & Social Service | 0 (0.0%) | 38 (100.0%) |
| Education, Arts & Media | 0 (0.0%) | 0 (0.0%) |
| Legal Services & Support | 0 (0.0%) | 0 (0.0%) |
| Education Instruction & Library | 0 (0.0%) | 38 (100.0%) |
| Arts, Media & Entertainment | 0 (0.0%) | 0 (0.0%) |
| Health Diagnosing & Treating | 75 (100.0%) | 0 (0.0%) |
| Health Technologists | 0 (0.0%) | 0 (0.0%) |
| Total (Category) | 104 (66.7%) | 52 (33.3%) |
| Total (Overall) | 148 (64.6%) | 81 (35.4%) |
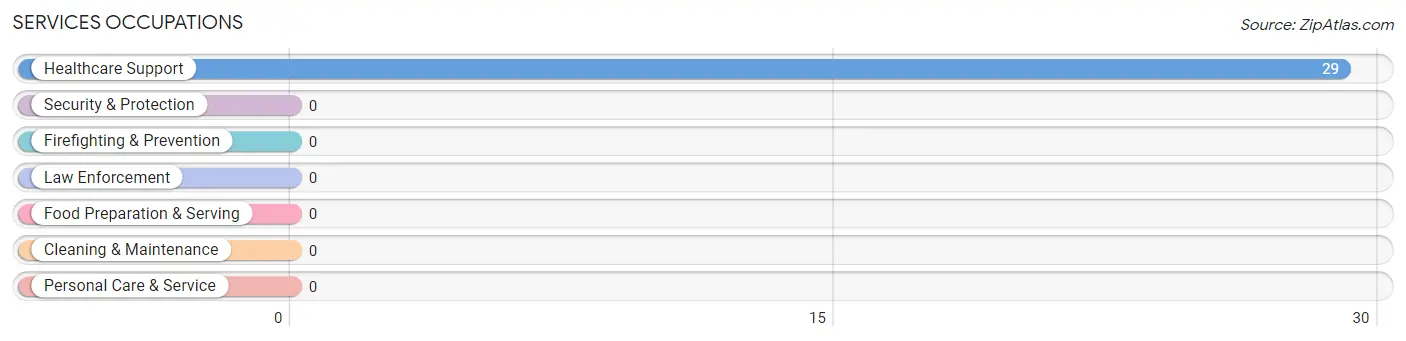
Services Occupations
The most common Services occupations in Gorst are , and Healthcare Support (29 | 12.7%).
Services Occupations by Sex
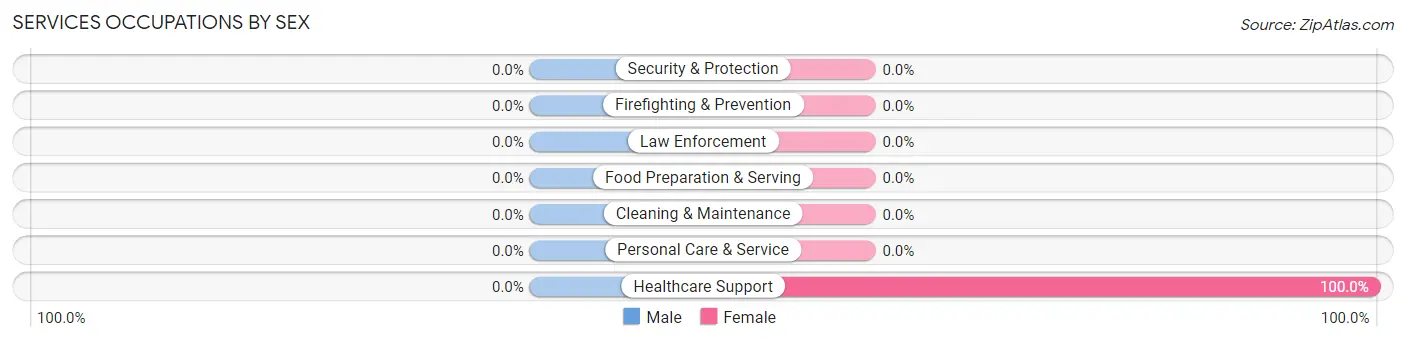
| Occupation | Male | Female |
| Healthcare Support | 0 (0.0%) | 29 (100.0%) |
| Security & Protection | 0 (0.0%) | 0 (0.0%) |
| Firefighting & Prevention | 0 (0.0%) | 0 (0.0%) |
| Law Enforcement | 0 (0.0%) | 0 (0.0%) |
| Food Preparation & Serving | 0 (0.0%) | 0 (0.0%) |
| Cleaning & Maintenance | 0 (0.0%) | 0 (0.0%) |
| Personal Care & Service | 0 (0.0%) | 0 (0.0%) |
| Total (Category) | 0 (0.0%) | 29 (100.0%) |
| Total (Overall) | 148 (64.6%) | 81 (35.4%) |
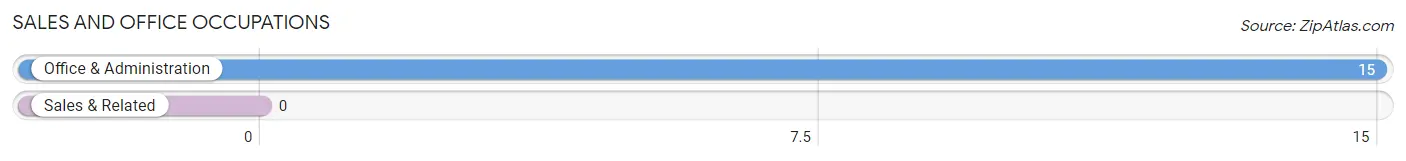
Sales and Office Occupations
The most common Sales and Office occupations in Gorst are , and Office & Administration (15 | 6.6%).
Sales and Office Occupations by Sex
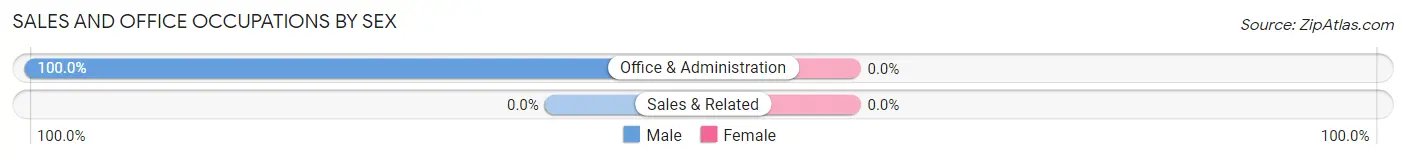
| Occupation | Male | Female |
| Sales & Related | 0 (0.0%) | 0 (0.0%) |
| Office & Administration | 15 (100.0%) | 0 (0.0%) |
| Total (Category) | 15 (100.0%) | 0 (0.0%) |
| Total (Overall) | 148 (64.6%) | 81 (35.4%) |
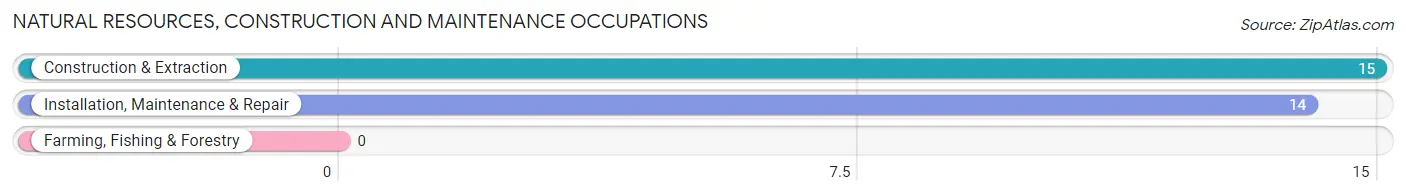
Natural Resources, Construction and Maintenance Occupations
The most common Natural Resources, Construction and Maintenance occupations in Gorst are Construction & Extraction (15 | 6.6%), and Installation, Maintenance & Repair (14 | 6.1%).
Natural Resources, Construction and Maintenance Occupations by Sex
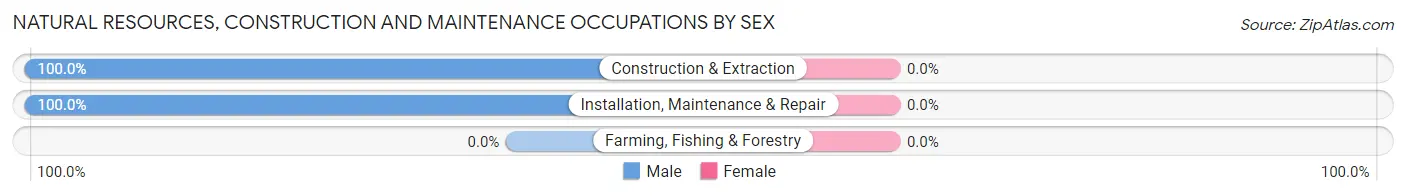
| Occupation | Male | Female |
| Farming, Fishing & Forestry | 0 (0.0%) | 0 (0.0%) |
| Construction & Extraction | 15 (100.0%) | 0 (0.0%) |
| Installation, Maintenance & Repair | 14 (100.0%) | 0 (0.0%) |
| Total (Category) | 29 (100.0%) | 0 (0.0%) |
| Total (Overall) | 148 (64.6%) | 81 (35.4%) |
Production, Transportation and Moving Occupations
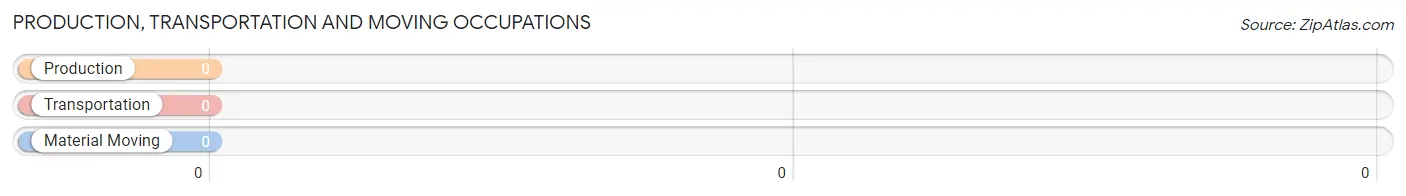
Production, Transportation and Moving Occupations by Sex
| Occupation | Male | Female |
| Production | 0 (0.0%) | 0 (0.0%) |
| Transportation | 0 (0.0%) | 0 (0.0%) |
| Material Moving | 0 (0.0%) | 0 (0.0%) |
| Total (Category) | 0 (0.0%) | 0 (0.0%) |
| Total (Overall) | 148 (64.6%) | 81 (35.4%) |
Employment Industries by Sex in Gorst
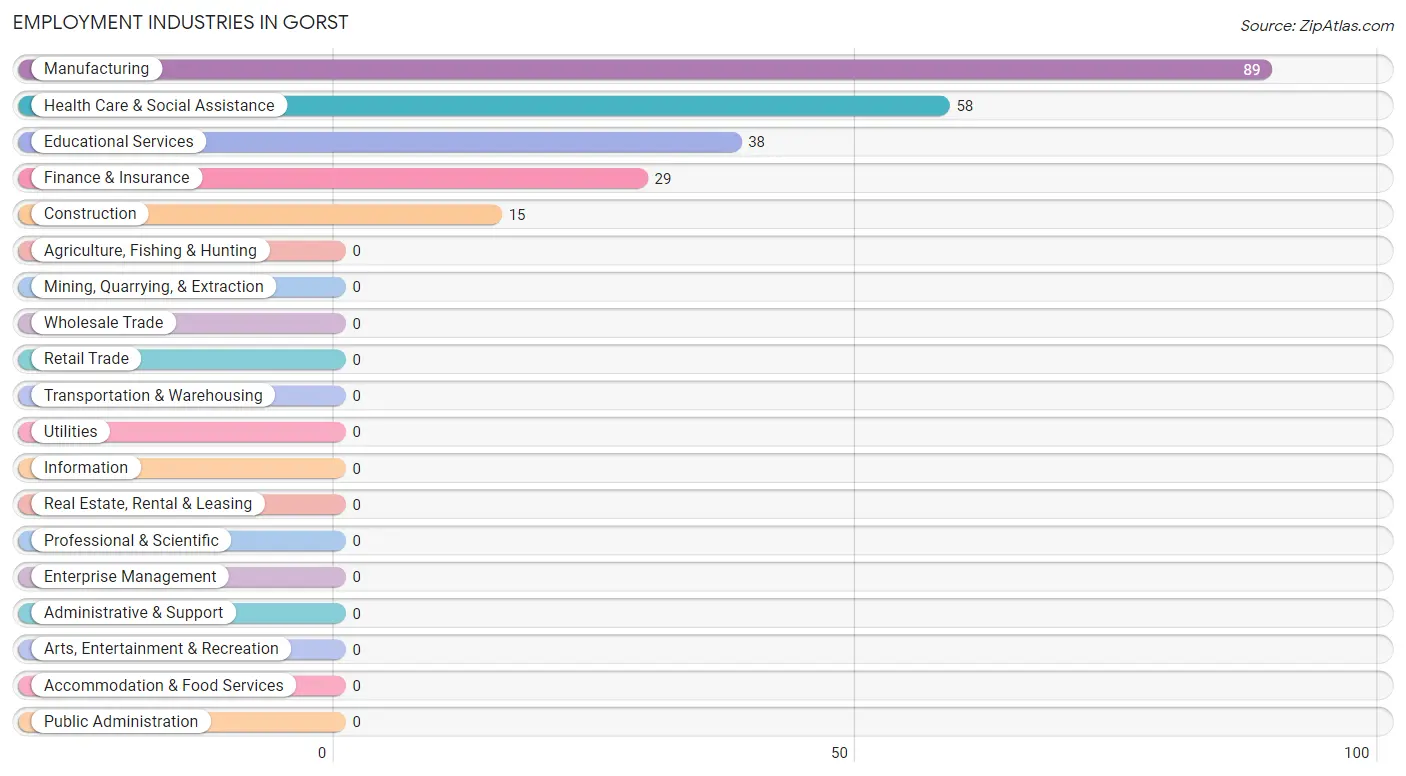
Employment Industries in Gorst
The major employment industries in Gorst include Manufacturing (89 | 38.9%), Health Care & Social Assistance (58 | 25.3%), Educational Services (38 | 16.6%), Finance & Insurance (29 | 12.7%), and Construction (15 | 6.6%).
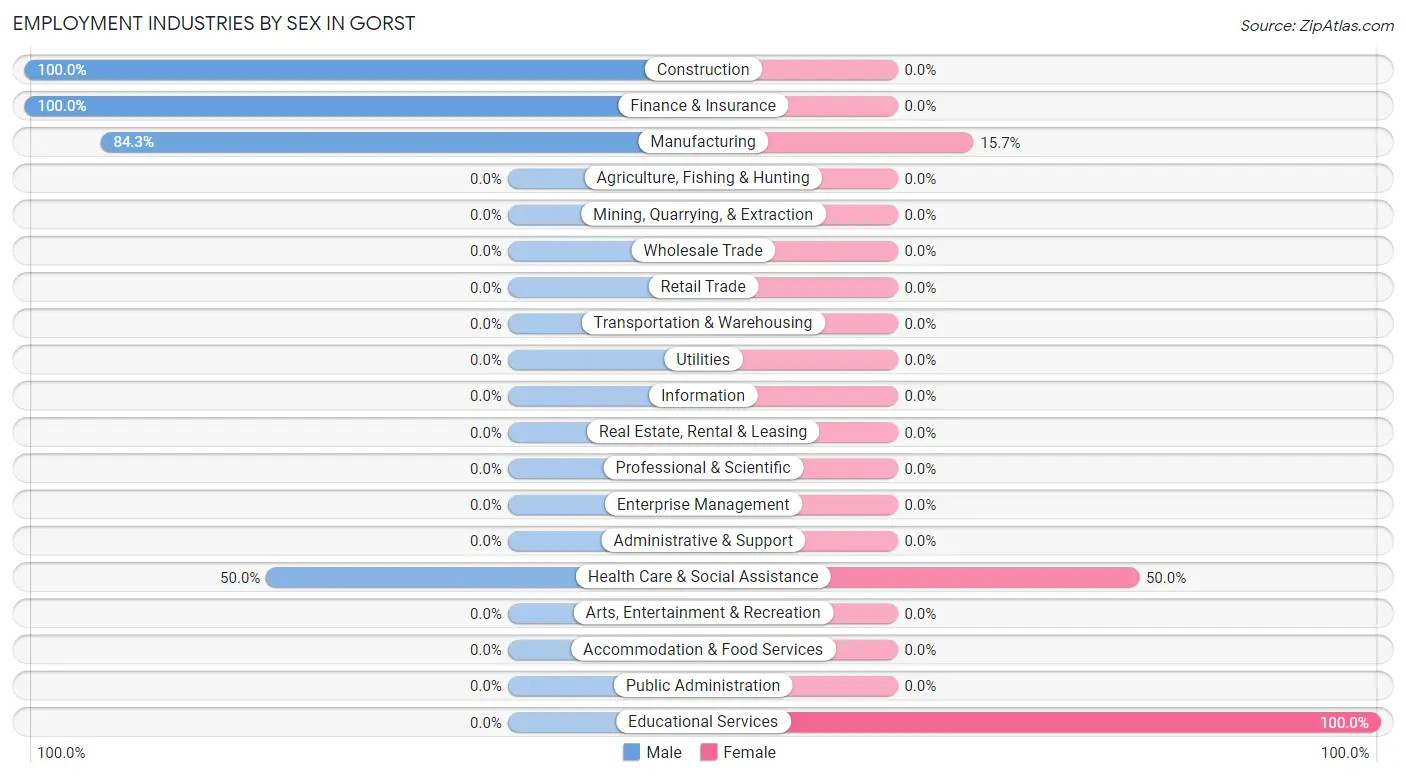
Employment Industries by Sex in Gorst
The Gorst industries that see more men than women are Construction (100.0%), Finance & Insurance (100.0%), and Manufacturing (84.3%), whereas the industries that tend to have a higher number of women are Educational Services (100.0%), Health Care & Social Assistance (50.0%), and Manufacturing (15.7%).
| Industry | Male | Female |
| Agriculture, Fishing & Hunting | 0 (0.0%) | 0 (0.0%) |
| Mining, Quarrying, & Extraction | 0 (0.0%) | 0 (0.0%) |
| Construction | 15 (100.0%) | 0 (0.0%) |
| Manufacturing | 75 (84.3%) | 14 (15.7%) |
| Wholesale Trade | 0 (0.0%) | 0 (0.0%) |
| Retail Trade | 0 (0.0%) | 0 (0.0%) |
| Transportation & Warehousing | 0 (0.0%) | 0 (0.0%) |
| Utilities | 0 (0.0%) | 0 (0.0%) |
| Information | 0 (0.0%) | 0 (0.0%) |
| Finance & Insurance | 29 (100.0%) | 0 (0.0%) |
| Real Estate, Rental & Leasing | 0 (0.0%) | 0 (0.0%) |
| Professional & Scientific | 0 (0.0%) | 0 (0.0%) |
| Enterprise Management | 0 (0.0%) | 0 (0.0%) |
| Administrative & Support | 0 (0.0%) | 0 (0.0%) |
| Educational Services | 0 (0.0%) | 38 (100.0%) |
| Health Care & Social Assistance | 29 (50.0%) | 29 (50.0%) |
| Arts, Entertainment & Recreation | 0 (0.0%) | 0 (0.0%) |
| Accommodation & Food Services | 0 (0.0%) | 0 (0.0%) |
| Public Administration | 0 (0.0%) | 0 (0.0%) |
| Total | 148 (64.6%) | 81 (35.4%) |
Education in Gorst
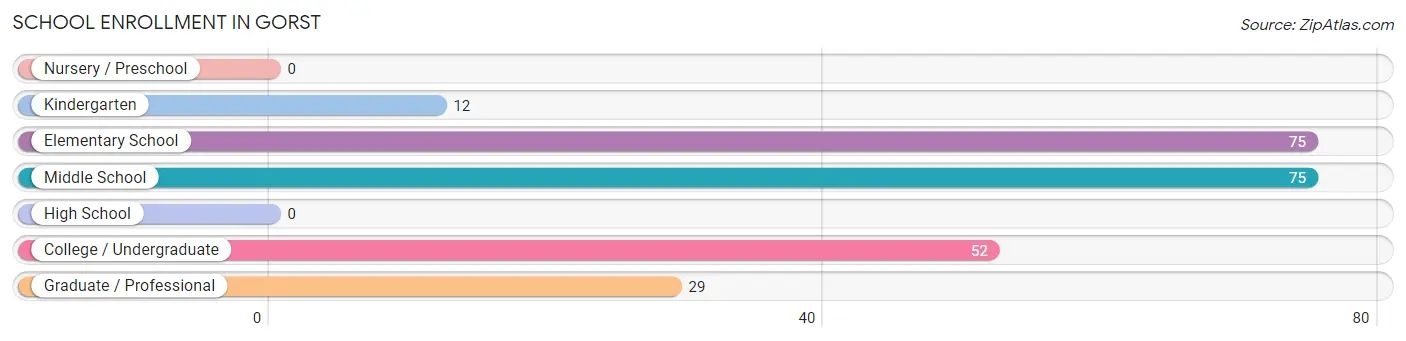
School Enrollment in Gorst
The most common levels of schooling among the 243 students in Gorst are elementary school (75 | 30.9%), middle school (75 | 30.9%), and college / undergraduate (52 | 21.4%).
| School Level | # Students | % Students |
| Nursery / Preschool | 0 | 0.0% |
| Kindergarten | 12 | 4.9% |
| Elementary School | 75 | 30.9% |
| Middle School | 75 | 30.9% |
| High School | 0 | 0.0% |
| College / Undergraduate | 52 | 21.4% |
| Graduate / Professional | 29 | 11.9% |
| Total | 243 | 100.0% |
School Enrollment by Age by Funding Source in Gorst
Out of a total of 243 students who are enrolled in schools in Gorst, 67 (27.6%) attend a private institution, while the remaining 176 (72.4%) are enrolled in public schools. The age group of 35 years and over has the highest likelihood of being enrolled in private schools, with 67 (100.0% in the age bracket) enrolled. Conversely, the age group of 5 to 9 year old has the lowest likelihood of being enrolled in a private school, with 87 (100.0% in the age bracket) attending a public institution.
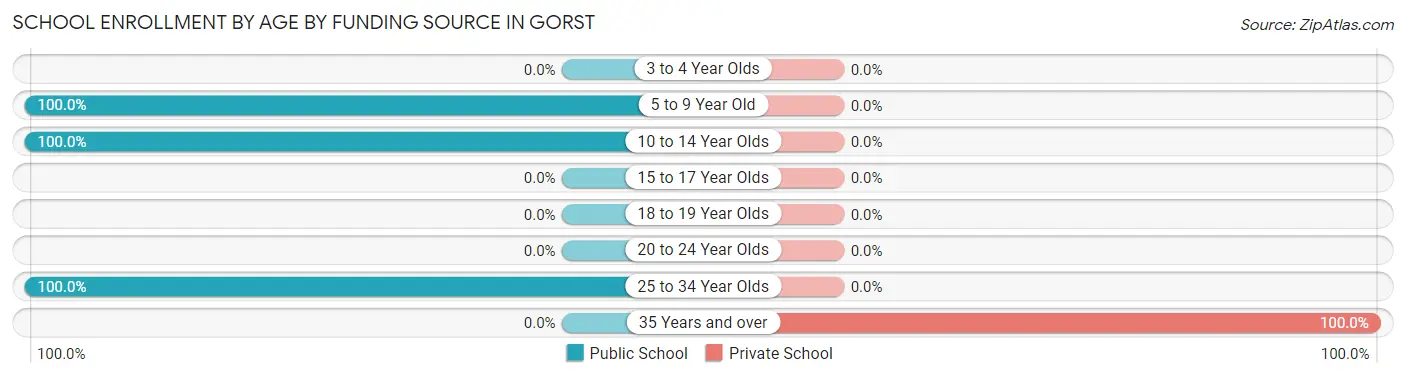
| Age Bracket | Public School | Private School |
| 3 to 4 Year Olds | 0 (0.0%) | 0 (0.0%) |
| 5 to 9 Year Old | 87 (100.0%) | 0 (0.0%) |
| 10 to 14 Year Olds | 75 (100.0%) | 0 (0.0%) |
| 15 to 17 Year Olds | 0 (0.0%) | 0 (0.0%) |
| 18 to 19 Year Olds | 0 (0.0%) | 0 (0.0%) |
| 20 to 24 Year Olds | 0 (0.0%) | 0 (0.0%) |
| 25 to 34 Year Olds | 14 (100.0%) | 0 (0.0%) |
| 35 Years and over | 0 (0.0%) | 67 (100.0%) |
| Total | 176 (72.4%) | 67 (27.6%) |
Educational Attainment by Field of Study in Gorst
, and literature & languages (29 | 100.0%) are the most common fields of study among 29 individuals in Gorst who have obtained a bachelor's degree or higher.
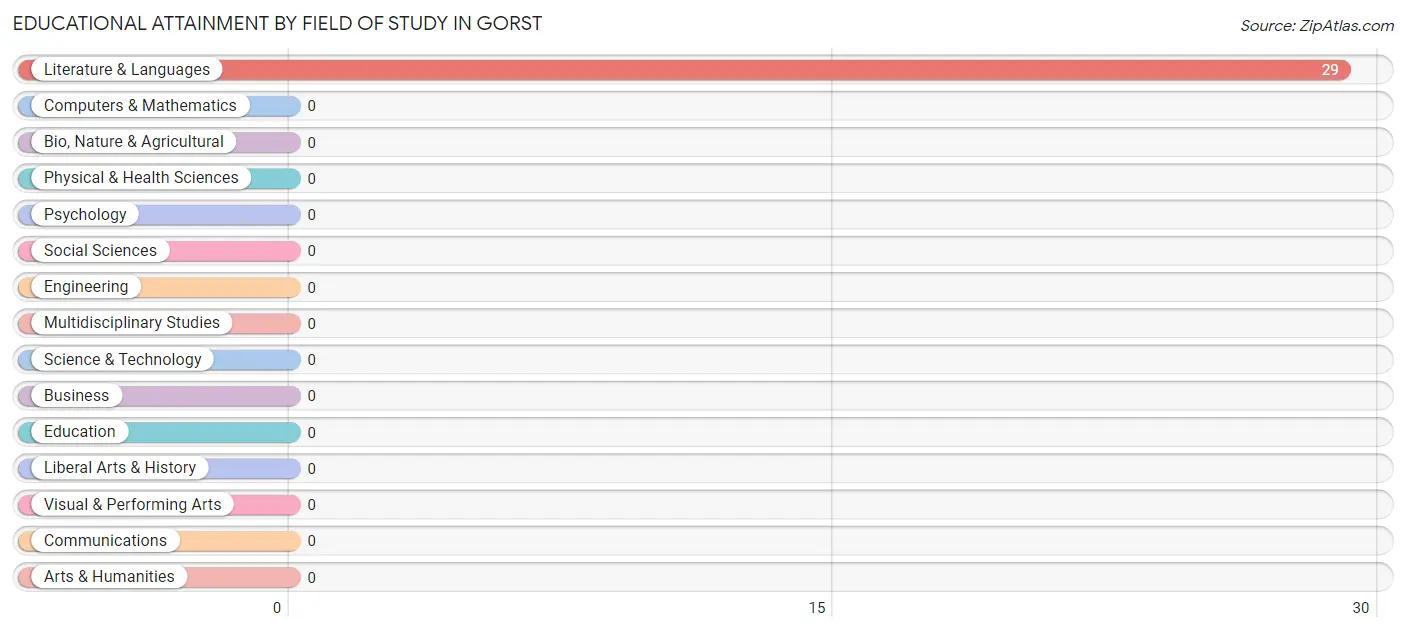
| Field of Study | # Graduates | % Graduates |
| Computers & Mathematics | 0 | 0.0% |
| Bio, Nature & Agricultural | 0 | 0.0% |
| Physical & Health Sciences | 0 | 0.0% |
| Psychology | 0 | 0.0% |
| Social Sciences | 0 | 0.0% |
| Engineering | 0 | 0.0% |
| Multidisciplinary Studies | 0 | 0.0% |
| Science & Technology | 0 | 0.0% |
| Business | 0 | 0.0% |
| Education | 0 | 0.0% |
| Literature & Languages | 29 | 100.0% |
| Liberal Arts & History | 0 | 0.0% |
| Visual & Performing Arts | 0 | 0.0% |
| Communications | 0 | 0.0% |
| Arts & Humanities | 0 | 0.0% |
| Total | 29 | 100.0% |
Transportation & Commute in Gorst
Vehicle Availability by Sex in Gorst
The most prevalent vehicle ownership categories in Gorst are males with 3 vehicles (90, accounting for 60.8%) and females with 3 vehicles (38, making up 111.1%).
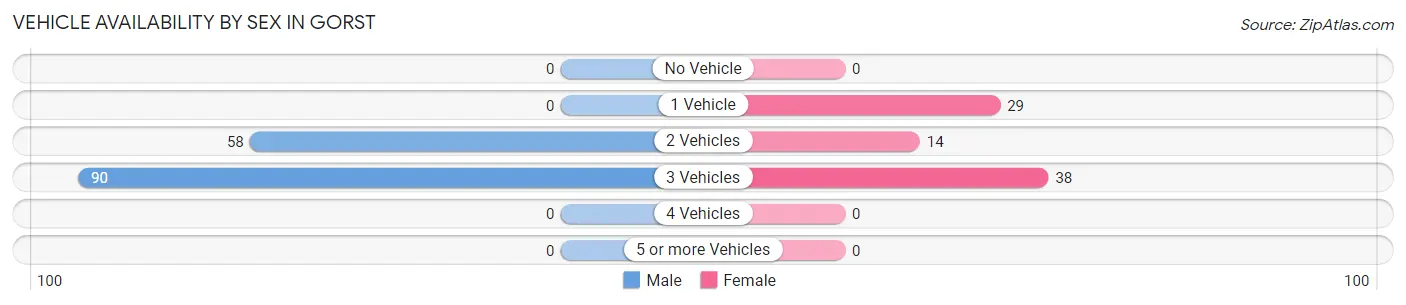
| Vehicles Available | Male | Female |
| No Vehicle | 0 (0.0%) | 0 (0.0%) |
| 1 Vehicle | 0 (0.0%) | 29 (35.8%) |
| 2 Vehicles | 58 (39.2%) | 14 (17.3%) |
| 3 Vehicles | 90 (60.8%) | 38 (46.9%) |
| 4 Vehicles | 0 (0.0%) | 0 (0.0%) |
| 5 or more Vehicles | 0 (0.0%) | 0 (0.0%) |
| Total | 148 (100.0%) | 81 (100.0%) |
Commute Time in Gorst
The most frequently occuring commute durations in Gorst are 35 to 39 minutes (61 commuters, 30.5%), 10 to 14 minutes (43 commuters, 21.5%), and 15 to 19 minutes (38 commuters, 19.0%).
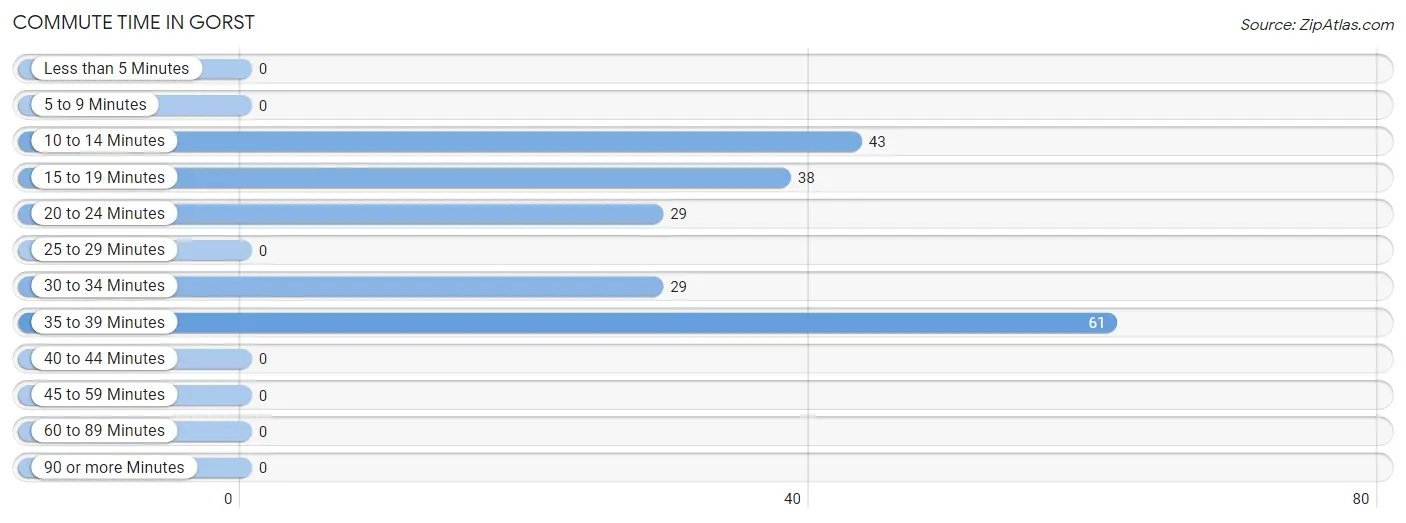
| Commute Time | # Commuters | % Commuters |
| Less than 5 Minutes | 0 | 0.0% |
| 5 to 9 Minutes | 0 | 0.0% |
| 10 to 14 Minutes | 43 | 21.5% |
| 15 to 19 Minutes | 38 | 19.0% |
| 20 to 24 Minutes | 29 | 14.5% |
| 25 to 29 Minutes | 0 | 0.0% |
| 30 to 34 Minutes | 29 | 14.5% |
| 35 to 39 Minutes | 61 | 30.5% |
| 40 to 44 Minutes | 0 | 0.0% |
| 45 to 59 Minutes | 0 | 0.0% |
| 60 to 89 Minutes | 0 | 0.0% |
| 90 or more Minutes | 0 | 0.0% |
Commute Time by Sex in Gorst
The most common commute times in Gorst are 35 to 39 minutes (61 commuters, 51.3%) for males and 15 to 19 minutes (38 commuters, 46.9%) for females.
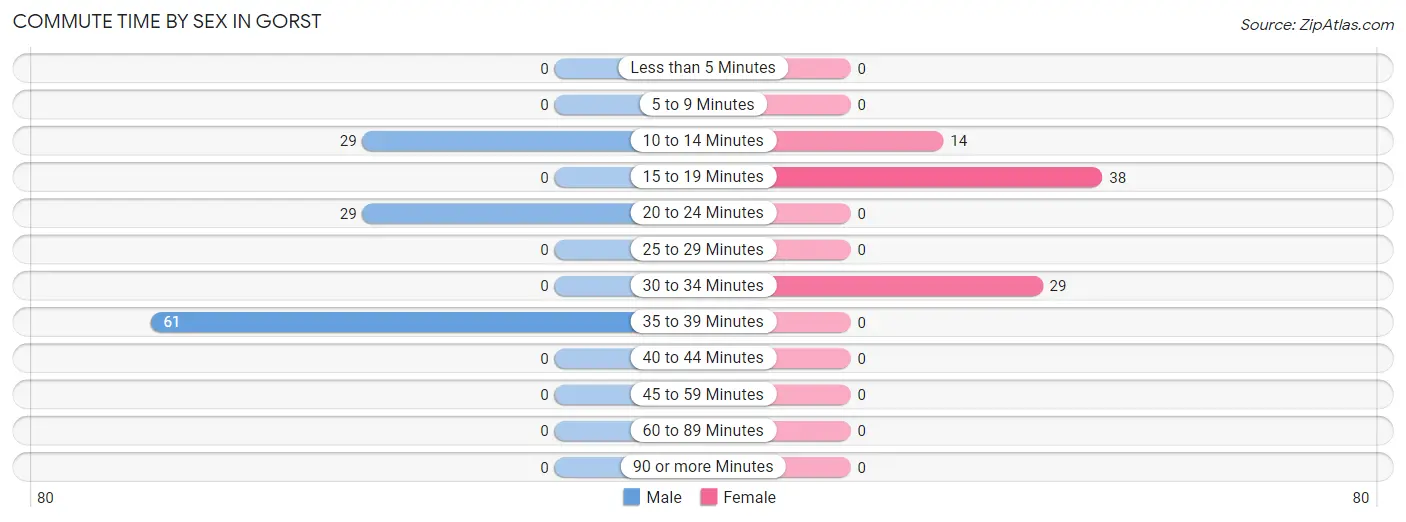
| Commute Time | Male | Female |
| Less than 5 Minutes | 0 (0.0%) | 0 (0.0%) |
| 5 to 9 Minutes | 0 (0.0%) | 0 (0.0%) |
| 10 to 14 Minutes | 29 (24.4%) | 14 (17.3%) |
| 15 to 19 Minutes | 0 (0.0%) | 38 (46.9%) |
| 20 to 24 Minutes | 29 (24.4%) | 0 (0.0%) |
| 25 to 29 Minutes | 0 (0.0%) | 0 (0.0%) |
| 30 to 34 Minutes | 0 (0.0%) | 29 (35.8%) |
| 35 to 39 Minutes | 61 (51.3%) | 0 (0.0%) |
| 40 to 44 Minutes | 0 (0.0%) | 0 (0.0%) |
| 45 to 59 Minutes | 0 (0.0%) | 0 (0.0%) |
| 60 to 89 Minutes | 0 (0.0%) | 0 (0.0%) |
| 90 or more Minutes | 0 (0.0%) | 0 (0.0%) |
Time of Departure to Work by Sex in Gorst
The most frequent times of departure to work in Gorst are 5:00 AM to 5:29 AM (76, 63.9%) for males and 8:00 AM to 8:29 AM (38, 46.9%) for females.
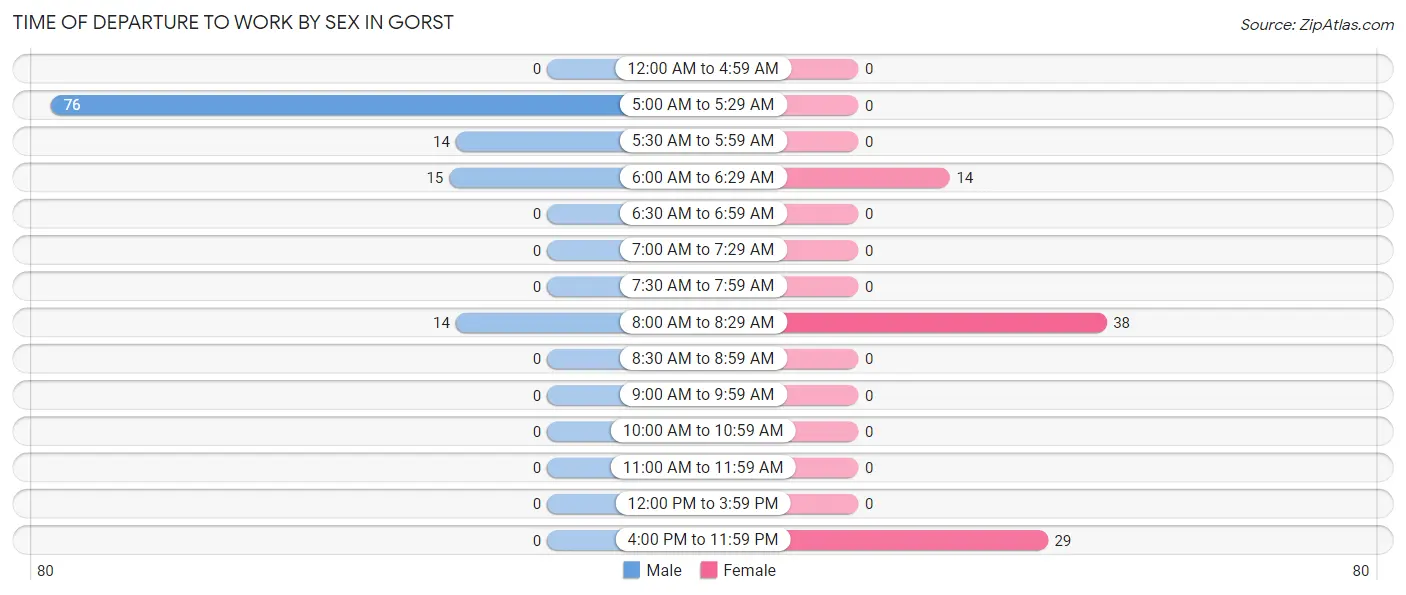
| Time of Departure | Male | Female |
| 12:00 AM to 4:59 AM | 0 (0.0%) | 0 (0.0%) |
| 5:00 AM to 5:29 AM | 76 (63.9%) | 0 (0.0%) |
| 5:30 AM to 5:59 AM | 14 (11.8%) | 0 (0.0%) |
| 6:00 AM to 6:29 AM | 15 (12.6%) | 14 (17.3%) |
| 6:30 AM to 6:59 AM | 0 (0.0%) | 0 (0.0%) |
| 7:00 AM to 7:29 AM | 0 (0.0%) | 0 (0.0%) |
| 7:30 AM to 7:59 AM | 0 (0.0%) | 0 (0.0%) |
| 8:00 AM to 8:29 AM | 14 (11.8%) | 38 (46.9%) |
| 8:30 AM to 8:59 AM | 0 (0.0%) | 0 (0.0%) |
| 9:00 AM to 9:59 AM | 0 (0.0%) | 0 (0.0%) |
| 10:00 AM to 10:59 AM | 0 (0.0%) | 0 (0.0%) |
| 11:00 AM to 11:59 AM | 0 (0.0%) | 0 (0.0%) |
| 12:00 PM to 3:59 PM | 0 (0.0%) | 0 (0.0%) |
| 4:00 PM to 11:59 PM | 0 (0.0%) | 29 (35.8%) |
| Total | 119 (100.0%) | 81 (100.0%) |
Housing Occupancy in Gorst
Occupancy by Ownership in Gorst
Of the total 186 dwellings in Gorst, owner-occupied units account for 157 (84.4%), while renter-occupied units make up 29 (15.6%).
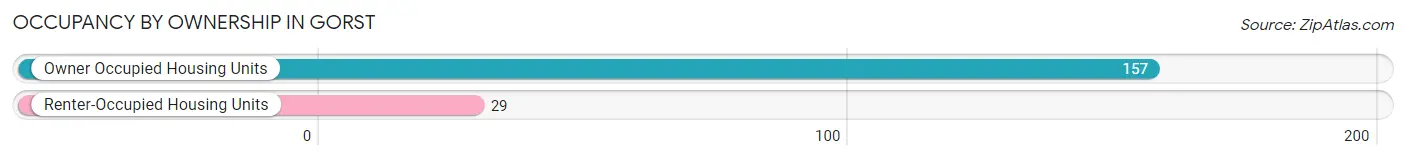
| Occupancy | # Housing Units | % Housing Units |
| Owner Occupied Housing Units | 157 | 84.4% |
| Renter-Occupied Housing Units | 29 | 15.6% |
| Total Occupied Housing Units | 186 | 100.0% |
Occupancy by Household Size in Gorst
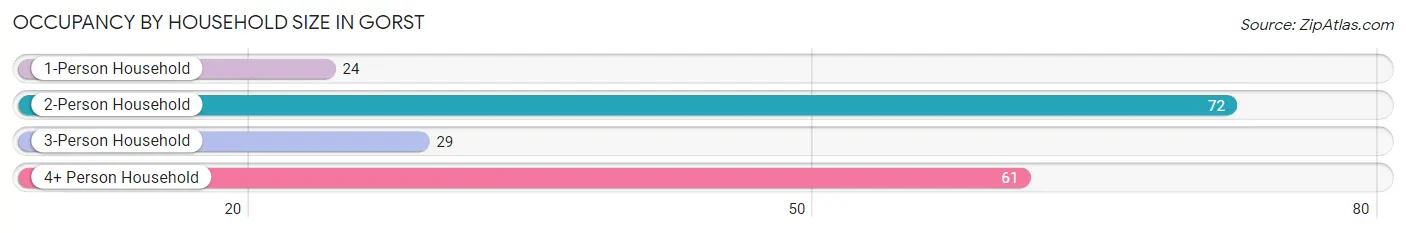
| Household Size | # Housing Units | % Housing Units |
| 1-Person Household | 24 | 12.9% |
| 2-Person Household | 72 | 38.7% |
| 3-Person Household | 29 | 15.6% |
| 4+ Person Household | 61 | 32.8% |
| Total Housing Units | 186 | 100.0% |
Occupancy by Ownership by Household Size in Gorst
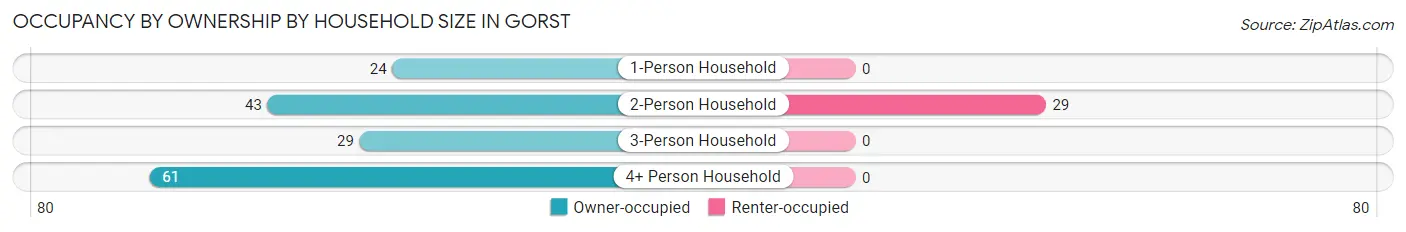
| Household Size | Owner-occupied | Renter-occupied |
| 1-Person Household | 24 (100.0%) | 0 (0.0%) |
| 2-Person Household | 43 (59.7%) | 29 (40.3%) |
| 3-Person Household | 29 (100.0%) | 0 (0.0%) |
| 4+ Person Household | 61 (100.0%) | 0 (0.0%) |
| Total Housing Units | 157 (84.4%) | 29 (15.6%) |
Occupancy by Educational Attainment in Gorst
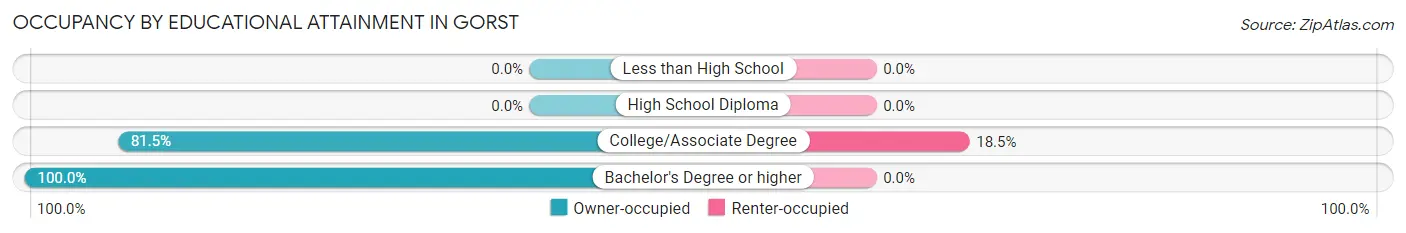
| Household Size | Owner-occupied | Renter-occupied |
| Less than High School | 0 (0.0%) | 0 (0.0%) |
| High School Diploma | 0 (0.0%) | 0 (0.0%) |
| College/Associate Degree | 128 (81.5%) | 29 (18.5%) |
| Bachelor's Degree or higher | 29 (100.0%) | 0 (0.0%) |
Occupancy by Age of Householder in Gorst
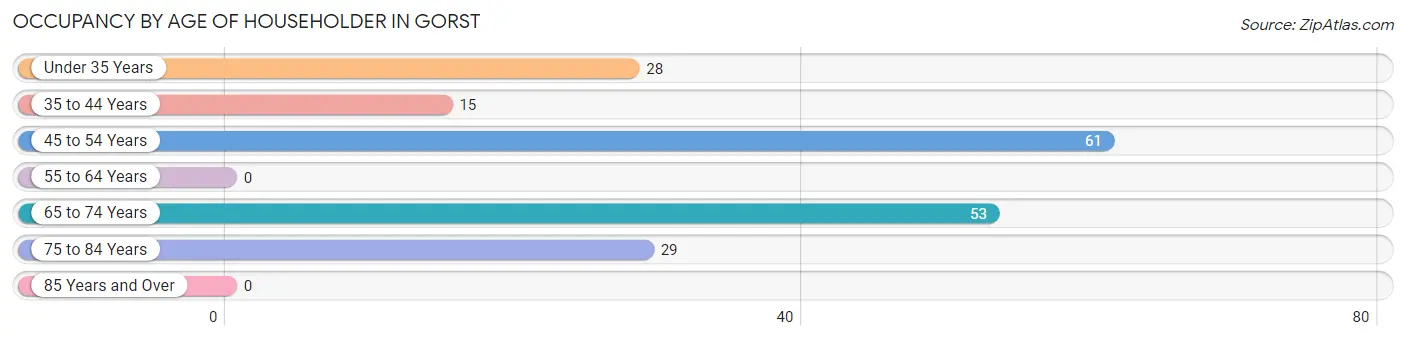
| Age Bracket | # Households | % Households |
| Under 35 Years | 28 | 15.0% |
| 35 to 44 Years | 15 | 8.1% |
| 45 to 54 Years | 61 | 32.8% |
| 55 to 64 Years | 0 | 0.0% |
| 65 to 74 Years | 53 | 28.5% |
| 75 to 84 Years | 29 | 15.6% |
| 85 Years and Over | 0 | 0.0% |
| Total | 186 | 100.0% |
Housing Finances in Gorst
Median Income by Occupancy in Gorst
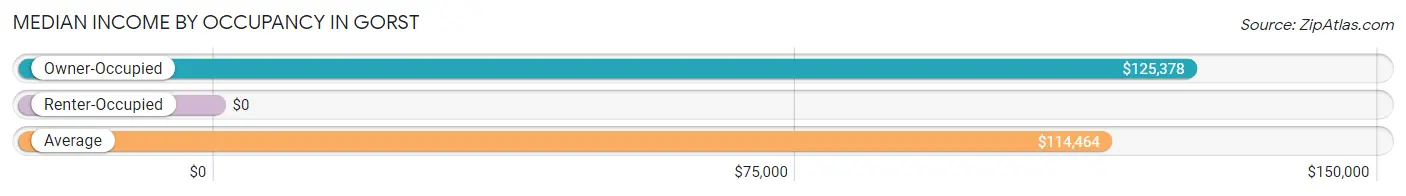
| Occupancy Type | # Households | Median Income |
| Owner-Occupied | 157 (84.4%) | $125,378 |
| Renter-Occupied | 29 (15.6%) | $0 |
| Average | 186 (100.0%) | $114,464 |
Occupancy by Householder Income Bracket in Gorst
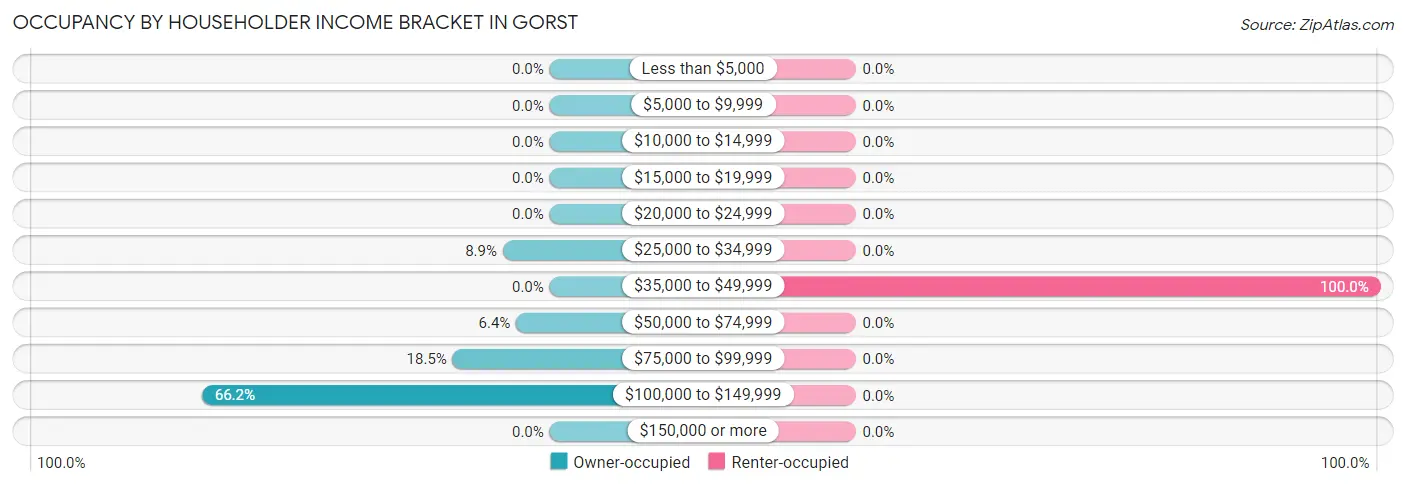
| Income Bracket | Owner-occupied | Renter-occupied |
| Less than $5,000 | 0 (0.0%) | 0 (0.0%) |
| $5,000 to $9,999 | 0 (0.0%) | 0 (0.0%) |
| $10,000 to $14,999 | 0 (0.0%) | 0 (0.0%) |
| $15,000 to $19,999 | 0 (0.0%) | 0 (0.0%) |
| $20,000 to $24,999 | 0 (0.0%) | 0 (0.0%) |
| $25,000 to $34,999 | 14 (8.9%) | 0 (0.0%) |
| $35,000 to $49,999 | 0 (0.0%) | 29 (100.0%) |
| $50,000 to $74,999 | 10 (6.4%) | 0 (0.0%) |
| $75,000 to $99,999 | 29 (18.5%) | 0 (0.0%) |
| $100,000 to $149,999 | 104 (66.2%) | 0 (0.0%) |
| $150,000 or more | 0 (0.0%) | 0 (0.0%) |
| Total | 157 (100.0%) | 29 (100.0%) |
Monthly Housing Cost Tiers in Gorst
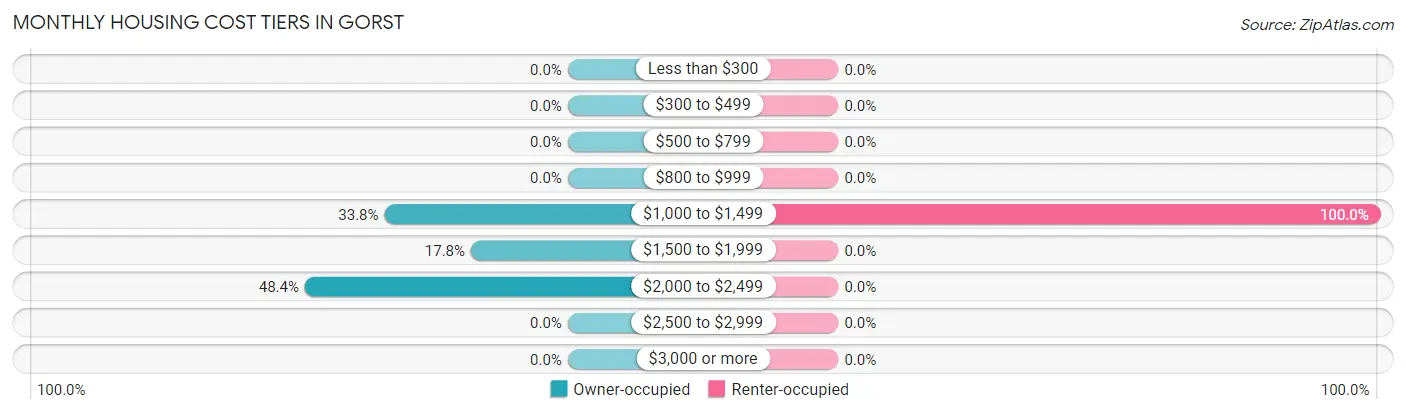
| Monthly Cost | Owner-occupied | Renter-occupied |
| Less than $300 | 0 (0.0%) | 0 (0.0%) |
| $300 to $499 | 0 (0.0%) | 0 (0.0%) |
| $500 to $799 | 0 (0.0%) | 0 (0.0%) |
| $800 to $999 | 0 (0.0%) | 0 (0.0%) |
| $1,000 to $1,499 | 53 (33.8%) | 29 (100.0%) |
| $1,500 to $1,999 | 28 (17.8%) | 0 (0.0%) |
| $2,000 to $2,499 | 76 (48.4%) | 0 (0.0%) |
| $2,500 to $2,999 | 0 (0.0%) | 0 (0.0%) |
| $3,000 or more | 0 (0.0%) | 0 (0.0%) |
| Total | 157 (100.0%) | 29 (100.0%) |
Physical Housing Characteristics in Gorst
Housing Structures in Gorst
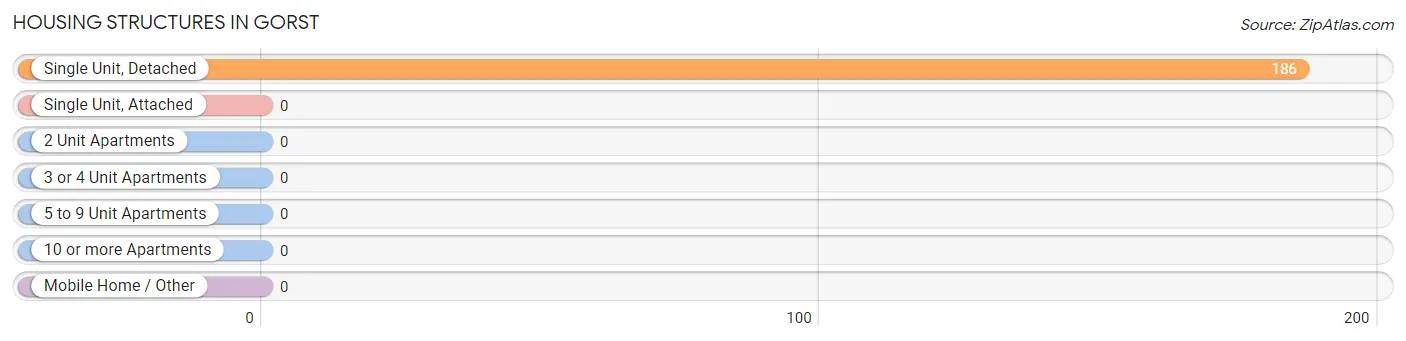
| Structure Type | # Housing Units | % Housing Units |
| Single Unit, Detached | 186 | 100.0% |
| Single Unit, Attached | 0 | 0.0% |
| 2 Unit Apartments | 0 | 0.0% |
| 3 or 4 Unit Apartments | 0 | 0.0% |
| 5 to 9 Unit Apartments | 0 | 0.0% |
| 10 or more Apartments | 0 | 0.0% |
| Mobile Home / Other | 0 | 0.0% |
| Total | 186 | 100.0% |
Housing Structures by Occupancy in Gorst
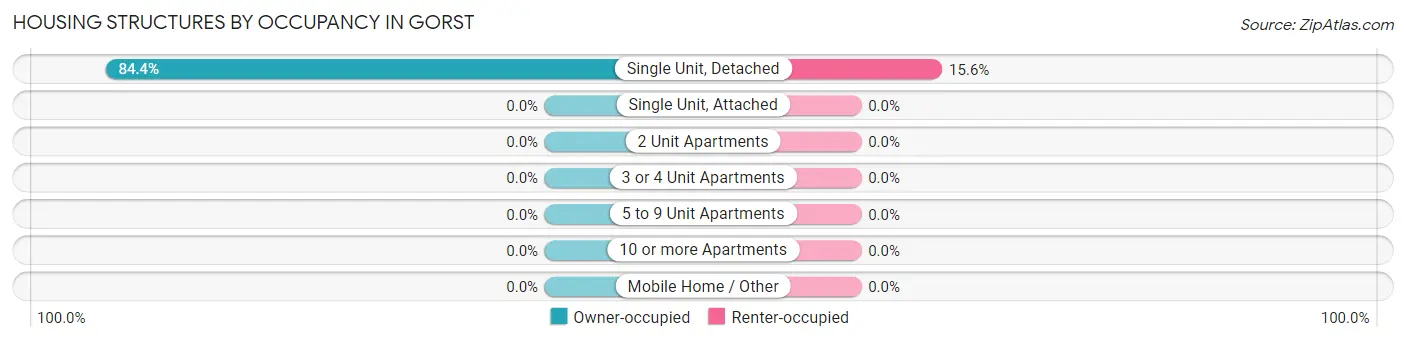
| Structure Type | Owner-occupied | Renter-occupied |
| Single Unit, Detached | 157 (84.4%) | 29 (15.6%) |
| Single Unit, Attached | 0 (0.0%) | 0 (0.0%) |
| 2 Unit Apartments | 0 (0.0%) | 0 (0.0%) |
| 3 or 4 Unit Apartments | 0 (0.0%) | 0 (0.0%) |
| 5 to 9 Unit Apartments | 0 (0.0%) | 0 (0.0%) |
| 10 or more Apartments | 0 (0.0%) | 0 (0.0%) |
| Mobile Home / Other | 0 (0.0%) | 0 (0.0%) |
| Total | 157 (84.4%) | 29 (15.6%) |
Housing Structures by Number of Rooms in Gorst
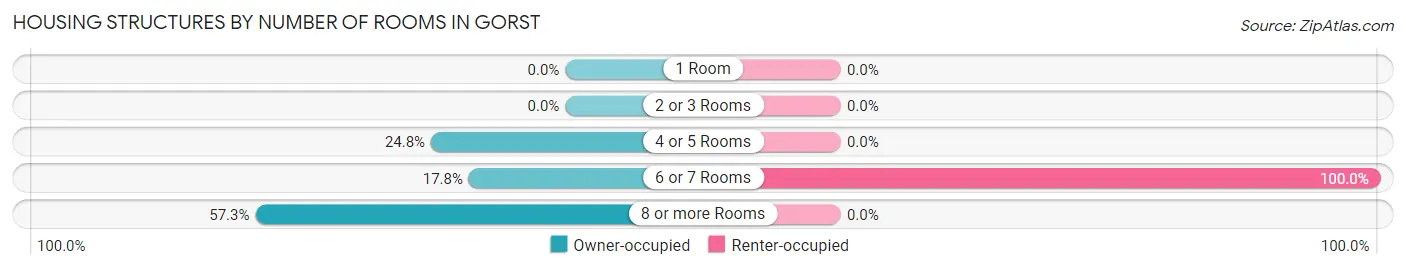
| Number of Rooms | Owner-occupied | Renter-occupied |
| 1 Room | 0 (0.0%) | 0 (0.0%) |
| 2 or 3 Rooms | 0 (0.0%) | 0 (0.0%) |
| 4 or 5 Rooms | 39 (24.8%) | 0 (0.0%) |
| 6 or 7 Rooms | 28 (17.8%) | 29 (100.0%) |
| 8 or more Rooms | 90 (57.3%) | 0 (0.0%) |
| Total | 157 (100.0%) | 29 (100.0%) |
Housing Structure by Heating Type in Gorst
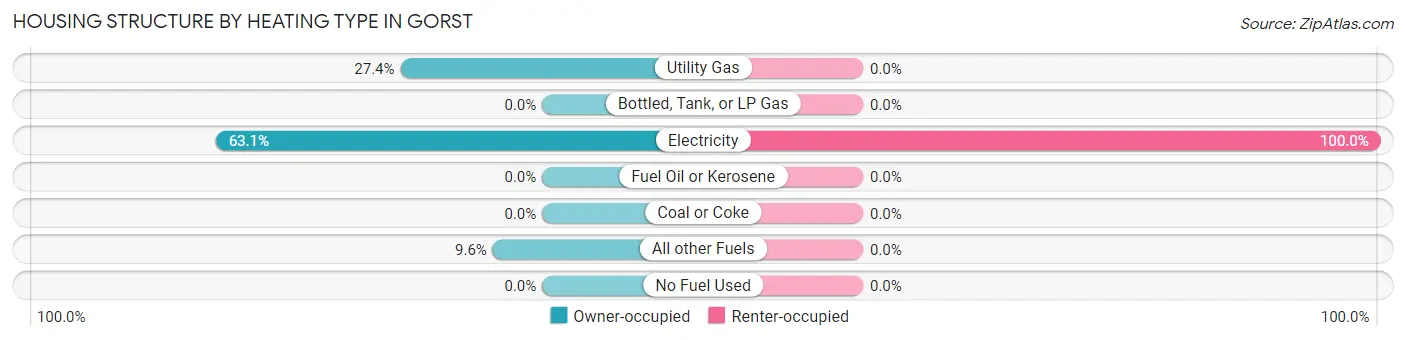
| Heating Type | Owner-occupied | Renter-occupied |
| Utility Gas | 43 (27.4%) | 0 (0.0%) |
| Bottled, Tank, or LP Gas | 0 (0.0%) | 0 (0.0%) |
| Electricity | 99 (63.1%) | 29 (100.0%) |
| Fuel Oil or Kerosene | 0 (0.0%) | 0 (0.0%) |
| Coal or Coke | 0 (0.0%) | 0 (0.0%) |
| All other Fuels | 15 (9.6%) | 0 (0.0%) |
| No Fuel Used | 0 (0.0%) | 0 (0.0%) |
| Total | 157 (100.0%) | 29 (100.0%) |
Household Vehicle Usage in Gorst
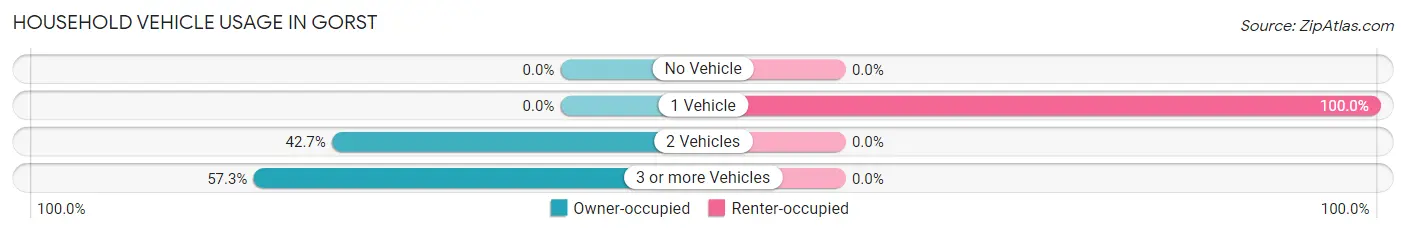
| Vehicles per Household | Owner-occupied | Renter-occupied |
| No Vehicle | 0 (0.0%) | 0 (0.0%) |
| 1 Vehicle | 0 (0.0%) | 29 (100.0%) |
| 2 Vehicles | 67 (42.7%) | 0 (0.0%) |
| 3 or more Vehicles | 90 (57.3%) | 0 (0.0%) |
| Total | 157 (100.0%) | 29 (100.0%) |
Real Estate & Mortgages in Gorst
Real Estate and Mortgage Overview in Gorst
| Characteristic | Without Mortgage | With Mortgage |
| Housing Units | 0 | 157 |
| Median Property Value | - | - |
| Median Household Income | - | - |
| Monthly Housing Costs | - | - |
| Real Estate Taxes | - | - |
Property Value by Mortgage Status in Gorst
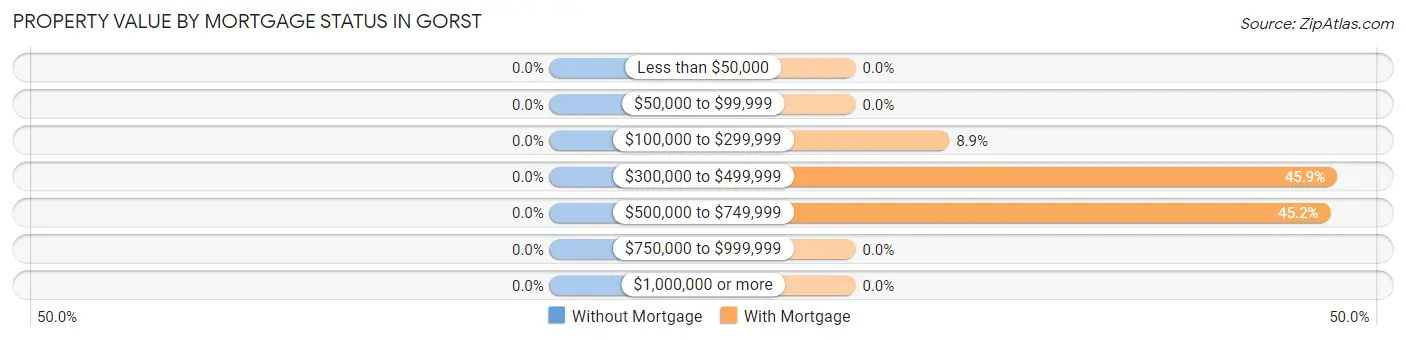
| Property Value | Without Mortgage | With Mortgage |
| Less than $50,000 | 0 (0.0%) | 0 (0.0%) |
| $50,000 to $99,999 | 0 (0.0%) | 0 (0.0%) |
| $100,000 to $299,999 | 0 (0.0%) | 14 (8.9%) |
| $300,000 to $499,999 | 0 (0.0%) | 72 (45.9%) |
| $500,000 to $749,999 | 0 (0.0%) | 71 (45.2%) |
| $750,000 to $999,999 | 0 (0.0%) | 0 (0.0%) |
| $1,000,000 or more | 0 (0.0%) | 0 (0.0%) |
| Total | 0 (0.0%) | 157 (100.0%) |
Household Income by Mortgage Status in Gorst
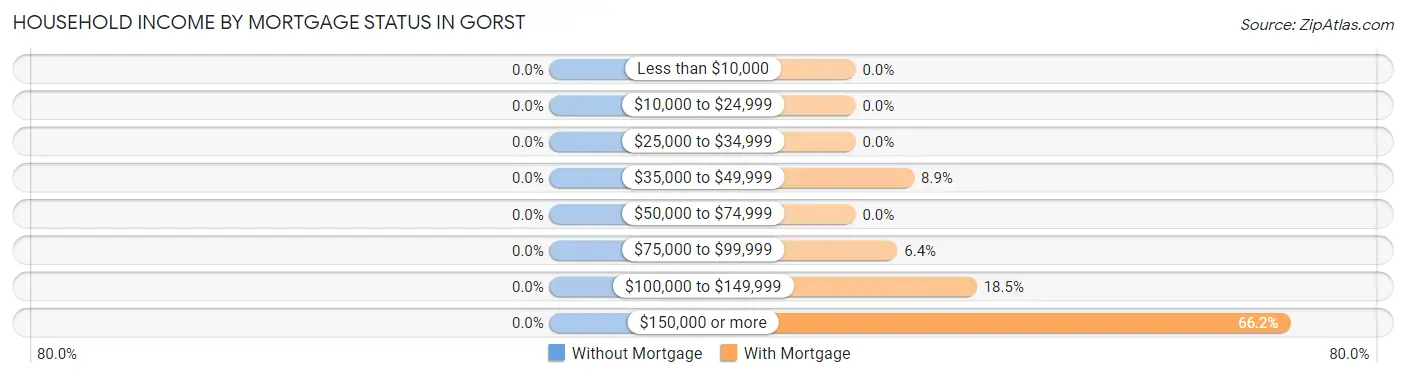
| Household Income | Without Mortgage | With Mortgage |
| Less than $10,000 | 0 (0.0%) | 0 (0.0%) |
| $10,000 to $24,999 | 0 (0.0%) | 0 (0.0%) |
| $25,000 to $34,999 | 0 (0.0%) | 0 (0.0%) |
| $35,000 to $49,999 | 0 (0.0%) | 14 (8.9%) |
| $50,000 to $74,999 | 0 (0.0%) | 0 (0.0%) |
| $75,000 to $99,999 | 0 (0.0%) | 10 (6.4%) |
| $100,000 to $149,999 | 0 (0.0%) | 29 (18.5%) |
| $150,000 or more | 0 (0.0%) | 104 (66.2%) |
| Total | 0 (0.0%) | 157 (100.0%) |
Property Value to Household Income Ratio in Gorst
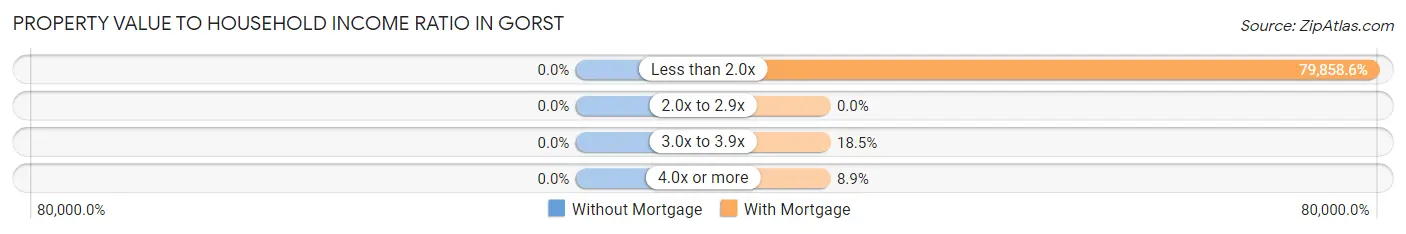
| Value-to-Income Ratio | Without Mortgage | With Mortgage |
| Less than 2.0x | 0 (0.0%) | 125,378 (79,858.6%) |
| 2.0x to 2.9x | 0 (0.0%) | 0 (0.0%) |
| 3.0x to 3.9x | 0 (0.0%) | 29 (18.5%) |
| 4.0x or more | 0 (0.0%) | 14 (8.9%) |
| Total | 0 (0.0%) | 157 (100.0%) |
Real Estate Taxes by Mortgage Status in Gorst
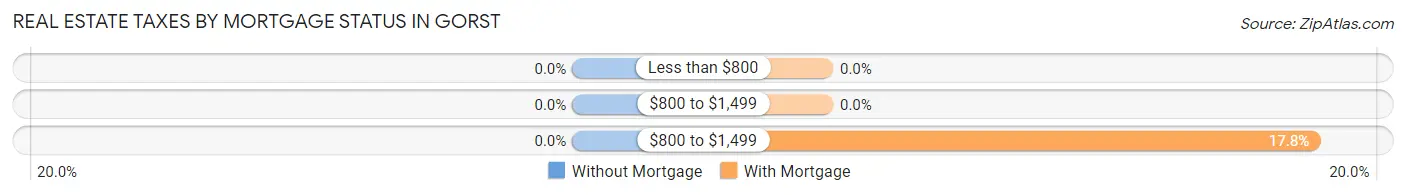
| Property Taxes | Without Mortgage | With Mortgage |
| Less than $800 | 0 (0.0%) | 0 (0.0%) |
| $800 to $1,499 | 0 (0.0%) | 0 (0.0%) |
| $800 to $1,499 | 0 (0.0%) | 28 (17.8%) |
| Total | 0 (0.0%) | 157 (100.0%) |
Health & Disability in Gorst
Health Insurance Coverage by Age in Gorst
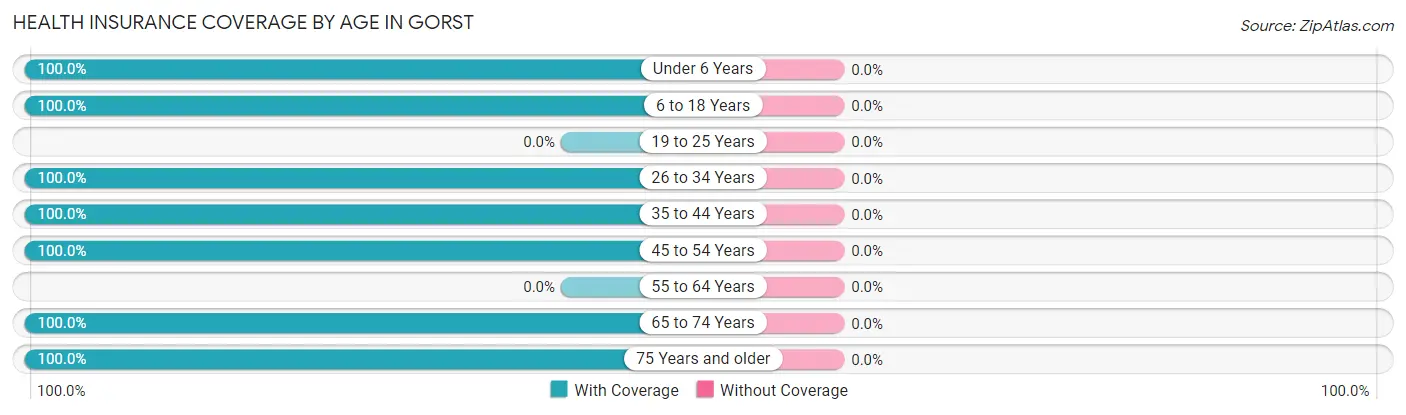
| Age Bracket | With Coverage | Without Coverage |
| Under 6 Years | 25 (100.0%) | 0 (0.0%) |
| 6 to 18 Years | 150 (100.0%) | 0 (0.0%) |
| 19 to 25 Years | 0 (0.0%) | 0 (0.0%) |
| 26 to 34 Years | 57 (100.0%) | 0 (0.0%) |
| 35 to 44 Years | 66 (100.0%) | 0 (0.0%) |
| 45 to 54 Years | 87 (100.0%) | 0 (0.0%) |
| 55 to 64 Years | 0 (0.0%) | 0 (0.0%) |
| 65 to 74 Years | 53 (100.0%) | 0 (0.0%) |
| 75 Years and older | 57 (100.0%) | 0 (0.0%) |
| Total | 495 (100.0%) | 0 (0.0%) |
Health Insurance Coverage by Citizenship Status in Gorst
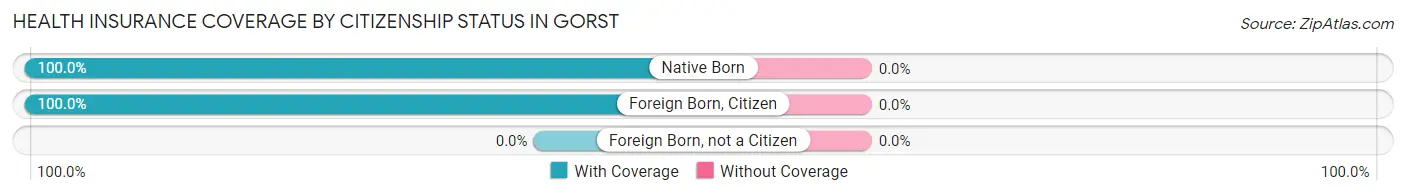
| Citizenship Status | With Coverage | Without Coverage |
| Native Born | 25 (100.0%) | 0 (0.0%) |
| Foreign Born, Citizen | 150 (100.0%) | 0 (0.0%) |
| Foreign Born, not a Citizen | 0 (0.0%) | 0 (0.0%) |
Health Insurance Coverage by Household Income in Gorst
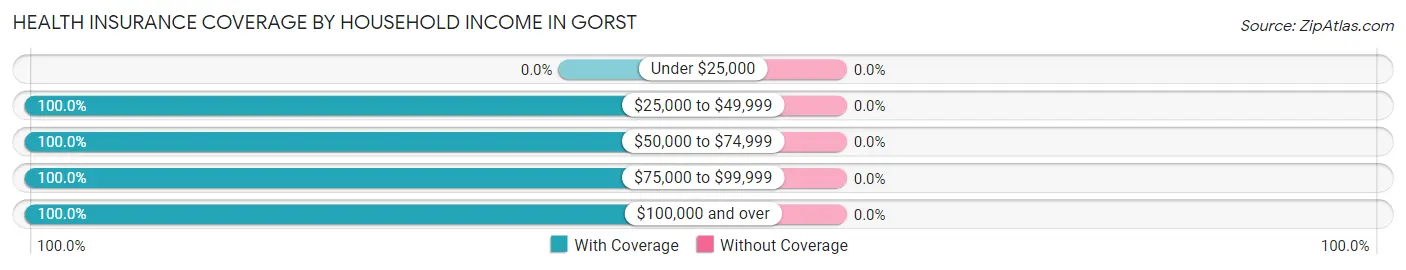
| Household Income | With Coverage | Without Coverage |
| Under $25,000 | 0 (0.0%) | 0 (0.0%) |
| $25,000 to $49,999 | 96 (100.0%) | 0 (0.0%) |
| $50,000 to $74,999 | 10 (100.0%) | 0 (0.0%) |
| $75,000 to $99,999 | 57 (100.0%) | 0 (0.0%) |
| $100,000 and over | 332 (100.0%) | 0 (0.0%) |
Public vs Private Health Insurance Coverage by Age in Gorst
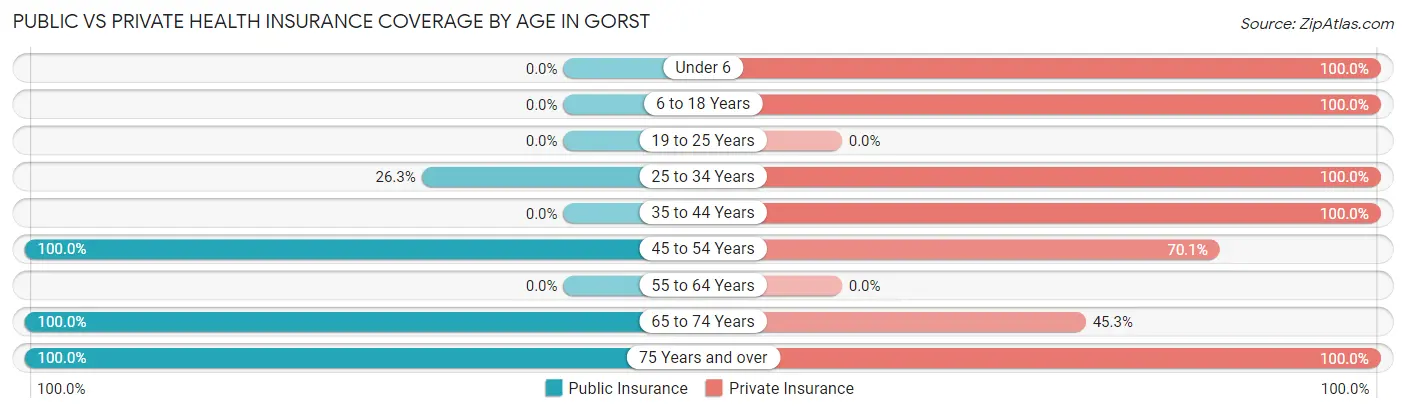
| Age Bracket | Public Insurance | Private Insurance |
| Under 6 | 0 (0.0%) | 25 (100.0%) |
| 6 to 18 Years | 0 (0.0%) | 150 (100.0%) |
| 19 to 25 Years | 0 (0.0%) | 0 (0.0%) |
| 25 to 34 Years | 15 (26.3%) | 57 (100.0%) |
| 35 to 44 Years | 0 (0.0%) | 66 (100.0%) |
| 45 to 54 Years | 87 (100.0%) | 61 (70.1%) |
| 55 to 64 Years | 0 (0.0%) | 0 (0.0%) |
| 65 to 74 Years | 53 (100.0%) | 24 (45.3%) |
| 75 Years and over | 57 (100.0%) | 57 (100.0%) |
| Total | 212 (42.8%) | 440 (88.9%) |
Disability Status by Sex by Age in Gorst
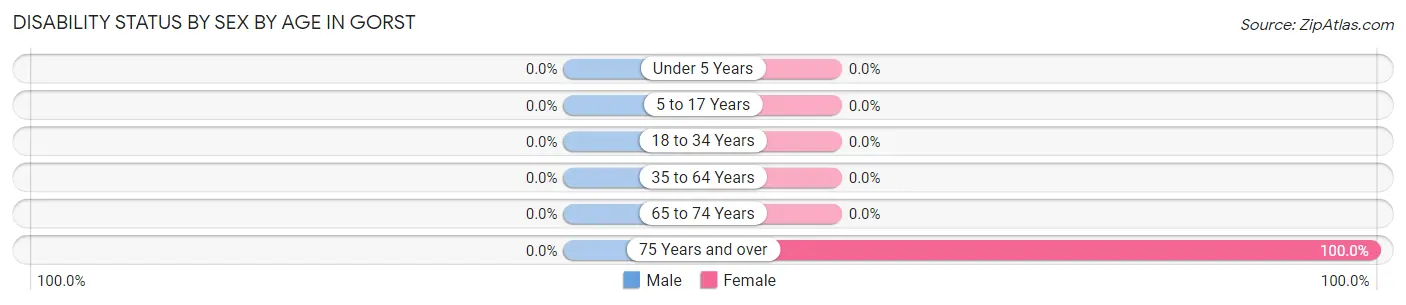
| Age Bracket | Male | Female |
| Under 5 Years | 0 (0.0%) | 0 (0.0%) |
| 5 to 17 Years | 0 (0.0%) | 0 (0.0%) |
| 18 to 34 Years | 0 (0.0%) | 0 (0.0%) |
| 35 to 64 Years | 0 (0.0%) | 0 (0.0%) |
| 65 to 74 Years | 0 (0.0%) | 0 (0.0%) |
| 75 Years and over | 0 (0.0%) | 28 (100.0%) |
Disability Class by Sex by Age in Gorst
Disability Class: Hearing Difficulty
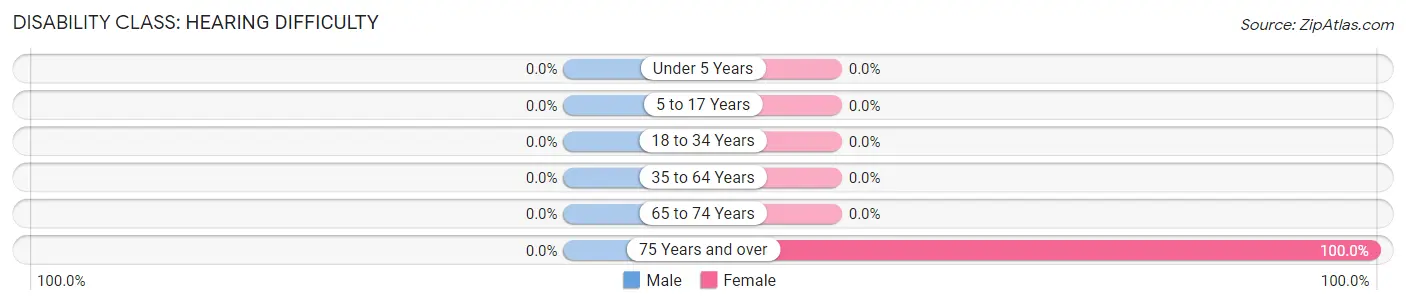
| Age Bracket | Male | Female |
| Under 5 Years | 0 (0.0%) | 0 (0.0%) |
| 5 to 17 Years | 0 (0.0%) | 0 (0.0%) |
| 18 to 34 Years | 0 (0.0%) | 0 (0.0%) |
| 35 to 64 Years | 0 (0.0%) | 0 (0.0%) |
| 65 to 74 Years | 0 (0.0%) | 0 (0.0%) |
| 75 Years and over | 0 (0.0%) | 28 (100.0%) |
Disability Class: Vision Difficulty
| Age Bracket | Male | Female |
| Under 5 Years | 0 (0.0%) | 0 (0.0%) |
| 5 to 17 Years | 0 (0.0%) | 0 (0.0%) |
| 18 to 34 Years | 0 (0.0%) | 0 (0.0%) |
| 35 to 64 Years | 0 (0.0%) | 0 (0.0%) |
| 65 to 74 Years | 0 (0.0%) | 0 (0.0%) |
| 75 Years and over | 0 (0.0%) | 0 (0.0%) |
Disability Class: Cognitive Difficulty
| Age Bracket | Male | Female |
| 5 to 17 Years | 0 (0.0%) | 0 (0.0%) |
| 18 to 34 Years | 0 (0.0%) | 0 (0.0%) |
| 35 to 64 Years | 0 (0.0%) | 0 (0.0%) |
| 65 to 74 Years | 0 (0.0%) | 0 (0.0%) |
| 75 Years and over | 0 (0.0%) | 0 (0.0%) |
Disability Class: Ambulatory Difficulty
| Age Bracket | Male | Female |
| 5 to 17 Years | 0 (0.0%) | 0 (0.0%) |
| 18 to 34 Years | 0 (0.0%) | 0 (0.0%) |
| 35 to 64 Years | 0 (0.0%) | 0 (0.0%) |
| 65 to 74 Years | 0 (0.0%) | 0 (0.0%) |
| 75 Years and over | 0 (0.0%) | 0 (0.0%) |
Disability Class: Self-Care Difficulty
| Age Bracket | Male | Female |
| 5 to 17 Years | 0 (0.0%) | 0 (0.0%) |
| 18 to 34 Years | 0 (0.0%) | 0 (0.0%) |
| 35 to 64 Years | 0 (0.0%) | 0 (0.0%) |
| 65 to 74 Years | 0 (0.0%) | 0 (0.0%) |
| 75 Years and over | 0 (0.0%) | 0 (0.0%) |
Technology Access in Gorst
Computing Device Access in Gorst
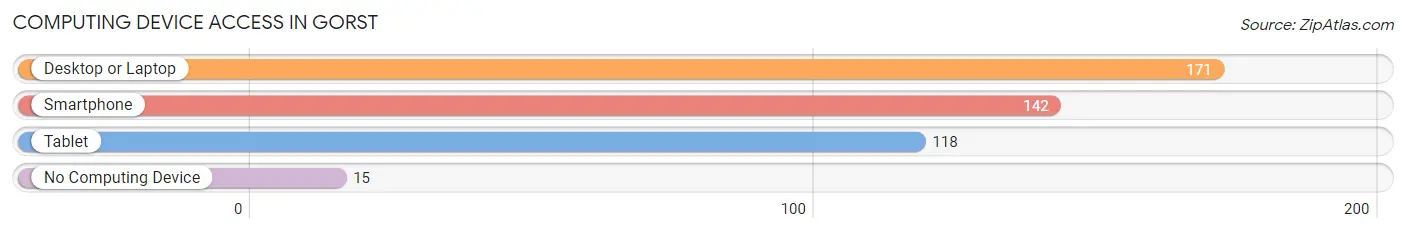
| Device Type | # Households | % Households |
| Desktop or Laptop | 171 | 91.9% |
| Smartphone | 142 | 76.3% |
| Tablet | 118 | 63.4% |
| No Computing Device | 15 | 8.1% |
| Total | 186 | 100.0% |
Internet Access in Gorst
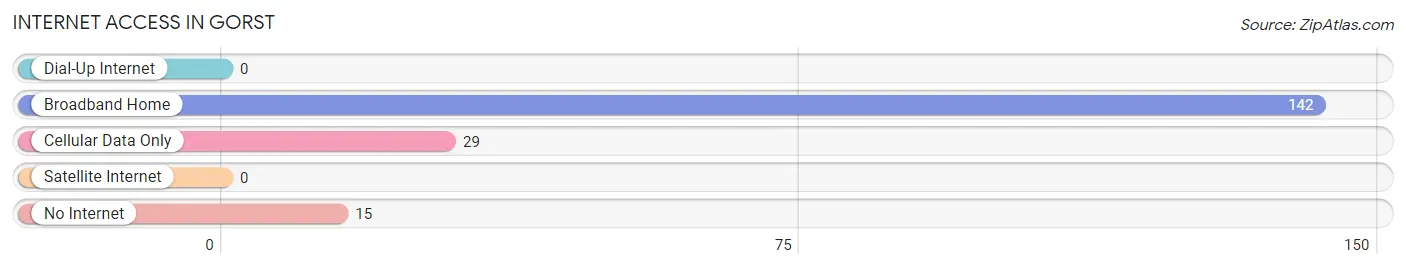
| Internet Type | # Households | % Households |
| Dial-Up Internet | 0 | 0.0% |
| Broadband Home | 142 | 76.3% |
| Cellular Data Only | 29 | 15.6% |
| Satellite Internet | 0 | 0.0% |
| No Internet | 15 | 8.1% |
| Total | 186 | 100.0% |
Gorst Summary
Gorst is a small unincorporated community located in Kitsap County, Washington, United States. It is situated along the Kitsap Peninsula, approximately 8 miles south of the city of Bremerton and 8 miles north of the city of Port Orchard. The population of Gorst was estimated to be 1,845 in 2019.
History
Gorst was first settled in the late 1800s by a group of Scandinavian immigrants. The town was named after the Gorst family, who were among the first settlers. The Gorst family owned a large amount of land in the area, and the town was built around their homestead.
The town was officially incorporated in 1909, and the first mayor was John Gorst. The town quickly grew and became a popular destination for tourists and travelers. The town was known for its beautiful scenery and its abundance of natural resources.
In the early 1900s, Gorst was a major hub for the logging industry. The town was home to several sawmills and lumber yards, and the timber industry provided many jobs for the local residents.
In the 1950s, the town began to decline as the logging industry moved away from the area. The town was also affected by the closure of the nearby Naval Station Bremerton in the late 1960s.
Geography
Gorst is located in the Kitsap Peninsula, approximately 8 miles south of the city of Bremerton and 8 miles north of the city of Port Orchard. The town is situated on the western shore of Sinclair Inlet, which is part of the Puget Sound.
The town is surrounded by lush forests and rolling hills. The nearby Olympic Mountains provide a stunning backdrop to the town.
Economy
Gorst is primarily a residential community, and the local economy is largely based on tourism and service industries. The town is home to several small businesses, including restaurants, shops, and galleries.
The town is also home to a number of marinas, which provide services to boaters and fishermen. The nearby Naval Station Bremerton also provides employment opportunities for many of the town’s residents.
Demographics
Gorst has a population of 1,845, according to the 2019 census. The town is predominantly white, with a small percentage of African American, Hispanic, and Asian residents. The median household income is $50,000, and the median home value is $250,000.
The town is served by the Central Kitsap School District, which includes several elementary, middle, and high schools. The town is also home to Olympic College, which offers a variety of degree and certificate programs.
Conclusion
Gorst is a small unincorporated community located in Kitsap County, Washington. The town was first settled in the late 1800s by a group of Scandinavian immigrants, and it was officially incorporated in 1909. The town is primarily a residential community, and the local economy is largely based on tourism and service industries. The population of Gorst was estimated to be 1,845 in 2019. The town is predominantly white, with a small percentage of African American, Hispanic, and Asian residents. The town is served by the Central Kitsap School District, and it is home to Olympic College.
Common Questions
What is Per Capita Income in Gorst?
Per Capita income in Gorst is $33,231.
What is the Median Family Income in Gorst?
Median Family Income in Gorst is $125,296.
What is the Median Household income in Gorst?
Median Household Income in Gorst is $114,464.
What is Income or Wage Gap in Gorst?
Income or Wage Gap in Gorst is 67.4%.
Women in Gorst earn 32.6 cents for every dollar earned by a man.
What is Inequality or Gini Index in Gorst?
Inequality or Gini Index in Gorst is 0.23.
What is the Total Population of Gorst?
Total Population of Gorst is 495.
What is the Total Male Population of Gorst?
Total Male Population of Gorst is 187.
What is the Total Female Population of Gorst?
Total Female Population of Gorst is 308.
What is the Ratio of Males per 100 Females in Gorst?
There are 60.71 Males per 100 Females in Gorst.
What is the Ratio of Females per 100 Males in Gorst?
There are 164.71 Females per 100 Males in Gorst.
What is the Median Population Age in Gorst?
Median Population Age in Gorst is 40.4 Years.
What is the Average Family Size in Gorst
Average Family Size in Gorst is 2.9 People.
What is the Average Household Size in Gorst
Average Household Size in Gorst is 2.7 People.
How Large is the Labor Force in Gorst?
There are 255 People in the Labor Forcein in Gorst.
What is the Percentage of People in the Labor Force in Gorst?
79.7% of People are in the Labor Force in Gorst.
What is the Unemployment Rate in Gorst?
Unemployment Rate in Gorst is 10.2%.