Zip Codes with the Highest Percentage of Population Employed in Health Diagnosing & Treating in Silverdale, WA
RELATED REPORTS & OPTIONS
Health Diagnosing & Treating
Silverdale
Compare Zip Codes
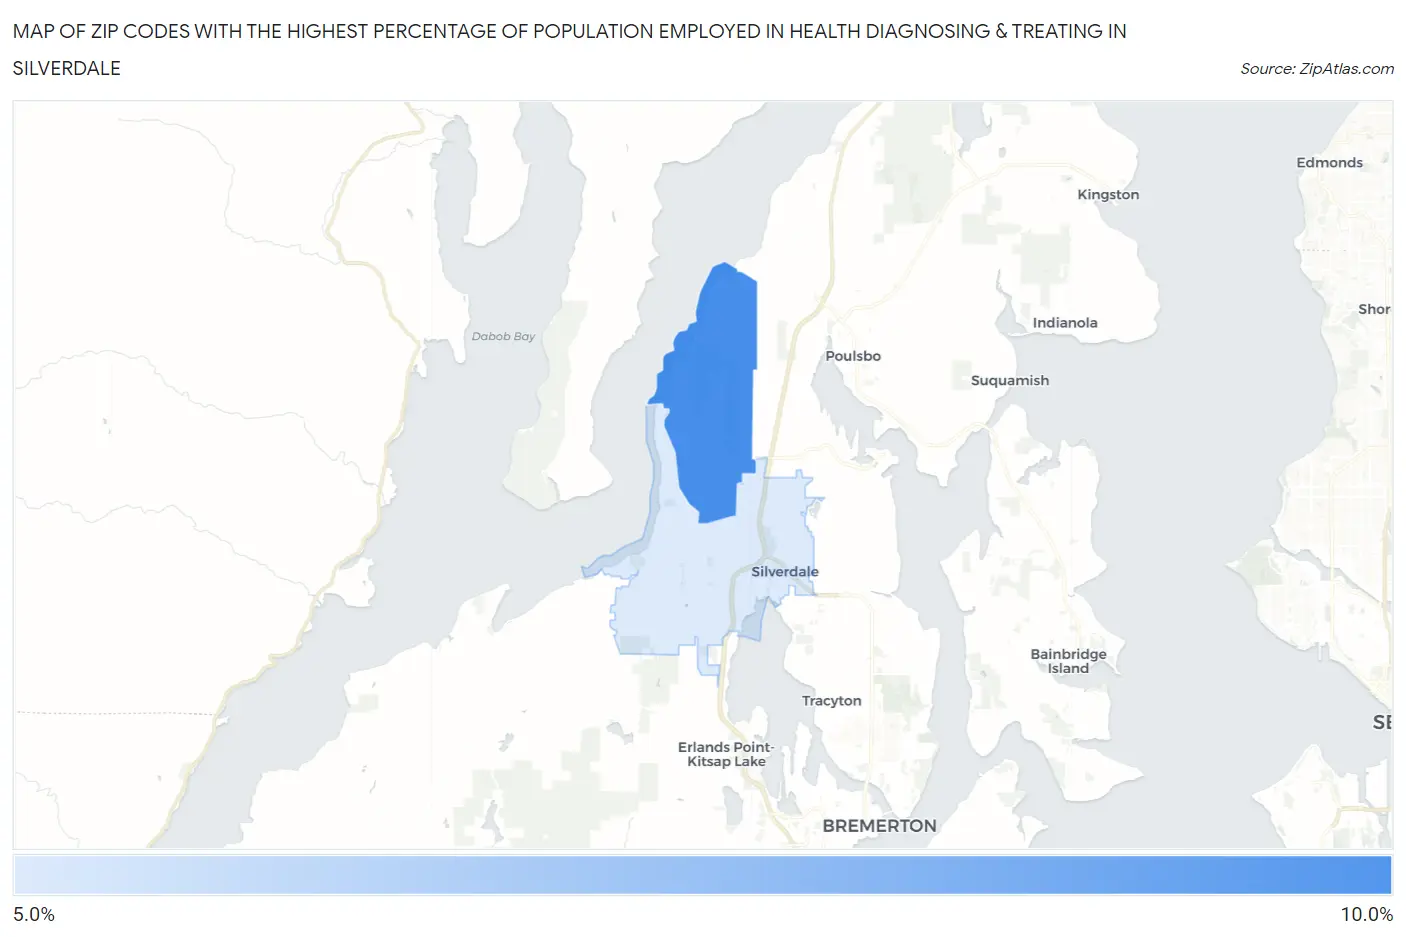
Map of Zip Codes with the Highest Percentage of Population Employed in Health Diagnosing & Treating in Silverdale
5.7%
8.3%
Zip Codes with the Highest Percentage of Population Employed in Health Diagnosing & Treating in Silverdale, WA
| Zip Code | % Employed | vs State | vs National | |
| 1. | 98315 | 8.3% | 5.6%(+2.76)#62 | 6.2%(+2.07)#6,732 |
| 2. | 98383 | 5.7% | 5.6%(+0.147)#200 | 6.2%(-0.544)#14,991 |
1
Common Questions
What are the Top Zip Codes with the Highest Percentage of Population Employed in Health Diagnosing & Treating in Silverdale, WA?
Top Zip Codes with the Highest Percentage of Population Employed in Health Diagnosing & Treating in Silverdale, WA are:
What zip code has the Highest Percentage of Population Employed in Health Diagnosing & Treating in Silverdale, WA?
98315 has the Highest Percentage of Population Employed in Health Diagnosing & Treating in Silverdale, WA with 8.3%.
What is the Percentage of Population Employed in Health Diagnosing & Treating in Silverdale, WA?
Percentage of Population Employed in Health Diagnosing & Treating in Silverdale is 5.7%.
What is the Percentage of Population Employed in Health Diagnosing & Treating in Washington?
Percentage of Population Employed in Health Diagnosing & Treating in Washington is 5.6%.
What is the Percentage of Population Employed in Health Diagnosing & Treating in the United States?
Percentage of Population Employed in Health Diagnosing & Treating in the United States is 6.2%.