Lyle, WA Map & Demographics
Lyle Map
Lyle Overview
$18,680
PER CAPITA INCOME
0.59
INEQUALITY / GINI INDEX
254
TOTAL POPULATION
115
MALE POPULATION
139
FEMALE POPULATION
82.73
MALES / 100 FEMALES
120.87
FEMALES / 100 MALES
61.7
MEDIAN AGE
1.9
AVG FAMILY SIZE
1.3
AVG HOUSEHOLD SIZE
89
LABOR FORCE [ PEOPLE ]
38.9%
PERCENT IN LABOR FORCE
Lyle Zip Codes
Lyle Area Codes
Income in Lyle
Income Overview in Lyle
| Characteristic | Number | Measure |
| Per Capita Income | 254 | $18,680 |
| Median Family Income | 51 | $0 |
| Mean Family Income | 51 | $0 |
| Median Household Income | 186 | $0 |
| Mean Household Income | 186 | $24,191 |
| Income Deficit | 51 | $0 |
| Wage / Income Gap (%) | 254 | 0.00% |
| Wage / Income Gap ($) | 254 | 100.00¢ per $1 |
| Gini / Inequality Index | 254 | 0.59 |
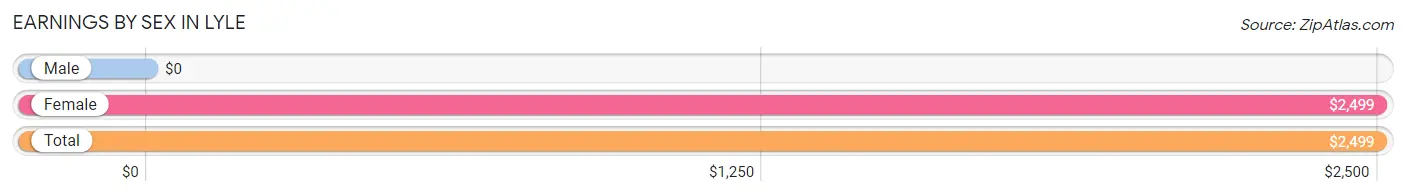
Earnings by Sex in Lyle
| Sex | Number | Average Earnings |
| Male | 7 (7.9%) | $0 |
| Female | 82 (92.1%) | $2,499 |
| Total | 89 (100.0%) | $2,499 |
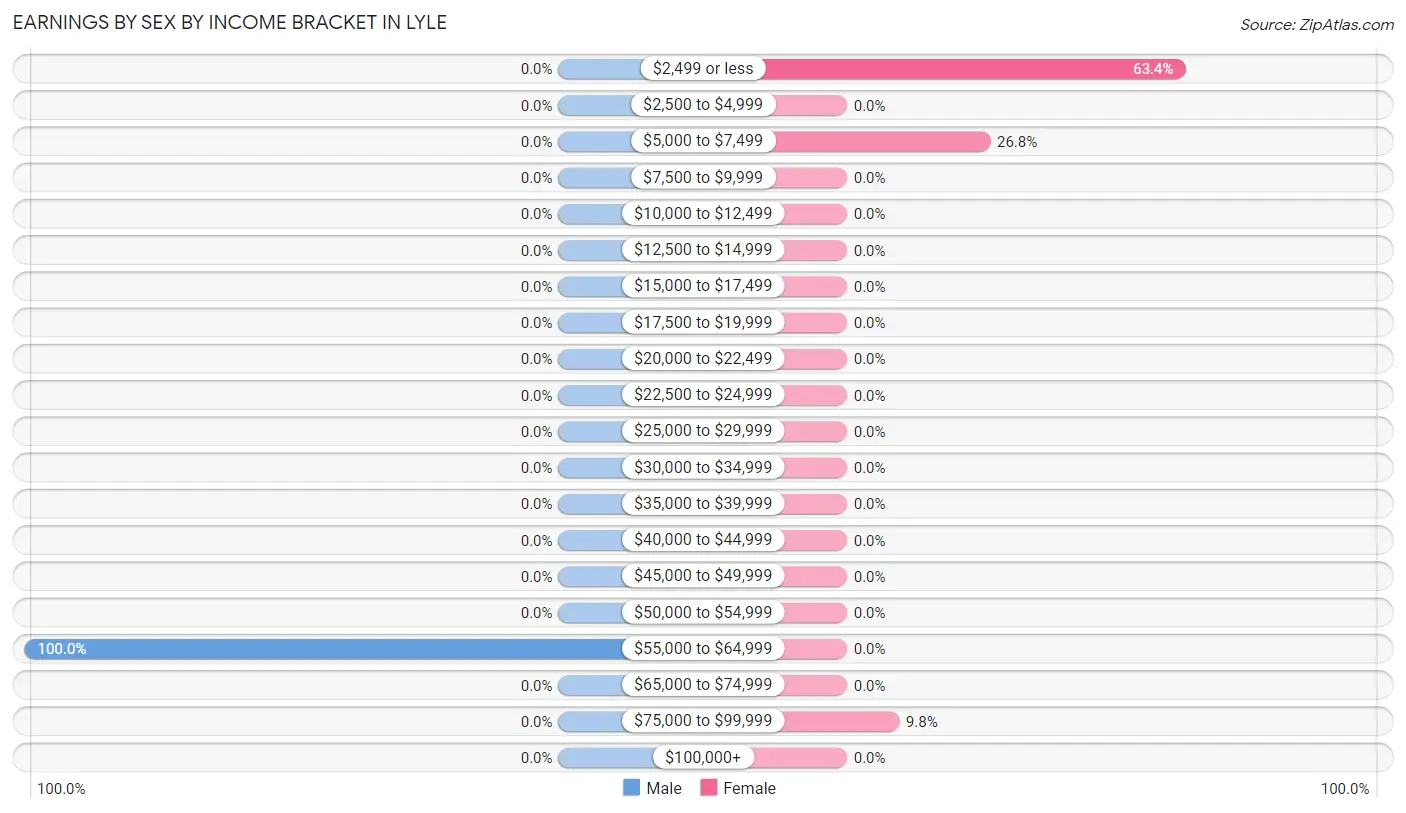
Earnings by Sex by Income Bracket in Lyle
The most common earnings brackets in Lyle are $55,000 to $64,999 for men (7 | 100.0%) and $2,499 or less for women (52 | 63.4%).
| Income | Male | Female |
| $2,499 or less | 0 (0.0%) | 52 (63.4%) |
| $2,500 to $4,999 | 0 (0.0%) | 0 (0.0%) |
| $5,000 to $7,499 | 0 (0.0%) | 22 (26.8%) |
| $7,500 to $9,999 | 0 (0.0%) | 0 (0.0%) |
| $10,000 to $12,499 | 0 (0.0%) | 0 (0.0%) |
| $12,500 to $14,999 | 0 (0.0%) | 0 (0.0%) |
| $15,000 to $17,499 | 0 (0.0%) | 0 (0.0%) |
| $17,500 to $19,999 | 0 (0.0%) | 0 (0.0%) |
| $20,000 to $22,499 | 0 (0.0%) | 0 (0.0%) |
| $22,500 to $24,999 | 0 (0.0%) | 0 (0.0%) |
| $25,000 to $29,999 | 0 (0.0%) | 0 (0.0%) |
| $30,000 to $34,999 | 0 (0.0%) | 0 (0.0%) |
| $35,000 to $39,999 | 0 (0.0%) | 0 (0.0%) |
| $40,000 to $44,999 | 0 (0.0%) | 0 (0.0%) |
| $45,000 to $49,999 | 0 (0.0%) | 0 (0.0%) |
| $50,000 to $54,999 | 0 (0.0%) | 0 (0.0%) |
| $55,000 to $64,999 | 7 (100.0%) | 0 (0.0%) |
| $65,000 to $74,999 | 0 (0.0%) | 0 (0.0%) |
| $75,000 to $99,999 | 0 (0.0%) | 8 (9.8%) |
| $100,000+ | 0 (0.0%) | 0 (0.0%) |
| Total | 7 (100.0%) | 82 (100.0%) |
Earnings by Sex by Educational Attainment in Lyle
| Educational Attainment | Male Income | Female Income |
| Less than High School | - | - |
| High School Diploma | - | - |
| College or Associate's Degree | - | - |
| Bachelor's Degree | - | - |
| Graduate Degree | - | - |
| Total | - | - |
Family Income in Lyle
Family Income Brackets in Lyle
According to the Lyle family income data, there are 26 families falling into the less than $10,000 income range, which is the most common income bracket and makes up 51.0% of all families.
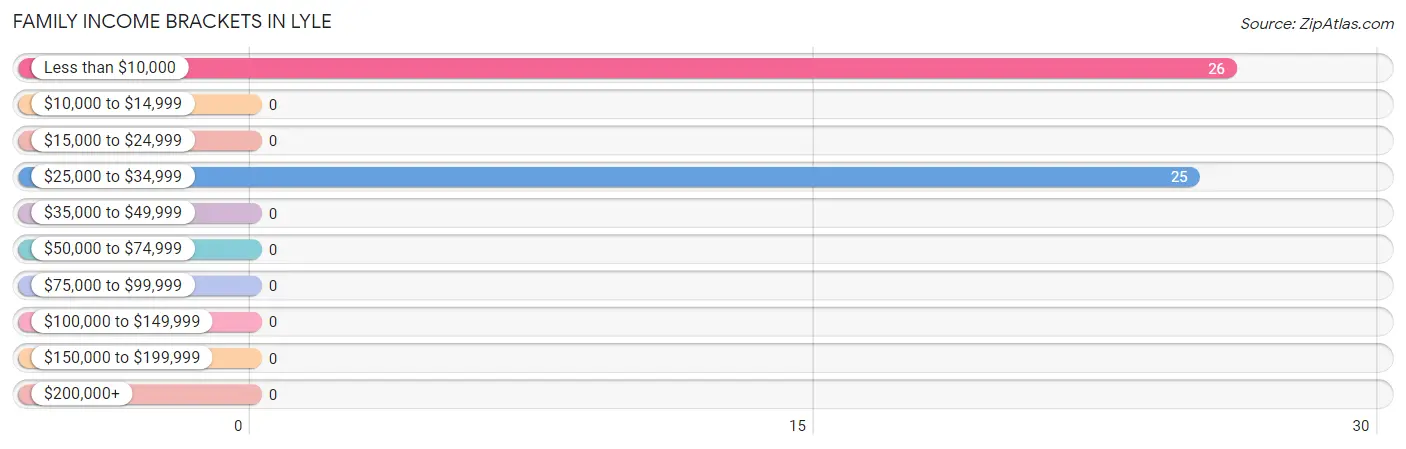
| Income Bracket | # Families | % Families |
| Less than $10,000 | 26 | 51.0% |
| $10,000 to $14,999 | 0 | 0.0% |
| $15,000 to $24,999 | 0 | 0.0% |
| $25,000 to $34,999 | 25 | 49.0% |
| $35,000 to $49,999 | 0 | 0.0% |
| $50,000 to $74,999 | 0 | 0.0% |
| $75,000 to $99,999 | 0 | 0.0% |
| $100,000 to $149,999 | 0 | 0.0% |
| $150,000 to $199,999 | 0 | 0.0% |
| $200,000+ | 0 | 0.0% |
Family Income by Famaliy Size in Lyle
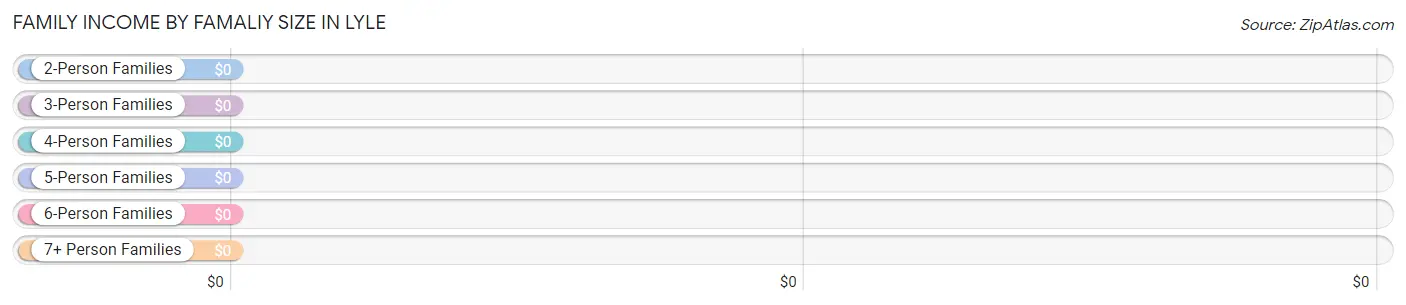
| Income Bracket | # Families | Median Income |
| 2-Person Families | 51 (100.0%) | $0 |
| 3-Person Families | 0 (0.0%) | $0 |
| 4-Person Families | 0 (0.0%) | $0 |
| 5-Person Families | 0 (0.0%) | $0 |
| 6-Person Families | 0 (0.0%) | $0 |
| 7+ Person Families | 0 (0.0%) | $0 |
| Total | 51 (100.0%) | $0 |
Family Income by Number of Earners in Lyle
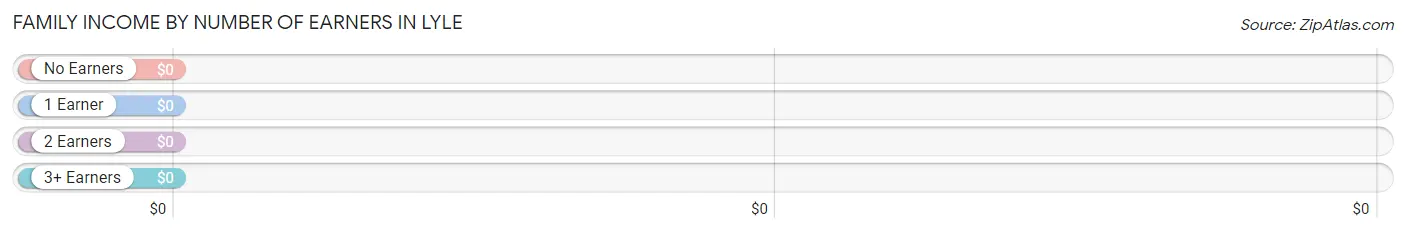
| Number of Earners | # Families | Median Income |
| No Earners | 0 (0.0%) | $0 |
| 1 Earner | 51 (100.0%) | $0 |
| 2 Earners | 0 (0.0%) | $0 |
| 3+ Earners | 0 (0.0%) | $0 |
| Total | 51 (100.0%) | $0 |
Household Income in Lyle
Household Income Brackets in Lyle
With 84 households falling in the category, the less than $10,000 income range is the most frequent in Lyle, accounting for 45.2% of all households.
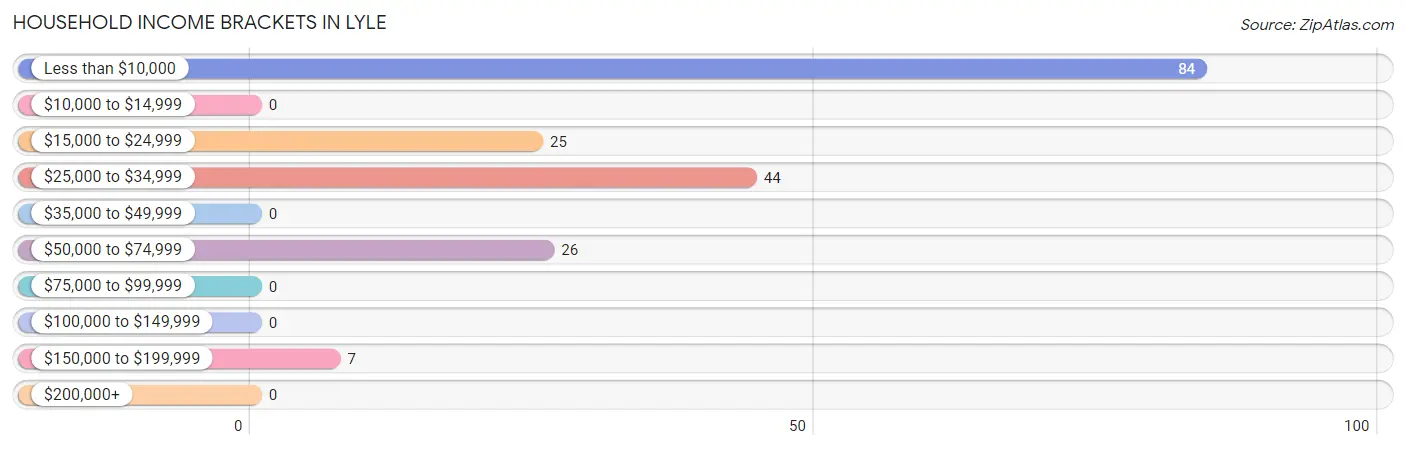
| Income Bracket | # Households | % Households |
| Less than $10,000 | 84 | 45.2% |
| $10,000 to $14,999 | 0 | 0.0% |
| $15,000 to $24,999 | 25 | 13.4% |
| $25,000 to $34,999 | 44 | 23.7% |
| $35,000 to $49,999 | 0 | 0.0% |
| $50,000 to $74,999 | 26 | 14.0% |
| $75,000 to $99,999 | 0 | 0.0% |
| $100,000 to $149,999 | 0 | 0.0% |
| $150,000 to $199,999 | 7 | 3.8% |
| $200,000+ | 0 | 0.0% |
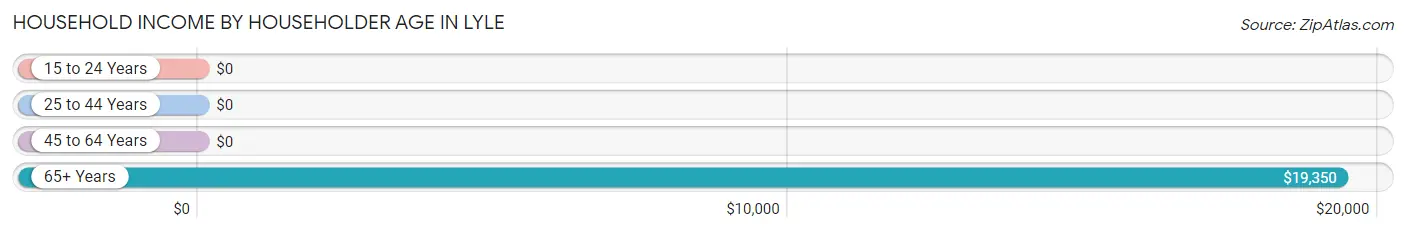
Household Income by Householder Age in Lyle
The median household income in Lyle is $0, with the highest median household income of $19,350 found in the 65+ years age bracket for the primary householder. A total of 101 households (54.3%) fall into this category. Meanwhile, the 15 to 24 years age bracket for the primary householder has the lowest median household income of $0, with 26 households (14.0%) in this group.
| Income Bracket | # Households | Median Income |
| 15 to 24 Years | 26 (14.0%) | $0 |
| 25 to 44 Years | 33 (17.7%) | $0 |
| 45 to 64 Years | 26 (14.0%) | $0 |
| 65+ Years | 101 (54.3%) | $19,350 |
| Total | 186 (100.0%) | $0 |
Poverty in Lyle
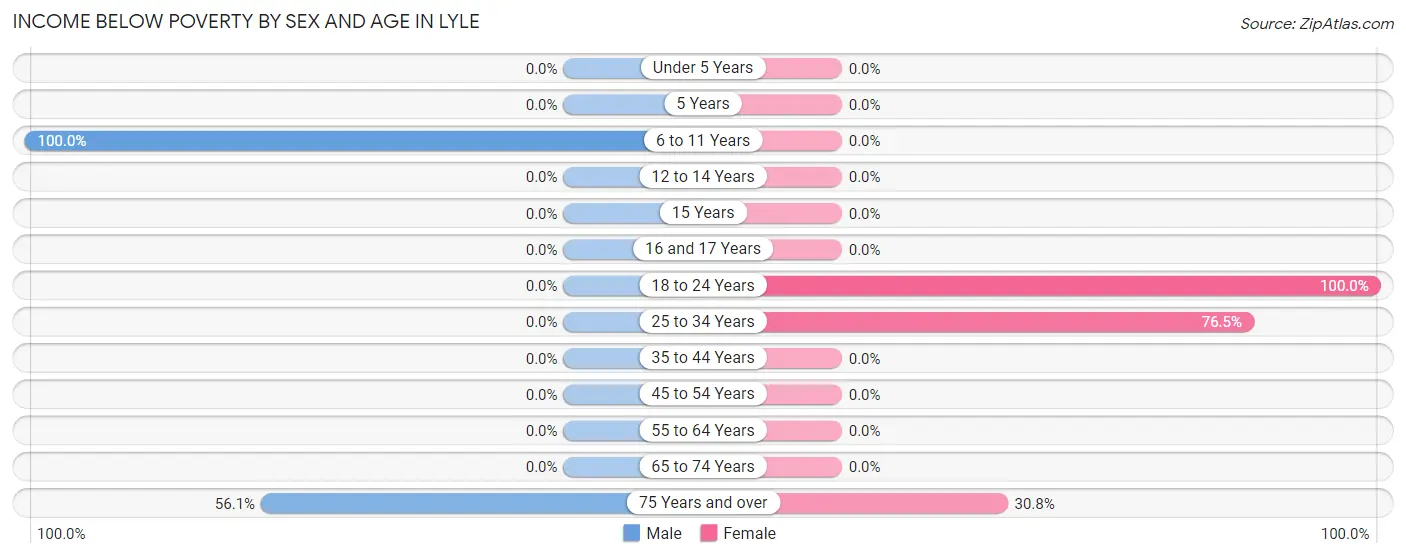
Income Below Poverty by Sex and Age in Lyle
With 49.6% poverty level for males and 40.3% for females among the residents of Lyle, 6 to 11 year old males and 18 to 24 year old females are the most vulnerable to poverty, with 25 males (100.0%) and 26 females (100.0%) in their respective age groups living below the poverty level.
| Age Bracket | Male | Female |
| Under 5 Years | 0 (0.0%) | 0 (0.0%) |
| 5 Years | 0 (0.0%) | 0 (0.0%) |
| 6 to 11 Years | 25 (100.0%) | 0 (0.0%) |
| 12 to 14 Years | 0 (0.0%) | 0 (0.0%) |
| 15 Years | 0 (0.0%) | 0 (0.0%) |
| 16 and 17 Years | 0 (0.0%) | 0 (0.0%) |
| 18 to 24 Years | 0 (0.0%) | 26 (100.0%) |
| 25 to 34 Years | 0 (0.0%) | 26 (76.5%) |
| 35 to 44 Years | 0 (0.0%) | 0 (0.0%) |
| 45 to 54 Years | 0 (0.0%) | 0 (0.0%) |
| 55 to 64 Years | 0 (0.0%) | 0 (0.0%) |
| 65 to 74 Years | 0 (0.0%) | 0 (0.0%) |
| 75 Years and over | 32 (56.1%) | 4 (30.8%) |
| Total | 57 (49.6%) | 56 (40.3%) |
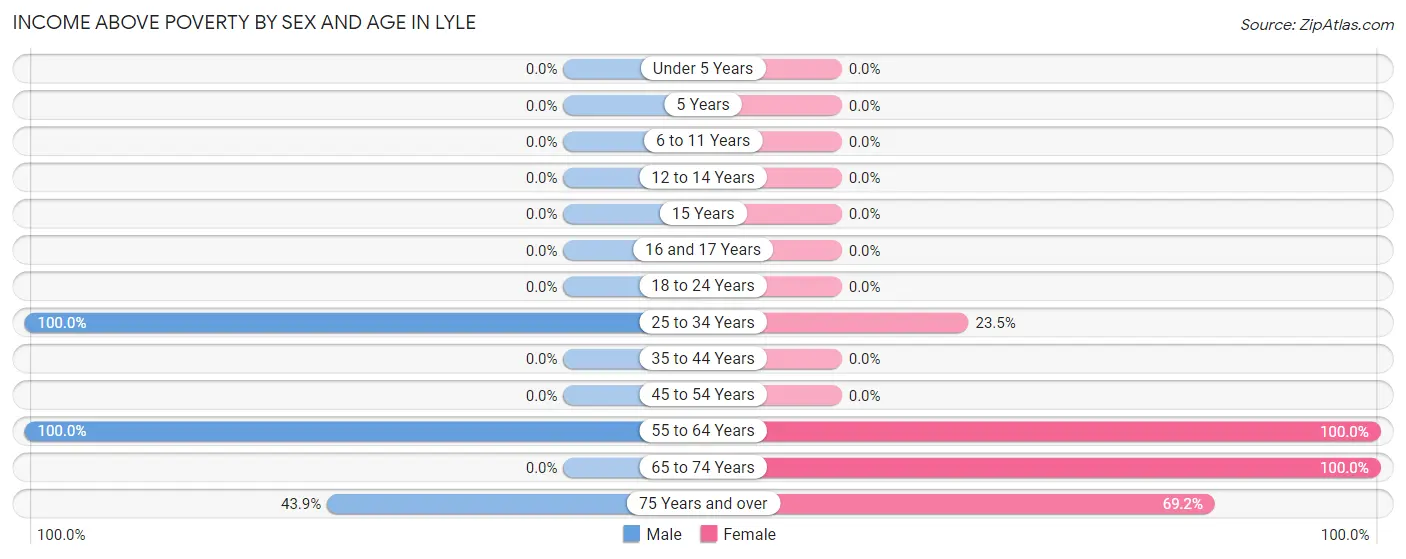
Income Above Poverty by Sex and Age in Lyle
According to the poverty statistics in Lyle, males aged 25 to 34 years and females aged 55 to 64 years are the age groups that are most secure financially, with 100.0% of males and 100.0% of females in these age groups living above the poverty line.
| Age Bracket | Male | Female |
| Under 5 Years | 0 (0.0%) | 0 (0.0%) |
| 5 Years | 0 (0.0%) | 0 (0.0%) |
| 6 to 11 Years | 0 (0.0%) | 0 (0.0%) |
| 12 to 14 Years | 0 (0.0%) | 0 (0.0%) |
| 15 Years | 0 (0.0%) | 0 (0.0%) |
| 16 and 17 Years | 0 (0.0%) | 0 (0.0%) |
| 18 to 24 Years | 0 (0.0%) | 0 (0.0%) |
| 25 to 34 Years | 7 (100.0%) | 8 (23.5%) |
| 35 to 44 Years | 0 (0.0%) | 0 (0.0%) |
| 45 to 54 Years | 0 (0.0%) | 0 (0.0%) |
| 55 to 64 Years | 26 (100.0%) | 22 (100.0%) |
| 65 to 74 Years | 0 (0.0%) | 44 (100.0%) |
| 75 Years and over | 25 (43.9%) | 9 (69.2%) |
| Total | 58 (50.4%) | 83 (59.7%) |
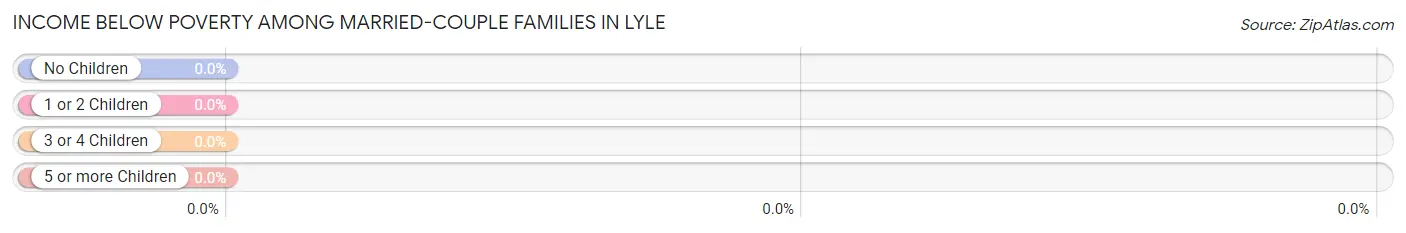
Income Below Poverty Among Married-Couple Families in Lyle
| Children | Above Poverty | Below Poverty |
| No Children | 25 (100.0%) | 0 (0.0%) |
| 1 or 2 Children | 0 (0.0%) | 0 (0.0%) |
| 3 or 4 Children | 0 (0.0%) | 0 (0.0%) |
| 5 or more Children | 0 (0.0%) | 0 (0.0%) |
| Total | 25 (100.0%) | 0 (0.0%) |
Income Below Poverty Among Single-Parent Households in Lyle
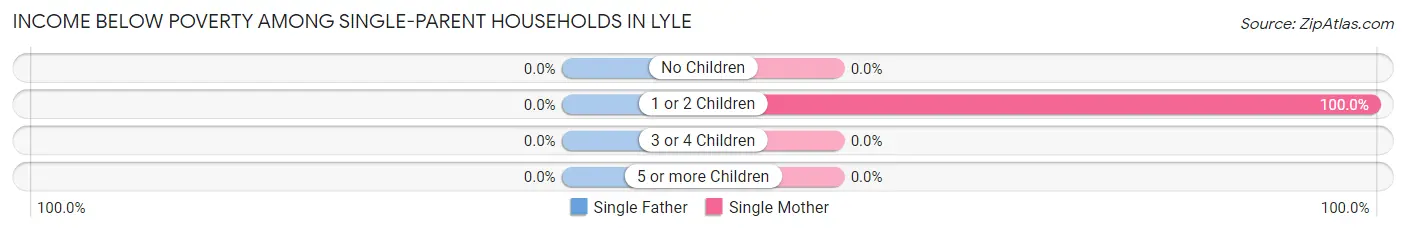
| Children | Single Father | Single Mother |
| No Children | 0 (0.0%) | 0 (0.0%) |
| 1 or 2 Children | 0 (0.0%) | 26 (100.0%) |
| 3 or 4 Children | 0 (0.0%) | 0 (0.0%) |
| 5 or more Children | 0 (0.0%) | 0 (0.0%) |
| Total | 0 (0.0%) | 26 (100.0%) |
Income Below Poverty Among Married-Couple vs Single-Parent Households in Lyle
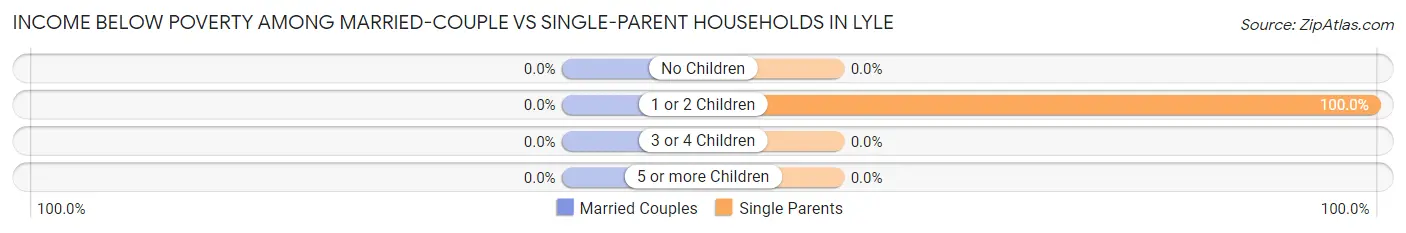
| Children | Married-Couple Families | Single-Parent Households |
| No Children | 0 (0.0%) | 0 (0.0%) |
| 1 or 2 Children | 0 (0.0%) | 26 (100.0%) |
| 3 or 4 Children | 0 (0.0%) | 0 (0.0%) |
| 5 or more Children | 0 (0.0%) | 0 (0.0%) |
| Total | 0 (0.0%) | 26 (100.0%) |
Race in Lyle
The most populous races in Lyle are , and White / Caucasian (254 | 100.0%).
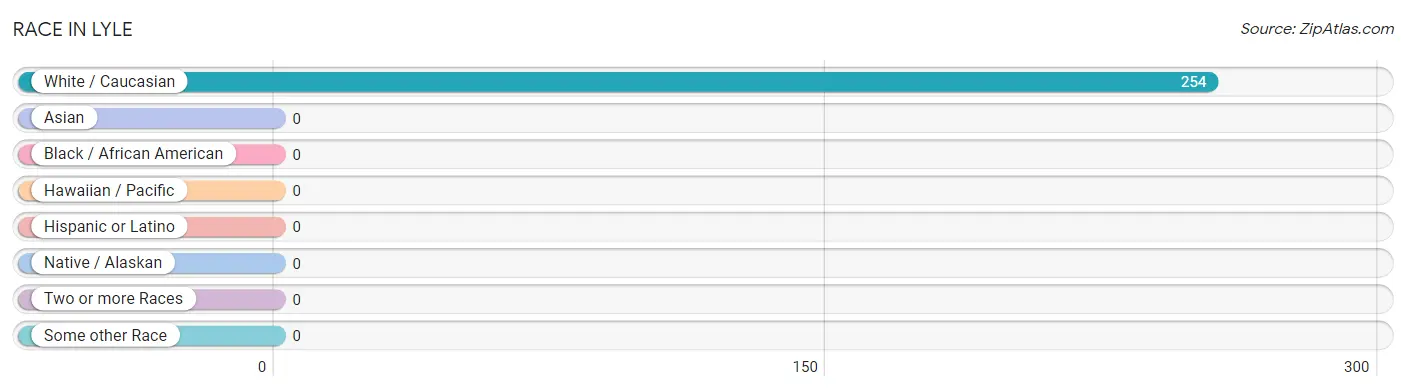
| Race | # Population | % Population |
| Asian | 0 | 0.0% |
| Black / African American | 0 | 0.0% |
| Hawaiian / Pacific | 0 | 0.0% |
| Hispanic or Latino | 0 | 0.0% |
| Native / Alaskan | 0 | 0.0% |
| White / Caucasian | 254 | 100.0% |
| Two or more Races | 0 | 0.0% |
| Some other Race | 0 | 0.0% |
| Total | 254 | 100.0% |
Ancestry in Lyle
The most populous ancestries reported in Lyle are Irish (51 | 20.1%), Danish (32 | 12.6%), German (30 | 11.8%), Swedish (26 | 10.2%), and Dutch (19 | 7.5%), together accounting for 62.2% of all Lyle residents.
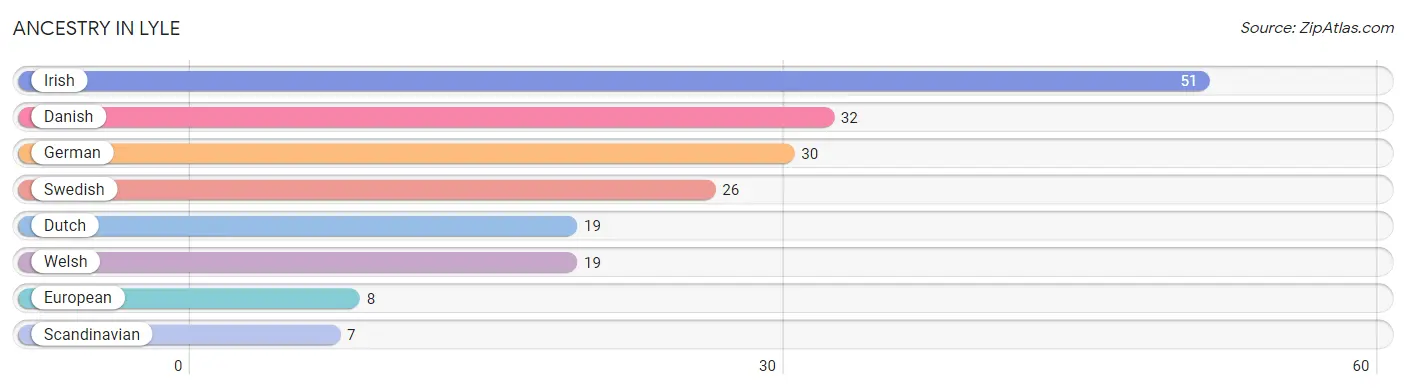
| Ancestry | # Population | % Population |
| Danish | 32 | 12.6% |
| Dutch | 19 | 7.5% |
| European | 8 | 3.2% |
| German | 30 | 11.8% |
| Irish | 51 | 20.1% |
| Scandinavian | 7 | 2.8% |
| Swedish | 26 | 10.2% |
| Welsh | 19 | 7.5% | View All 8 Rows |
Immigrants in Lyle
The most numerous immigrant groups reported in Lyle came from Europe (9 | 3.5%), Italy (9 | 3.5%), and Southern Europe (9 | 3.5%), together accounting for 10.6% of all Lyle residents.
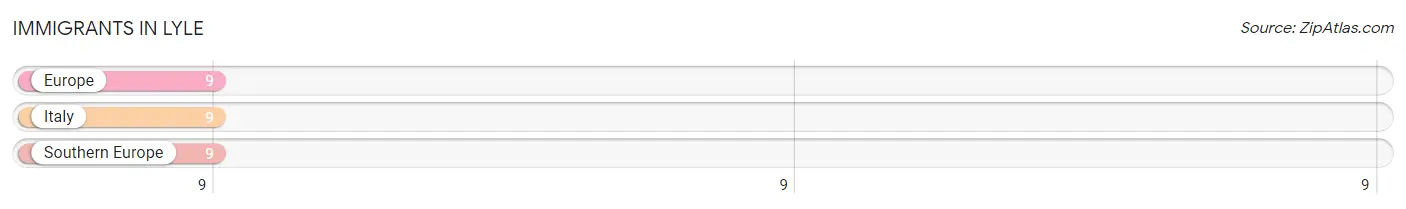
| Immigration Origin | # Population | % Population |
| Europe | 9 | 3.5% |
| Italy | 9 | 3.5% |
| Southern Europe | 9 | 3.5% | View All 3 Rows |
Sex and Age in Lyle
Sex and Age in Lyle
The most populous age groups in Lyle are 75 to 79 Years (32 | 27.8%) for men and 20 to 24 Years (26 | 18.7%) for women.
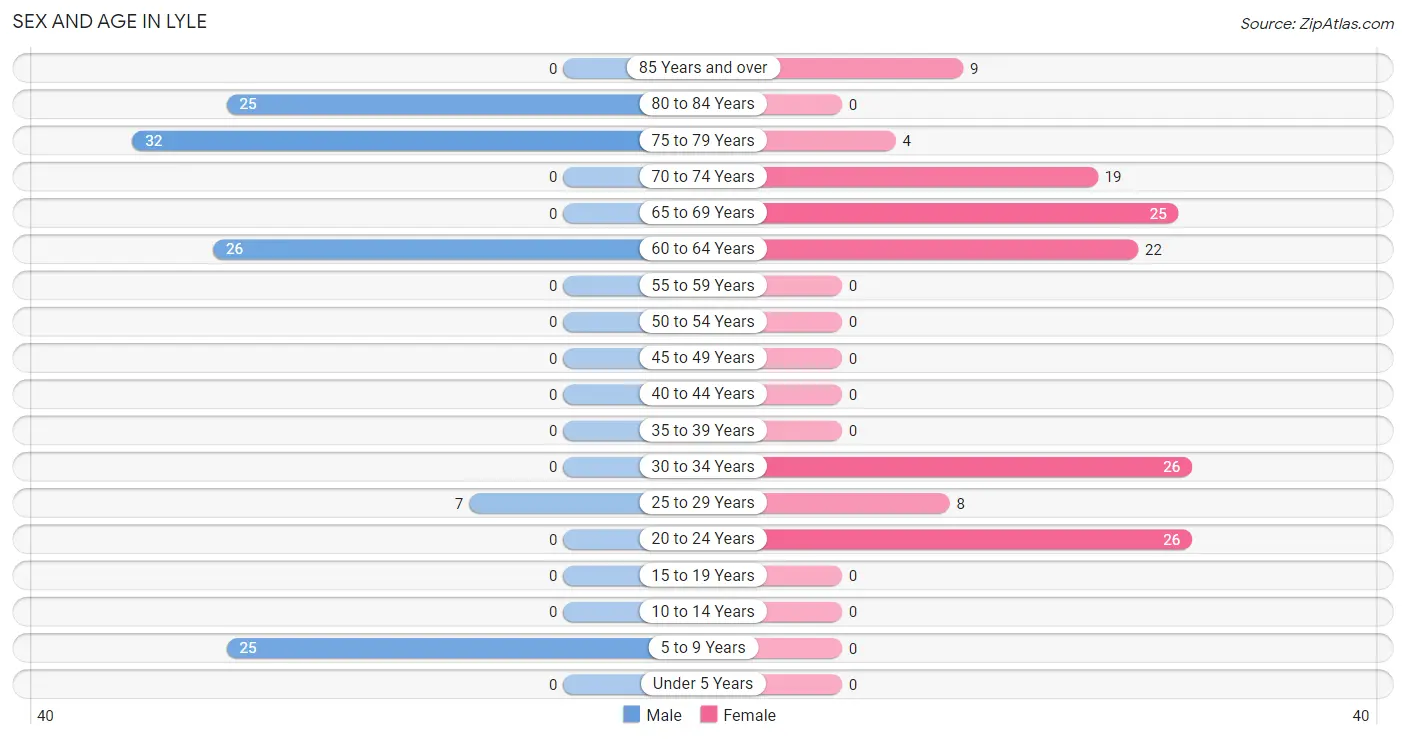
| Age Bracket | Male | Female |
| Under 5 Years | 0 (0.0%) | 0 (0.0%) |
| 5 to 9 Years | 25 (21.7%) | 0 (0.0%) |
| 10 to 14 Years | 0 (0.0%) | 0 (0.0%) |
| 15 to 19 Years | 0 (0.0%) | 0 (0.0%) |
| 20 to 24 Years | 0 (0.0%) | 26 (18.7%) |
| 25 to 29 Years | 7 (6.1%) | 8 (5.8%) |
| 30 to 34 Years | 0 (0.0%) | 26 (18.7%) |
| 35 to 39 Years | 0 (0.0%) | 0 (0.0%) |
| 40 to 44 Years | 0 (0.0%) | 0 (0.0%) |
| 45 to 49 Years | 0 (0.0%) | 0 (0.0%) |
| 50 to 54 Years | 0 (0.0%) | 0 (0.0%) |
| 55 to 59 Years | 0 (0.0%) | 0 (0.0%) |
| 60 to 64 Years | 26 (22.6%) | 22 (15.8%) |
| 65 to 69 Years | 0 (0.0%) | 25 (18.0%) |
| 70 to 74 Years | 0 (0.0%) | 19 (13.7%) |
| 75 to 79 Years | 32 (27.8%) | 4 (2.9%) |
| 80 to 84 Years | 25 (21.7%) | 0 (0.0%) |
| 85 Years and over | 0 (0.0%) | 9 (6.5%) |
| Total | 115 (100.0%) | 139 (100.0%) |
Families and Households in Lyle
Median Family Size in Lyle
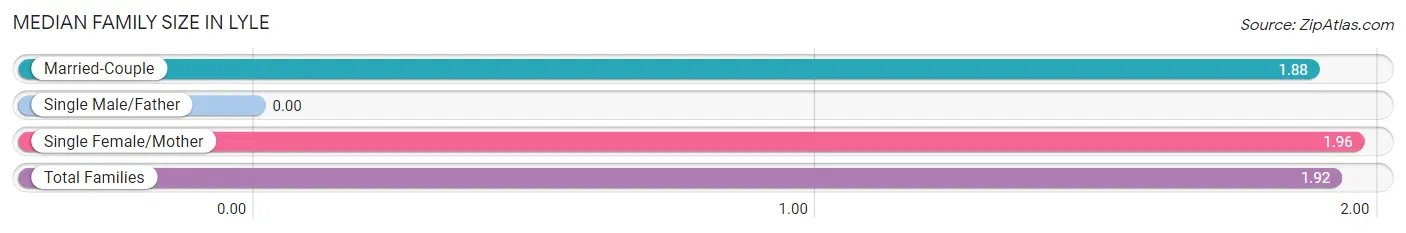
| Family Type | # Families | Family Size |
| Married-Couple | 25 (49.0%) | 1.88 |
| Single Male/Father | 0 (0.0%) | - |
| Single Female/Mother | 26 (51.0%) | 1.96 |
| Total Families | 51 (100.0%) | 1.92 |
Median Household Size in Lyle
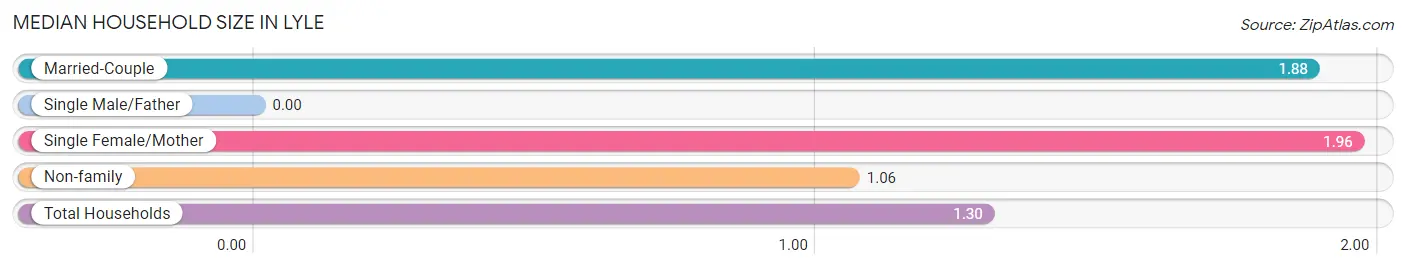
| Household Type | # Households | Household Size |
| Married-Couple | 25 (13.4%) | 1.88 |
| Single Male/Father | 0 (0.0%) | - |
| Single Female/Mother | 26 (14.0%) | 1.96 |
| Non-family | 135 (72.6%) | 1.06 |
| Total Households | 186 (100.0%) | 1.30 |
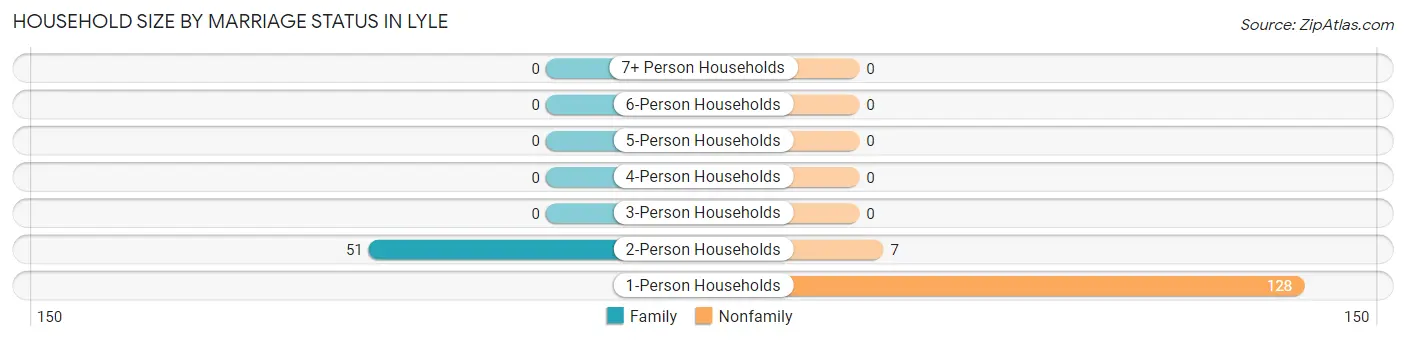
Household Size by Marriage Status in Lyle
Out of a total of 186 households in Lyle, 51 (27.4%) are family households, while 135 (72.6%) are nonfamily households. The most numerous type of family households are 2-person households, comprising 51, and the most common type of nonfamily households are 1-person households, comprising 128.
| Household Size | Family Households | Nonfamily Households |
| 1-Person Households | - | 128 (68.8%) |
| 2-Person Households | 51 (27.4%) | 7 (3.8%) |
| 3-Person Households | 0 (0.0%) | 0 (0.0%) |
| 4-Person Households | 0 (0.0%) | 0 (0.0%) |
| 5-Person Households | 0 (0.0%) | 0 (0.0%) |
| 6-Person Households | 0 (0.0%) | 0 (0.0%) |
| 7+ Person Households | 0 (0.0%) | 0 (0.0%) |
| Total | 51 (27.4%) | 135 (72.6%) |
Female Fertility in Lyle
Fertility by Age in Lyle
| Age Bracket | Women with Births | Births / 1,000 Women |
| 15 to 19 years | 0 (0.0%) | 0.0 |
| 20 to 34 years | 0 (0.0%) | 0.0 |
| 35 to 50 years | 0 (0.0%) | 0.0 |
| Total | 0 (0.0%) | 0.0 |
Fertility by Age by Marriage Status in Lyle
| Age Bracket | Married | Unmarried |
| 15 to 19 years | 0 (0.0%) | 0 (0.0%) |
| 20 to 34 years | 0 (0.0%) | 0 (0.0%) |
| 35 to 50 years | 0 (0.0%) | 0 (0.0%) |
| Total | 0 (0.0%) | 0 (0.0%) |
Fertility by Education in Lyle
| Educational Attainment | Women with Births | Births / 1,000 Women |
| Less than High School | 0 (0.0%) | 0.0 |
| High School Diploma | 0 (0.0%) | 0.0 |
| College or Associate's Degree | 0 (0.0%) | 0.0 |
| Bachelor's Degree | 0 (0.0%) | 0.0 |
| Graduate Degree | 0 (0.0%) | 0.0 |
| Total | 0 (0.0%) | 0.0 |
Fertility by Education by Marriage Status in Lyle
| Educational Attainment | Married | Unmarried |
| Less than High School | 0 (0.0%) | 0 (0.0%) |
| High School Diploma | 0 (0.0%) | 0 (0.0%) |
| College or Associate's Degree | 0 (0.0%) | 0 (0.0%) |
| Bachelor's Degree | 0 (0.0%) | 0 (0.0%) |
| Graduate Degree | 0 (0.0%) | 0 (0.0%) |
| Total | 0 (0.0%) | 0 (0.0%) |
Employment Characteristics in Lyle
Employment by Class of Employer in Lyle
Among the 89 employed individuals in Lyle, private company employees (41 | 46.1%), self-employed (not incorporated) (26 | 29.2%), and self-employed (incorporated) (22 | 24.7%) make up the most common classes of employment.
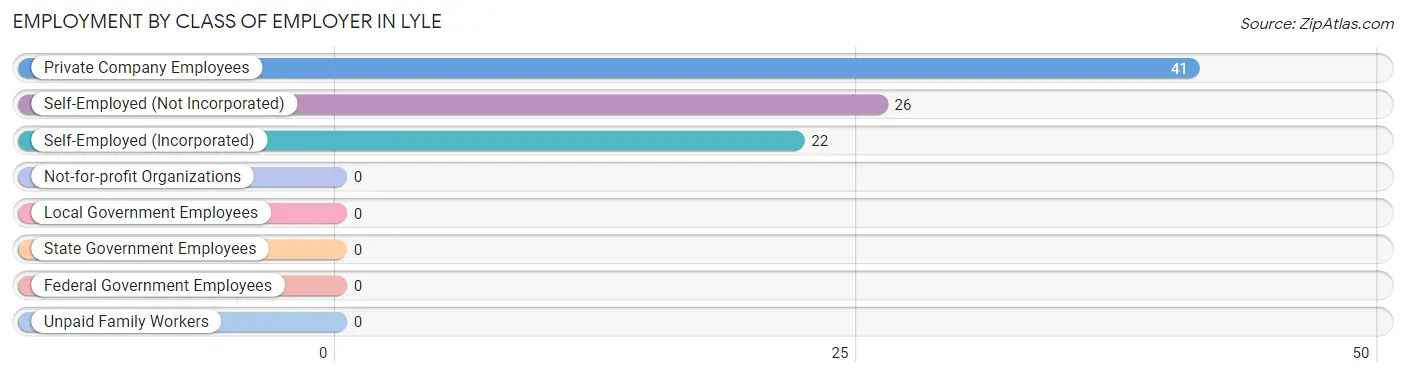
| Employer Class | # Employees | % Employees |
| Private Company Employees | 41 | 46.1% |
| Self-Employed (Incorporated) | 22 | 24.7% |
| Self-Employed (Not Incorporated) | 26 | 29.2% |
| Not-for-profit Organizations | 0 | 0.0% |
| Local Government Employees | 0 | 0.0% |
| State Government Employees | 0 | 0.0% |
| Federal Government Employees | 0 | 0.0% |
| Unpaid Family Workers | 0 | 0.0% |
| Total | 89 | 100.0% |
Employment Status by Age in Lyle
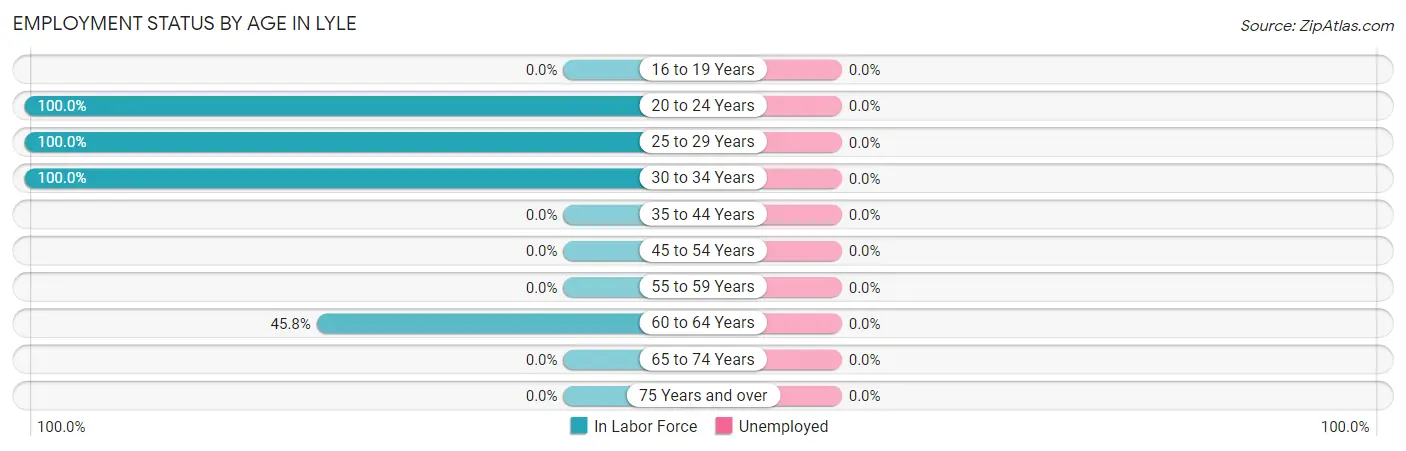
| Age Bracket | In Labor Force | Unemployed |
| 16 to 19 Years | 0 (0.0%) | 0 (0.0%) |
| 20 to 24 Years | 26 (100.0%) | 0 (0.0%) |
| 25 to 29 Years | 15 (100.0%) | 0 (0.0%) |
| 30 to 34 Years | 26 (100.0%) | 0 (0.0%) |
| 35 to 44 Years | 0 (0.0%) | 0 (0.0%) |
| 45 to 54 Years | 0 (0.0%) | 0 (0.0%) |
| 55 to 59 Years | 0 (0.0%) | 0 (0.0%) |
| 60 to 64 Years | 22 (45.8%) | 0 (0.0%) |
| 65 to 74 Years | 0 (0.0%) | 0 (0.0%) |
| 75 Years and over | 0 (0.0%) | 0 (0.0%) |
| Total | 89 (38.9%) | 0 (0.0%) |
Employment Status by Educational Attainment in Lyle
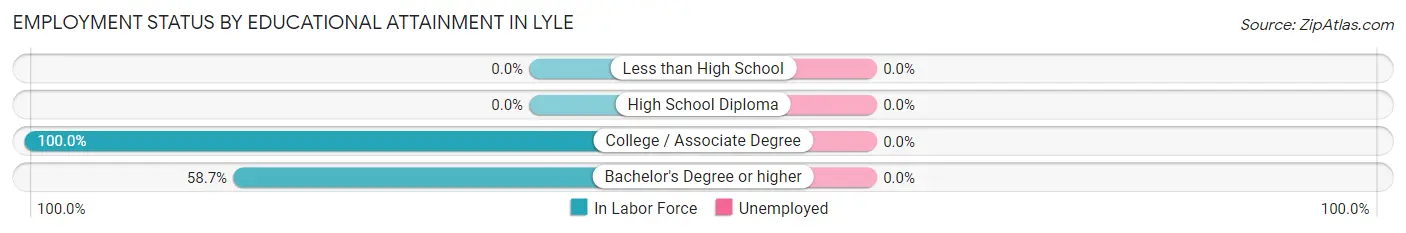
| Educational Attainment | In Labor Force | Unemployed |
| Less than High School | 0 (0.0%) | 0 (0.0%) |
| High School Diploma | 0 (0.0%) | 0 (0.0%) |
| College / Associate Degree | 26 (100.0%) | 0 (0.0%) |
| Bachelor's Degree or higher | 37 (58.7%) | 0 (0.0%) |
| Total | 63 (70.8%) | 0 (0.0%) |
Employment Occupations by Sex in Lyle
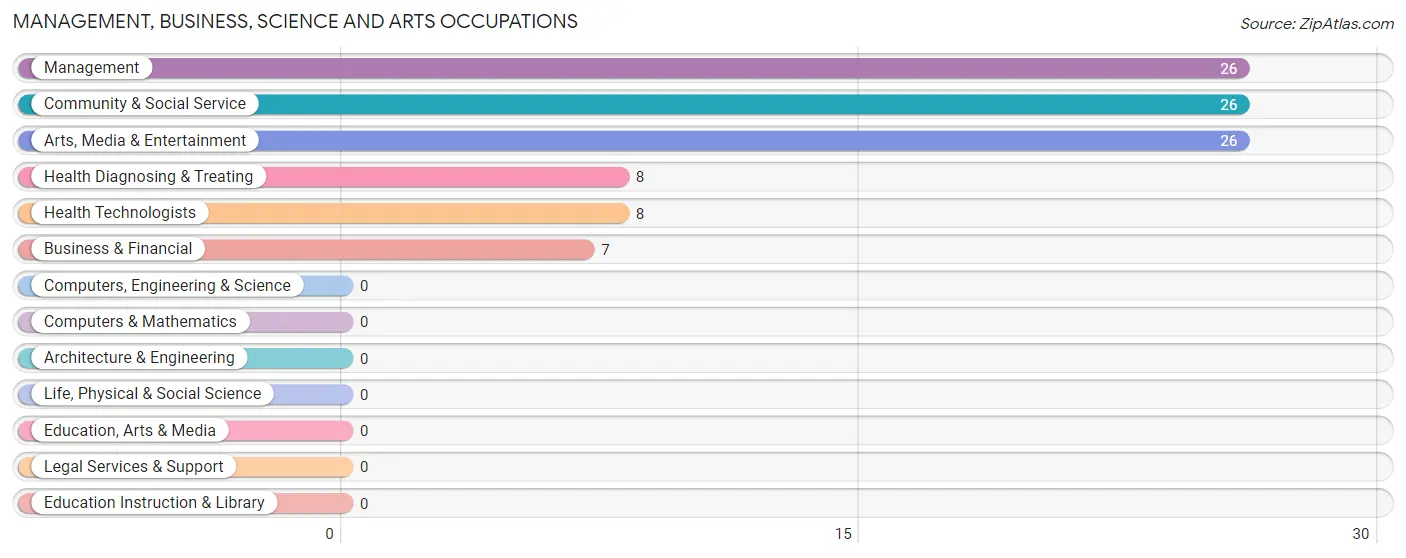
Management, Business, Science and Arts Occupations
The most common Management, Business, Science and Arts occupations in Lyle are Management (26 | 29.2%), Community & Social Service (26 | 29.2%), Arts, Media & Entertainment (26 | 29.2%), Health Diagnosing & Treating (8 | 9.0%), and Health Technologists (8 | 9.0%).
Management, Business, Science and Arts Occupations by Sex
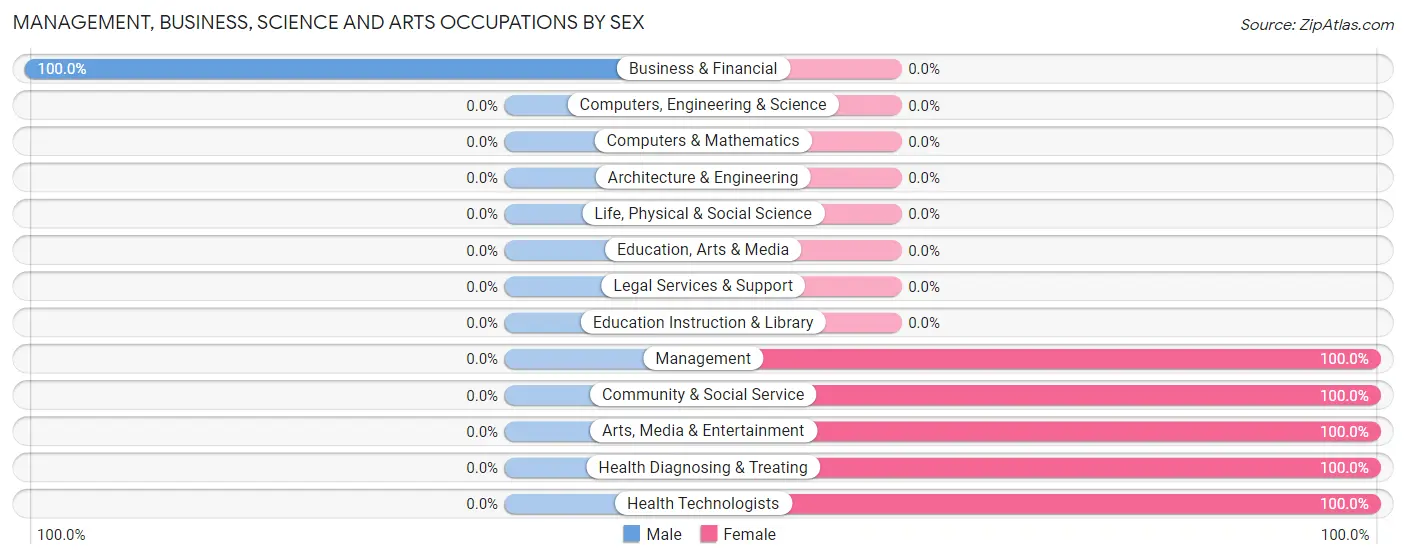
| Occupation | Male | Female |
| Management | 0 (0.0%) | 26 (100.0%) |
| Business & Financial | 7 (100.0%) | 0 (0.0%) |
| Computers, Engineering & Science | 0 (0.0%) | 0 (0.0%) |
| Computers & Mathematics | 0 (0.0%) | 0 (0.0%) |
| Architecture & Engineering | 0 (0.0%) | 0 (0.0%) |
| Life, Physical & Social Science | 0 (0.0%) | 0 (0.0%) |
| Community & Social Service | 0 (0.0%) | 26 (100.0%) |
| Education, Arts & Media | 0 (0.0%) | 0 (0.0%) |
| Legal Services & Support | 0 (0.0%) | 0 (0.0%) |
| Education Instruction & Library | 0 (0.0%) | 0 (0.0%) |
| Arts, Media & Entertainment | 0 (0.0%) | 26 (100.0%) |
| Health Diagnosing & Treating | 0 (0.0%) | 8 (100.0%) |
| Health Technologists | 0 (0.0%) | 8 (100.0%) |
| Total (Category) | 7 (10.4%) | 60 (89.5%) |
| Total (Overall) | 7 (7.9%) | 82 (92.1%) |
Services Occupations
Services Occupations by Sex
| Occupation | Male | Female |
| Healthcare Support | 0 (0.0%) | 0 (0.0%) |
| Security & Protection | 0 (0.0%) | 0 (0.0%) |
| Firefighting & Prevention | 0 (0.0%) | 0 (0.0%) |
| Law Enforcement | 0 (0.0%) | 0 (0.0%) |
| Food Preparation & Serving | 0 (0.0%) | 0 (0.0%) |
| Cleaning & Maintenance | 0 (0.0%) | 0 (0.0%) |
| Personal Care & Service | 0 (0.0%) | 0 (0.0%) |
| Total (Category) | 0 (0.0%) | 0 (0.0%) |
| Total (Overall) | 7 (7.9%) | 82 (92.1%) |
Sales and Office Occupations
Sales and Office Occupations by Sex
| Occupation | Male | Female |
| Sales & Related | 0 (0.0%) | 0 (0.0%) |
| Office & Administration | 0 (0.0%) | 0 (0.0%) |
| Total (Category) | 0 (0.0%) | 0 (0.0%) |
| Total (Overall) | 7 (7.9%) | 82 (92.1%) |
Natural Resources, Construction and Maintenance Occupations
Natural Resources, Construction and Maintenance Occupations by Sex
| Occupation | Male | Female |
| Farming, Fishing & Forestry | 0 (0.0%) | 0 (0.0%) |
| Construction & Extraction | 0 (0.0%) | 0 (0.0%) |
| Installation, Maintenance & Repair | 0 (0.0%) | 0 (0.0%) |
| Total (Category) | 0 (0.0%) | 0 (0.0%) |
| Total (Overall) | 7 (7.9%) | 82 (92.1%) |
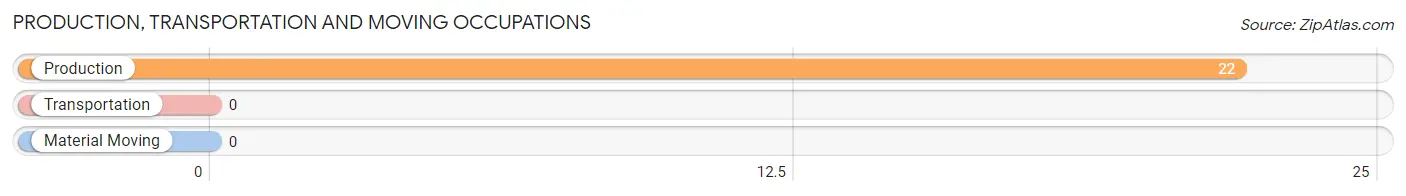
Production, Transportation and Moving Occupations
The most common Production, Transportation and Moving occupations in Lyle are , and Production (22 | 24.7%).
Production, Transportation and Moving Occupations by Sex
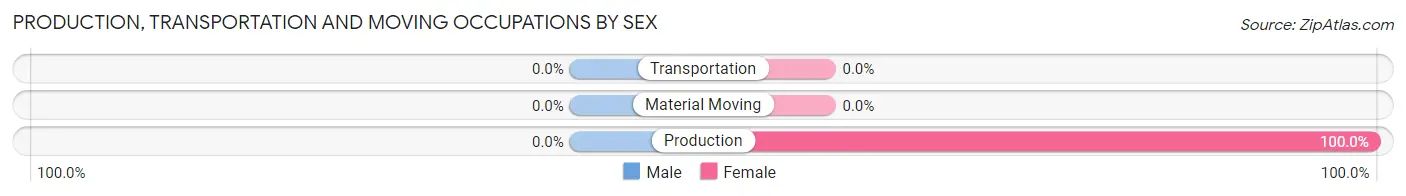
| Occupation | Male | Female |
| Production | 0 (0.0%) | 22 (100.0%) |
| Transportation | 0 (0.0%) | 0 (0.0%) |
| Material Moving | 0 (0.0%) | 0 (0.0%) |
| Total (Category) | 0 (0.0%) | 22 (100.0%) |
| Total (Overall) | 7 (7.9%) | 82 (92.1%) |
Employment Industries by Sex in Lyle
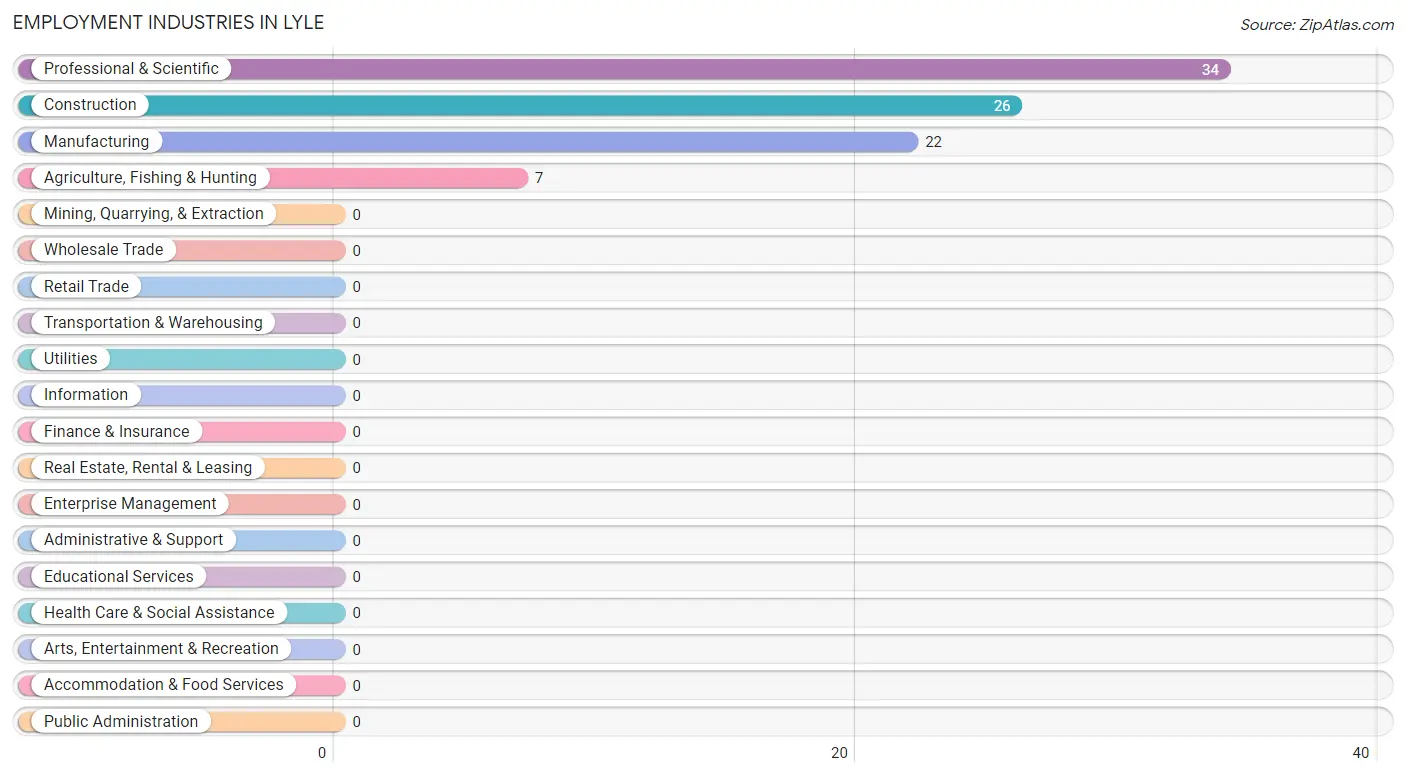
Employment Industries in Lyle
The major employment industries in Lyle include Professional & Scientific (34 | 38.2%), Construction (26 | 29.2%), Manufacturing (22 | 24.7%), and Agriculture, Fishing & Hunting (7 | 7.9%).
Employment Industries by Sex in Lyle
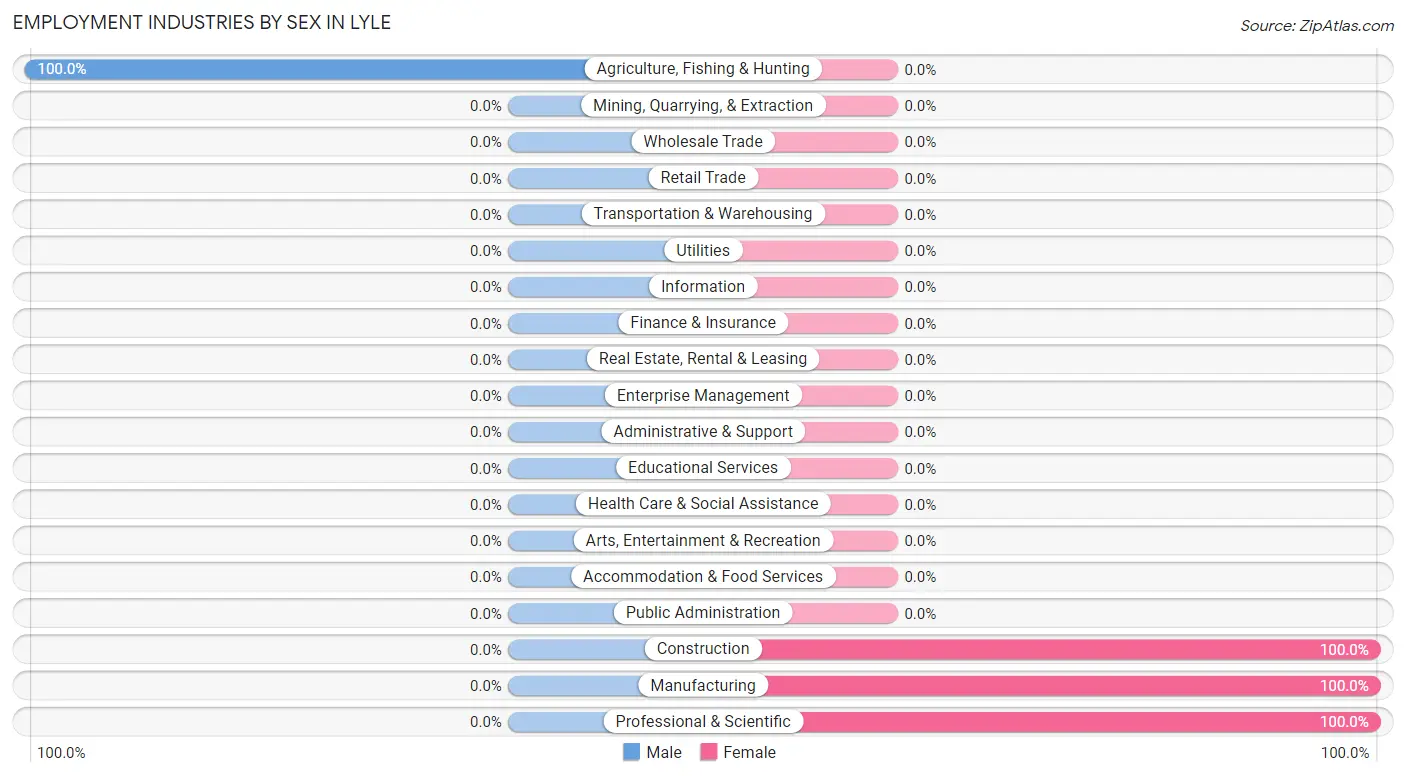
| Industry | Male | Female |
| Agriculture, Fishing & Hunting | 7 (100.0%) | 0 (0.0%) |
| Mining, Quarrying, & Extraction | 0 (0.0%) | 0 (0.0%) |
| Construction | 0 (0.0%) | 26 (100.0%) |
| Manufacturing | 0 (0.0%) | 22 (100.0%) |
| Wholesale Trade | 0 (0.0%) | 0 (0.0%) |
| Retail Trade | 0 (0.0%) | 0 (0.0%) |
| Transportation & Warehousing | 0 (0.0%) | 0 (0.0%) |
| Utilities | 0 (0.0%) | 0 (0.0%) |
| Information | 0 (0.0%) | 0 (0.0%) |
| Finance & Insurance | 0 (0.0%) | 0 (0.0%) |
| Real Estate, Rental & Leasing | 0 (0.0%) | 0 (0.0%) |
| Professional & Scientific | 0 (0.0%) | 34 (100.0%) |
| Enterprise Management | 0 (0.0%) | 0 (0.0%) |
| Administrative & Support | 0 (0.0%) | 0 (0.0%) |
| Educational Services | 0 (0.0%) | 0 (0.0%) |
| Health Care & Social Assistance | 0 (0.0%) | 0 (0.0%) |
| Arts, Entertainment & Recreation | 0 (0.0%) | 0 (0.0%) |
| Accommodation & Food Services | 0 (0.0%) | 0 (0.0%) |
| Public Administration | 0 (0.0%) | 0 (0.0%) |
| Total | 7 (7.9%) | 82 (92.1%) |
Education in Lyle
School Enrollment in Lyle
The most common levels of schooling among the 32 students in Lyle are elementary school (25 | 78.1%), and graduate / professional (7 | 21.9%).
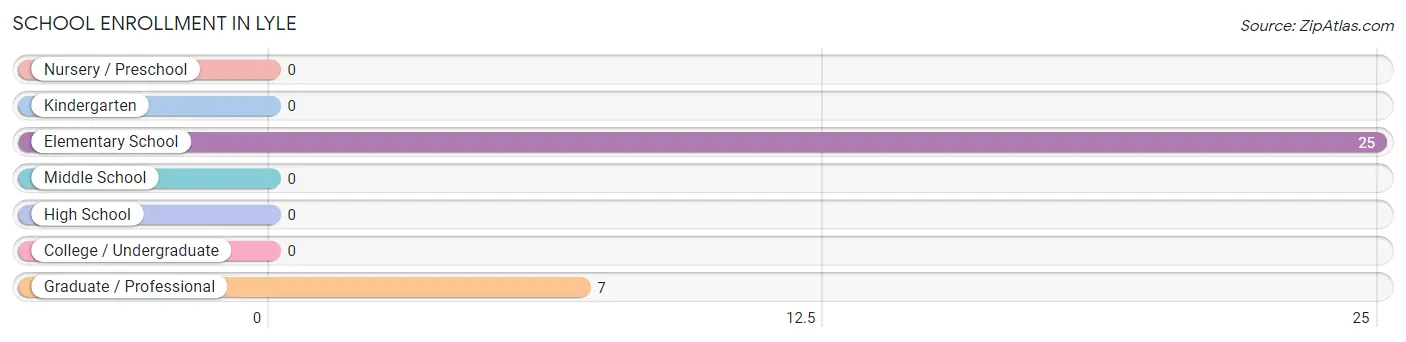
| School Level | # Students | % Students |
| Nursery / Preschool | 0 | 0.0% |
| Kindergarten | 0 | 0.0% |
| Elementary School | 25 | 78.1% |
| Middle School | 0 | 0.0% |
| High School | 0 | 0.0% |
| College / Undergraduate | 0 | 0.0% |
| Graduate / Professional | 7 | 21.9% |
| Total | 32 | 100.0% |
School Enrollment by Age by Funding Source in Lyle
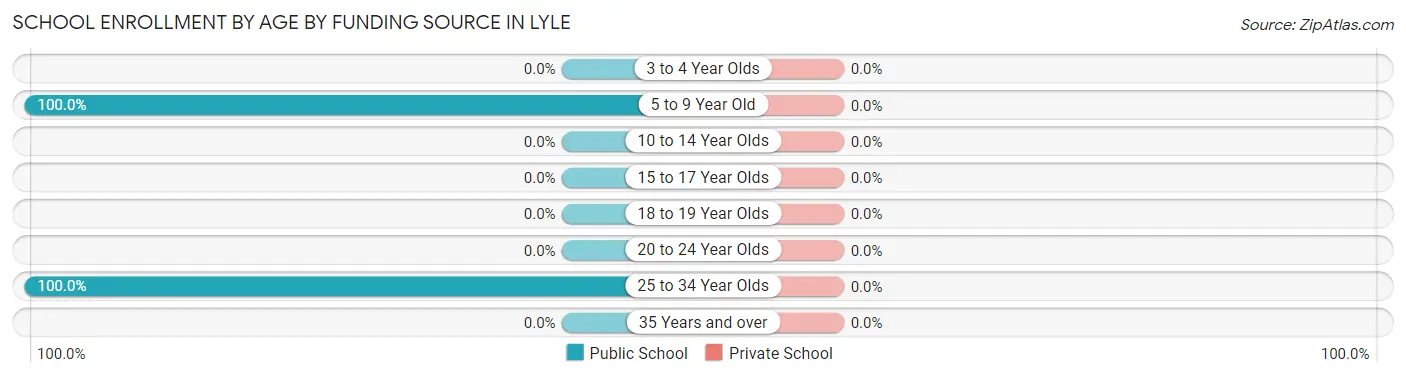
| Age Bracket | Public School | Private School |
| 3 to 4 Year Olds | 0 (0.0%) | 0 (0.0%) |
| 5 to 9 Year Old | 25 (100.0%) | 0 (0.0%) |
| 10 to 14 Year Olds | 0 (0.0%) | 0 (0.0%) |
| 15 to 17 Year Olds | 0 (0.0%) | 0 (0.0%) |
| 18 to 19 Year Olds | 0 (0.0%) | 0 (0.0%) |
| 20 to 24 Year Olds | 0 (0.0%) | 0 (0.0%) |
| 25 to 34 Year Olds | 7 (100.0%) | 0 (0.0%) |
| 35 Years and over | 0 (0.0%) | 0 (0.0%) |
| Total | 32 (100.0%) | 0 (0.0%) |
Educational Attainment by Field of Study in Lyle
Visual & performing arts (32 | 24.6%), arts & humanities (31 | 23.8%), computers & mathematics (26 | 20.0%), psychology (22 | 16.9%), and physical & health sciences (8 | 6.1%) are the most common fields of study among 130 individuals in Lyle who have obtained a bachelor's degree or higher.
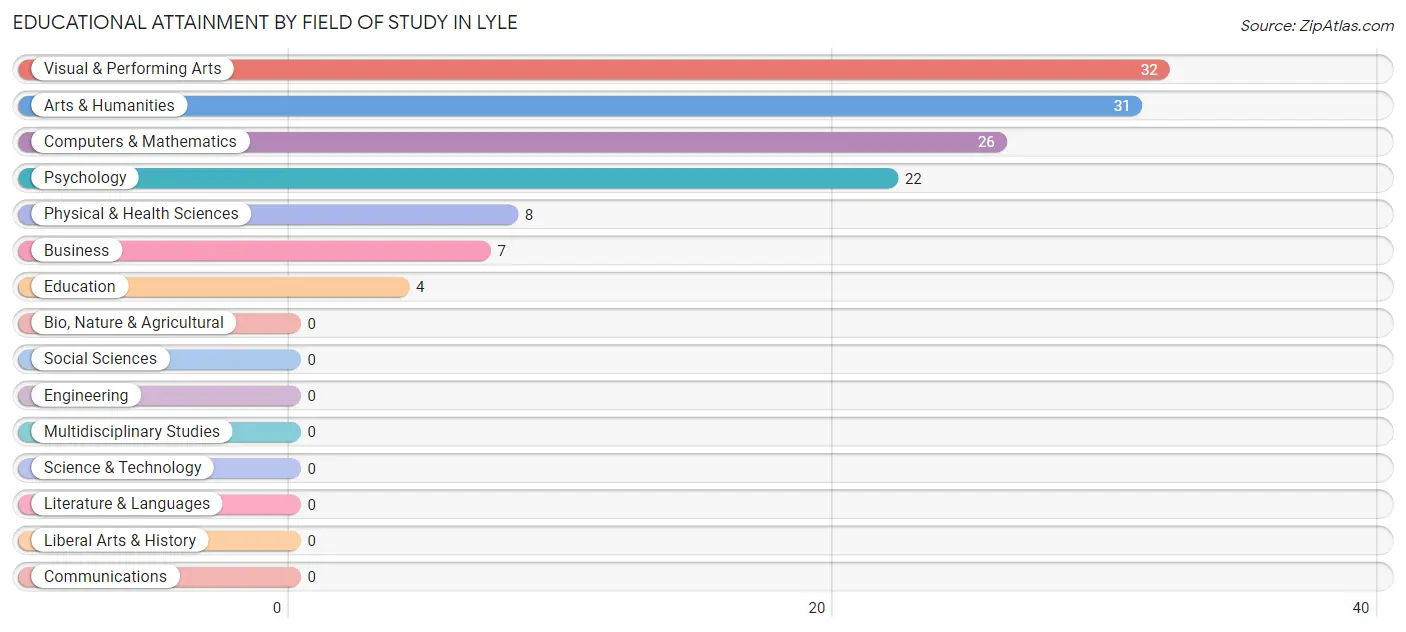
| Field of Study | # Graduates | % Graduates |
| Computers & Mathematics | 26 | 20.0% |
| Bio, Nature & Agricultural | 0 | 0.0% |
| Physical & Health Sciences | 8 | 6.1% |
| Psychology | 22 | 16.9% |
| Social Sciences | 0 | 0.0% |
| Engineering | 0 | 0.0% |
| Multidisciplinary Studies | 0 | 0.0% |
| Science & Technology | 0 | 0.0% |
| Business | 7 | 5.4% |
| Education | 4 | 3.1% |
| Literature & Languages | 0 | 0.0% |
| Liberal Arts & History | 0 | 0.0% |
| Visual & Performing Arts | 32 | 24.6% |
| Communications | 0 | 0.0% |
| Arts & Humanities | 31 | 23.8% |
| Total | 130 | 100.0% |
Transportation & Commute in Lyle
Vehicle Availability by Sex in Lyle
The most prevalent vehicle ownership categories in Lyle are males with 4 vehicles (7, accounting for 100.0%) and females with 4 vehicles (8, making up 8.5%).
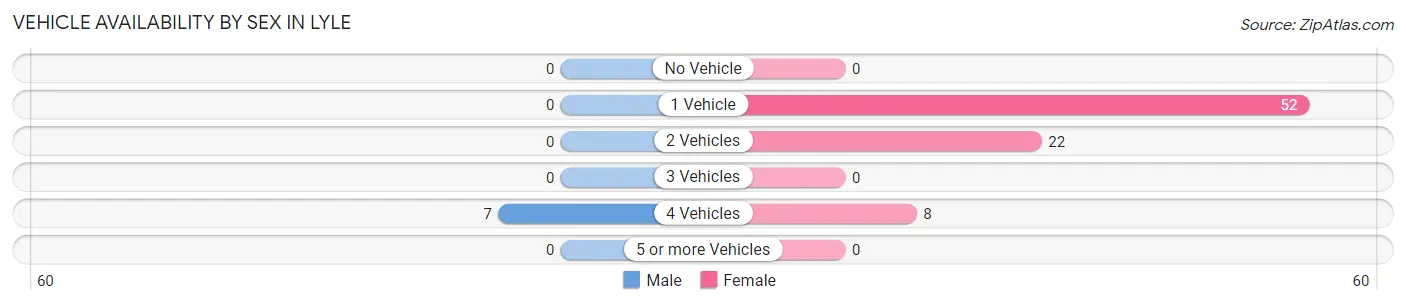
| Vehicles Available | Male | Female |
| No Vehicle | 0 (0.0%) | 0 (0.0%) |
| 1 Vehicle | 0 (0.0%) | 52 (63.4%) |
| 2 Vehicles | 0 (0.0%) | 22 (26.8%) |
| 3 Vehicles | 0 (0.0%) | 0 (0.0%) |
| 4 Vehicles | 7 (100.0%) | 8 (9.8%) |
| 5 or more Vehicles | 0 (0.0%) | 0 (0.0%) |
| Total | 7 (100.0%) | 82 (100.0%) |
Commute Time in Lyle
The most frequently occuring commute durations in Lyle are 15 to 19 minutes (34 commuters, 54.0%), less than 5 minutes (22 commuters, 34.9%), and 45 to 59 minutes (7 commuters, 11.1%).
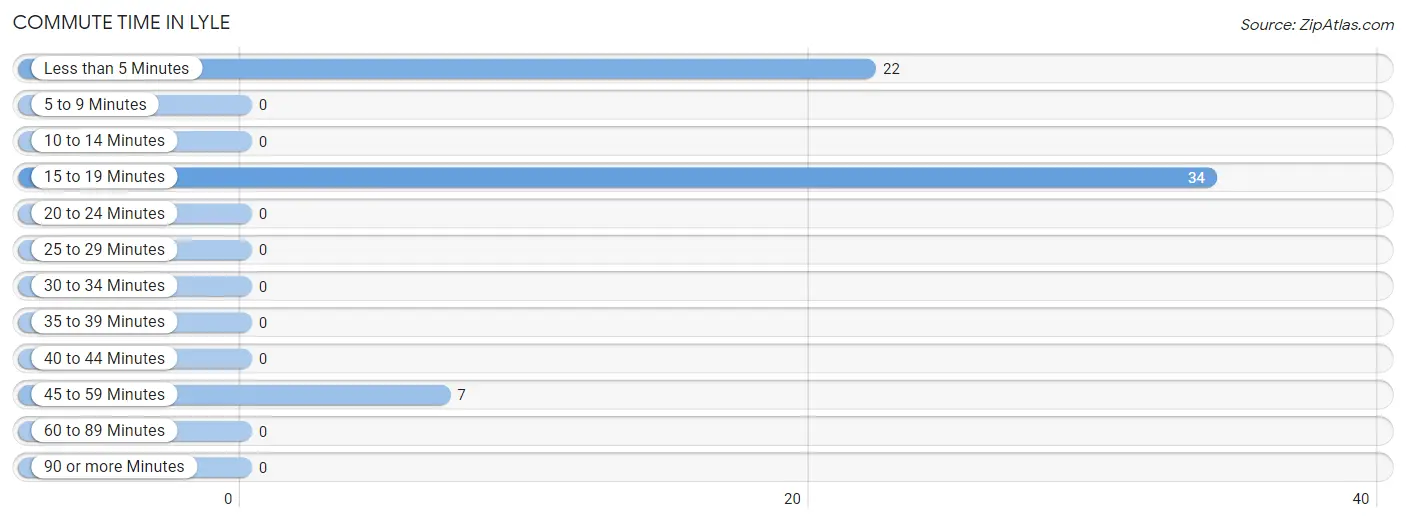
| Commute Time | # Commuters | % Commuters |
| Less than 5 Minutes | 22 | 34.9% |
| 5 to 9 Minutes | 0 | 0.0% |
| 10 to 14 Minutes | 0 | 0.0% |
| 15 to 19 Minutes | 34 | 54.0% |
| 20 to 24 Minutes | 0 | 0.0% |
| 25 to 29 Minutes | 0 | 0.0% |
| 30 to 34 Minutes | 0 | 0.0% |
| 35 to 39 Minutes | 0 | 0.0% |
| 40 to 44 Minutes | 0 | 0.0% |
| 45 to 59 Minutes | 7 | 11.1% |
| 60 to 89 Minutes | 0 | 0.0% |
| 90 or more Minutes | 0 | 0.0% |
Commute Time by Sex in Lyle
The most common commute times in Lyle are 45 to 59 minutes (7 commuters, 100.0%) for males and 15 to 19 minutes (34 commuters, 60.7%) for females.
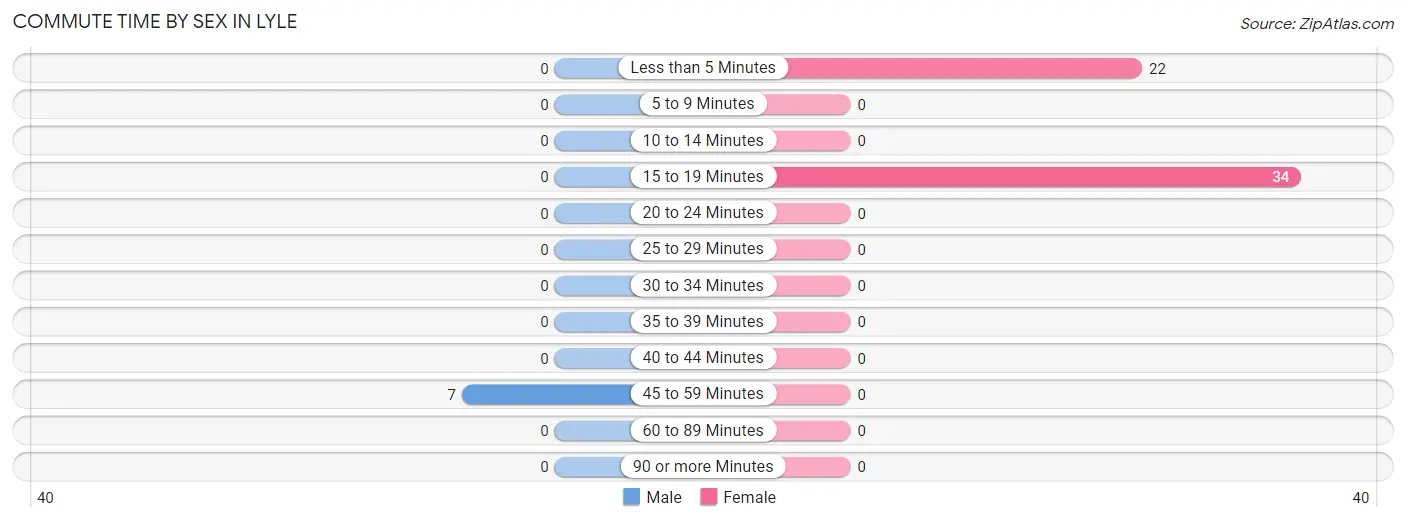
| Commute Time | Male | Female |
| Less than 5 Minutes | 0 (0.0%) | 22 (39.3%) |
| 5 to 9 Minutes | 0 (0.0%) | 0 (0.0%) |
| 10 to 14 Minutes | 0 (0.0%) | 0 (0.0%) |
| 15 to 19 Minutes | 0 (0.0%) | 34 (60.7%) |
| 20 to 24 Minutes | 0 (0.0%) | 0 (0.0%) |
| 25 to 29 Minutes | 0 (0.0%) | 0 (0.0%) |
| 30 to 34 Minutes | 0 (0.0%) | 0 (0.0%) |
| 35 to 39 Minutes | 0 (0.0%) | 0 (0.0%) |
| 40 to 44 Minutes | 0 (0.0%) | 0 (0.0%) |
| 45 to 59 Minutes | 7 (100.0%) | 0 (0.0%) |
| 60 to 89 Minutes | 0 (0.0%) | 0 (0.0%) |
| 90 or more Minutes | 0 (0.0%) | 0 (0.0%) |
Time of Departure to Work by Sex in Lyle
The most frequent times of departure to work in Lyle are 6:00 AM to 6:29 AM (7, 100.0%) for males and 12:00 AM to 4:59 AM (26, 46.4%) for females.
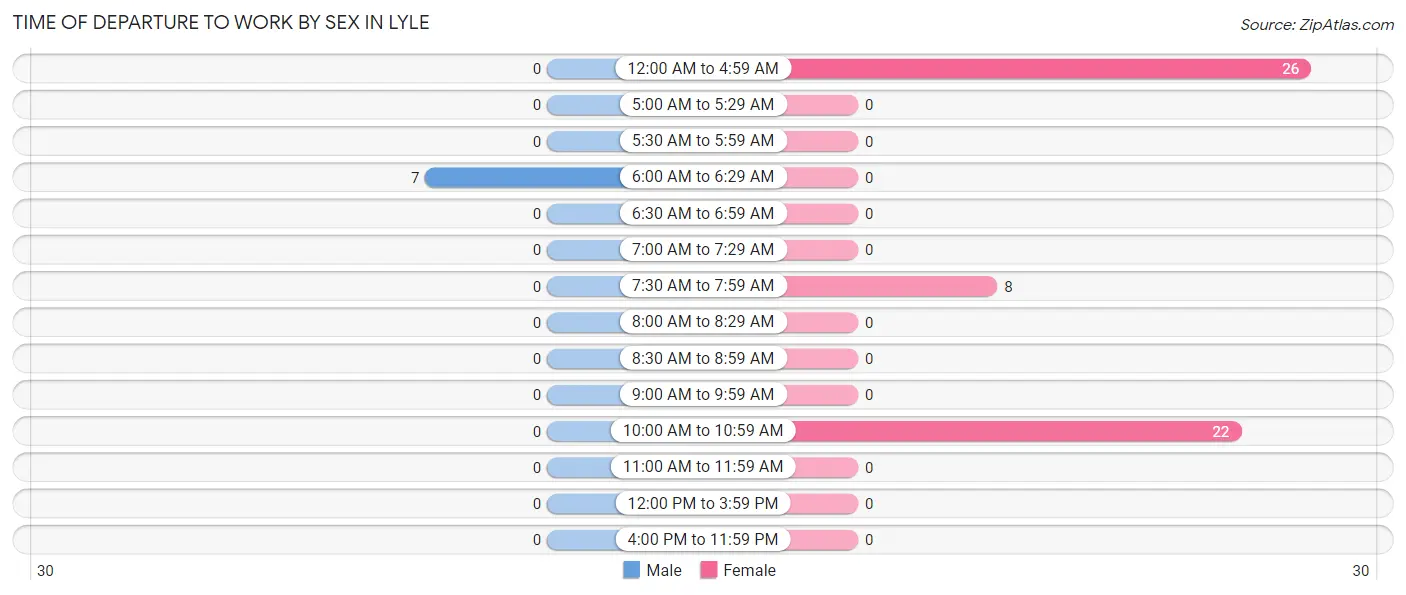
| Time of Departure | Male | Female |
| 12:00 AM to 4:59 AM | 0 (0.0%) | 26 (46.4%) |
| 5:00 AM to 5:29 AM | 0 (0.0%) | 0 (0.0%) |
| 5:30 AM to 5:59 AM | 0 (0.0%) | 0 (0.0%) |
| 6:00 AM to 6:29 AM | 7 (100.0%) | 0 (0.0%) |
| 6:30 AM to 6:59 AM | 0 (0.0%) | 0 (0.0%) |
| 7:00 AM to 7:29 AM | 0 (0.0%) | 0 (0.0%) |
| 7:30 AM to 7:59 AM | 0 (0.0%) | 8 (14.3%) |
| 8:00 AM to 8:29 AM | 0 (0.0%) | 0 (0.0%) |
| 8:30 AM to 8:59 AM | 0 (0.0%) | 0 (0.0%) |
| 9:00 AM to 9:59 AM | 0 (0.0%) | 0 (0.0%) |
| 10:00 AM to 10:59 AM | 0 (0.0%) | 22 (39.3%) |
| 11:00 AM to 11:59 AM | 0 (0.0%) | 0 (0.0%) |
| 12:00 PM to 3:59 PM | 0 (0.0%) | 0 (0.0%) |
| 4:00 PM to 11:59 PM | 0 (0.0%) | 0 (0.0%) |
| Total | 7 (100.0%) | 56 (100.0%) |
Housing Occupancy in Lyle
Occupancy by Ownership in Lyle
Of the total 186 dwellings in Lyle, owner-occupied units account for 95 (51.1%), while renter-occupied units make up 91 (48.9%).
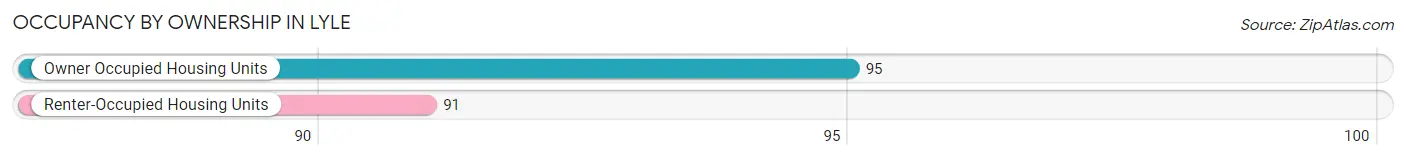
| Occupancy | # Housing Units | % Housing Units |
| Owner Occupied Housing Units | 95 | 51.1% |
| Renter-Occupied Housing Units | 91 | 48.9% |
| Total Occupied Housing Units | 186 | 100.0% |
Occupancy by Household Size in Lyle
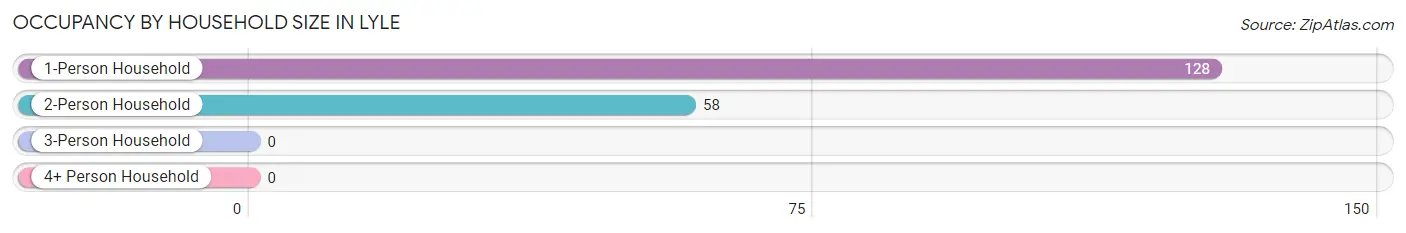
| Household Size | # Housing Units | % Housing Units |
| 1-Person Household | 128 | 68.8% |
| 2-Person Household | 58 | 31.2% |
| 3-Person Household | 0 | 0.0% |
| 4+ Person Household | 0 | 0.0% |
| Total Housing Units | 186 | 100.0% |
Occupancy by Ownership by Household Size in Lyle
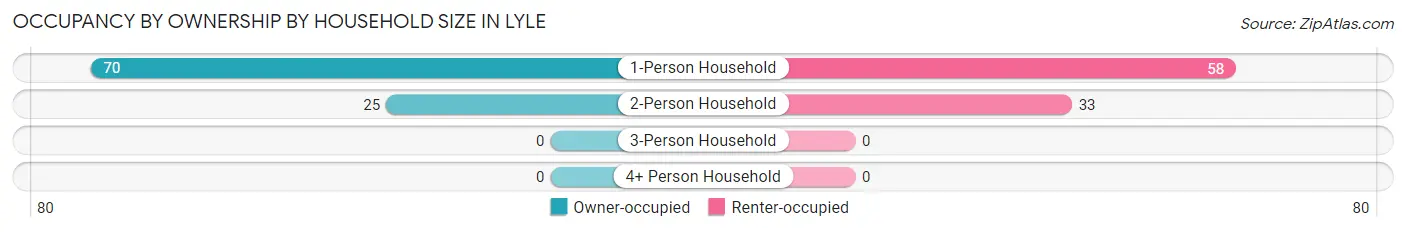
| Household Size | Owner-occupied | Renter-occupied |
| 1-Person Household | 70 (54.7%) | 58 (45.3%) |
| 2-Person Household | 25 (43.1%) | 33 (56.9%) |
| 3-Person Household | 0 (0.0%) | 0 (0.0%) |
| 4+ Person Household | 0 (0.0%) | 0 (0.0%) |
| Total Housing Units | 95 (51.1%) | 91 (48.9%) |
Occupancy by Educational Attainment in Lyle
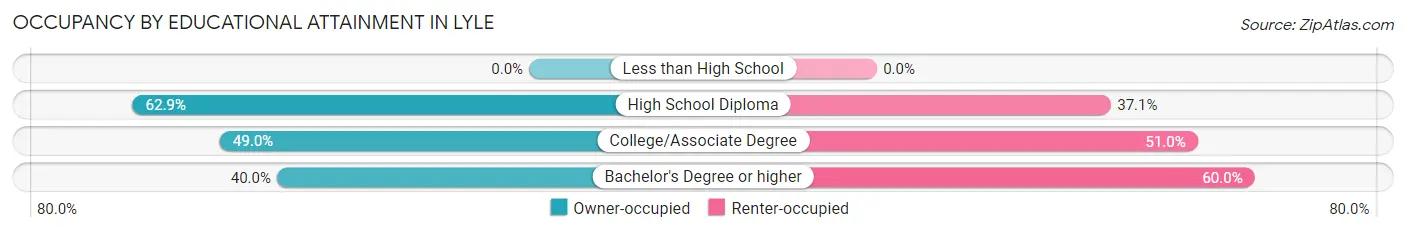
| Household Size | Owner-occupied | Renter-occupied |
| Less than High School | 0 (0.0%) | 0 (0.0%) |
| High School Diploma | 44 (62.9%) | 26 (37.1%) |
| College/Associate Degree | 25 (49.0%) | 26 (51.0%) |
| Bachelor's Degree or higher | 26 (40.0%) | 39 (60.0%) |
Occupancy by Age of Householder in Lyle
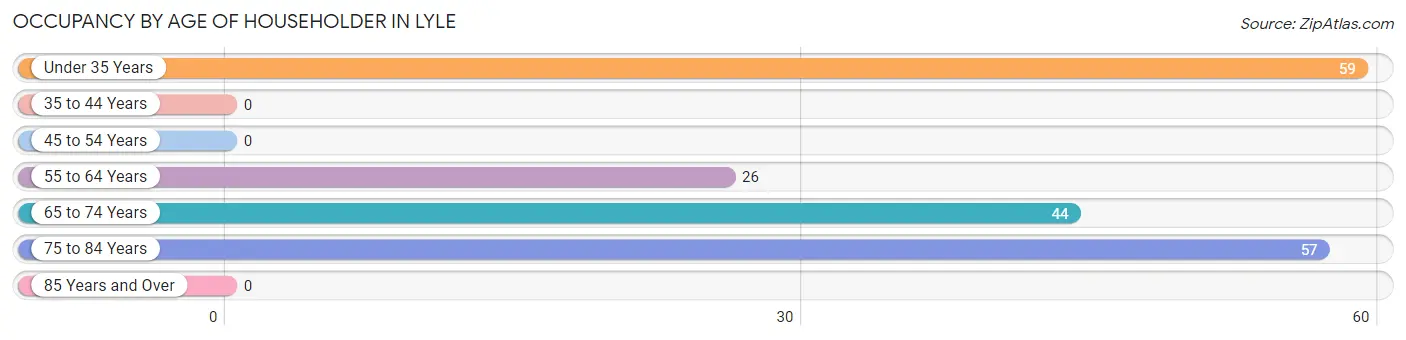
| Age Bracket | # Households | % Households |
| Under 35 Years | 59 | 31.7% |
| 35 to 44 Years | 0 | 0.0% |
| 45 to 54 Years | 0 | 0.0% |
| 55 to 64 Years | 26 | 14.0% |
| 65 to 74 Years | 44 | 23.7% |
| 75 to 84 Years | 57 | 30.6% |
| 85 Years and Over | 0 | 0.0% |
| Total | 186 | 100.0% |
Housing Finances in Lyle
Median Income by Occupancy in Lyle
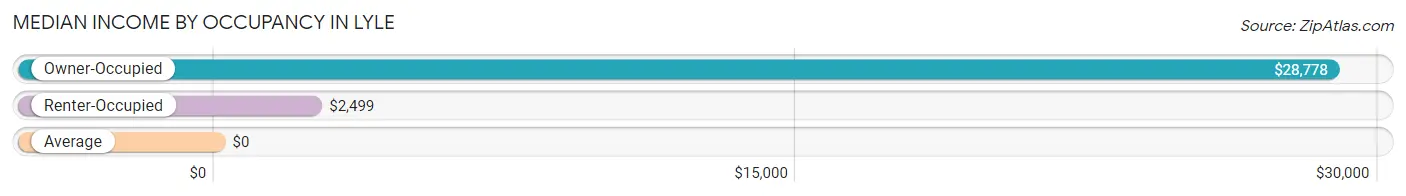
| Occupancy Type | # Households | Median Income |
| Owner-Occupied | 95 (51.1%) | $28,778 |
| Renter-Occupied | 91 (48.9%) | $2,499 |
| Average | 186 (100.0%) | $0 |
Occupancy by Householder Income Bracket in Lyle
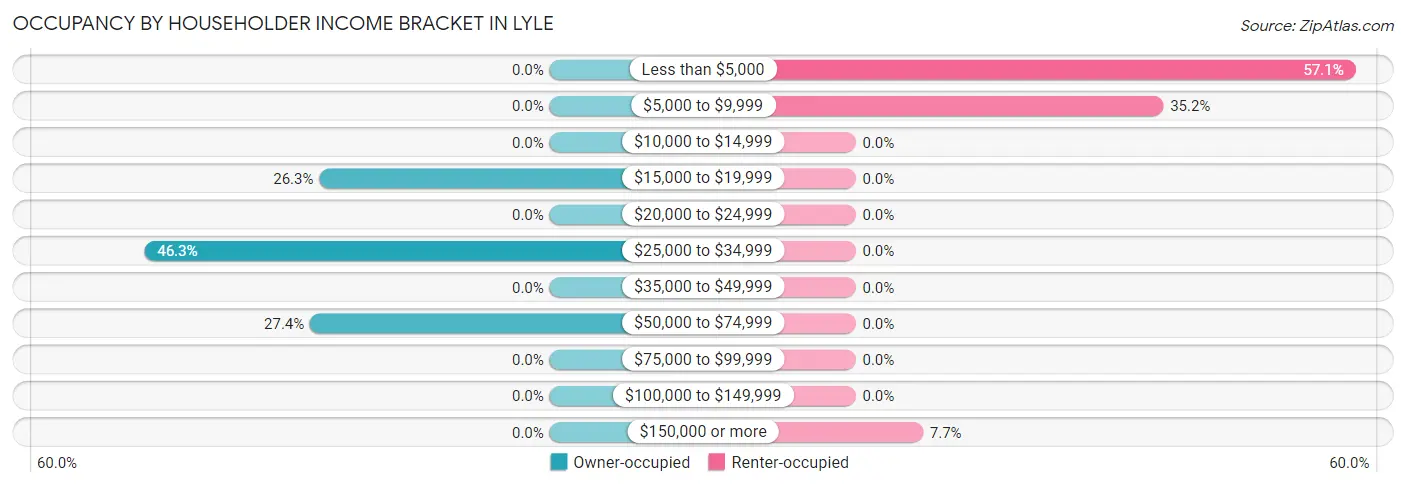
| Income Bracket | Owner-occupied | Renter-occupied |
| Less than $5,000 | 0 (0.0%) | 52 (57.1%) |
| $5,000 to $9,999 | 0 (0.0%) | 32 (35.2%) |
| $10,000 to $14,999 | 0 (0.0%) | 0 (0.0%) |
| $15,000 to $19,999 | 25 (26.3%) | 0 (0.0%) |
| $20,000 to $24,999 | 0 (0.0%) | 0 (0.0%) |
| $25,000 to $34,999 | 44 (46.3%) | 0 (0.0%) |
| $35,000 to $49,999 | 0 (0.0%) | 0 (0.0%) |
| $50,000 to $74,999 | 26 (27.4%) | 0 (0.0%) |
| $75,000 to $99,999 | 0 (0.0%) | 0 (0.0%) |
| $100,000 to $149,999 | 0 (0.0%) | 0 (0.0%) |
| $150,000 or more | 0 (0.0%) | 7 (7.7%) |
| Total | 95 (100.0%) | 91 (100.0%) |
Monthly Housing Cost Tiers in Lyle
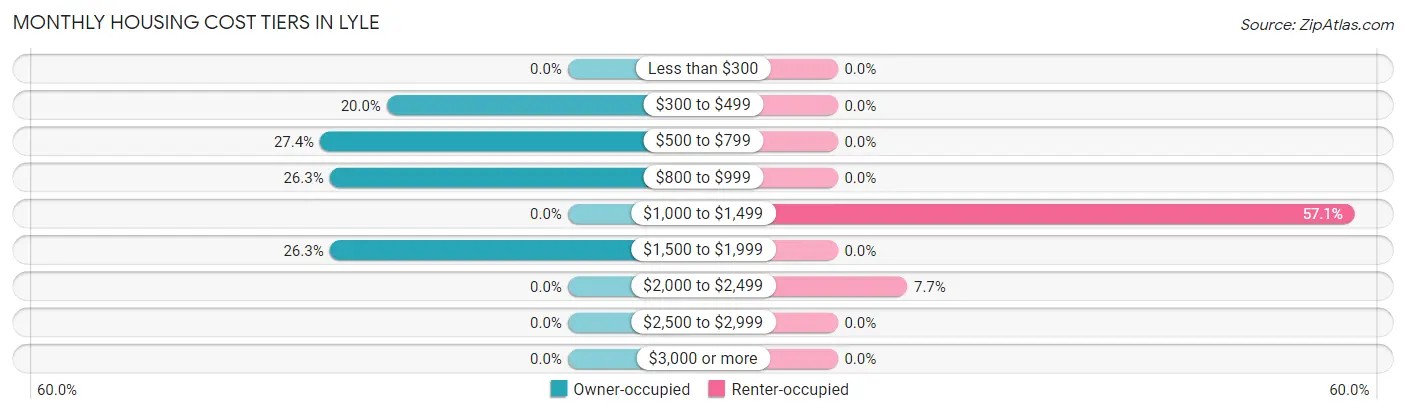
| Monthly Cost | Owner-occupied | Renter-occupied |
| Less than $300 | 0 (0.0%) | 0 (0.0%) |
| $300 to $499 | 19 (20.0%) | 0 (0.0%) |
| $500 to $799 | 26 (27.4%) | 0 (0.0%) |
| $800 to $999 | 25 (26.3%) | 0 (0.0%) |
| $1,000 to $1,499 | 0 (0.0%) | 52 (57.1%) |
| $1,500 to $1,999 | 25 (26.3%) | 0 (0.0%) |
| $2,000 to $2,499 | 0 (0.0%) | 7 (7.7%) |
| $2,500 to $2,999 | 0 (0.0%) | 0 (0.0%) |
| $3,000 or more | 0 (0.0%) | 0 (0.0%) |
| Total | 95 (100.0%) | 91 (100.0%) |
Physical Housing Characteristics in Lyle
Housing Structures in Lyle
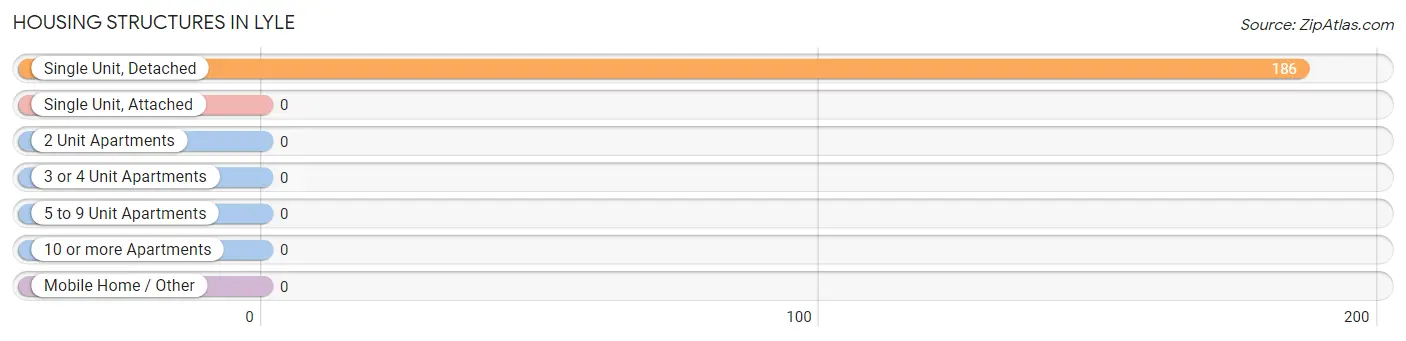
| Structure Type | # Housing Units | % Housing Units |
| Single Unit, Detached | 186 | 100.0% |
| Single Unit, Attached | 0 | 0.0% |
| 2 Unit Apartments | 0 | 0.0% |
| 3 or 4 Unit Apartments | 0 | 0.0% |
| 5 to 9 Unit Apartments | 0 | 0.0% |
| 10 or more Apartments | 0 | 0.0% |
| Mobile Home / Other | 0 | 0.0% |
| Total | 186 | 100.0% |
Housing Structures by Occupancy in Lyle
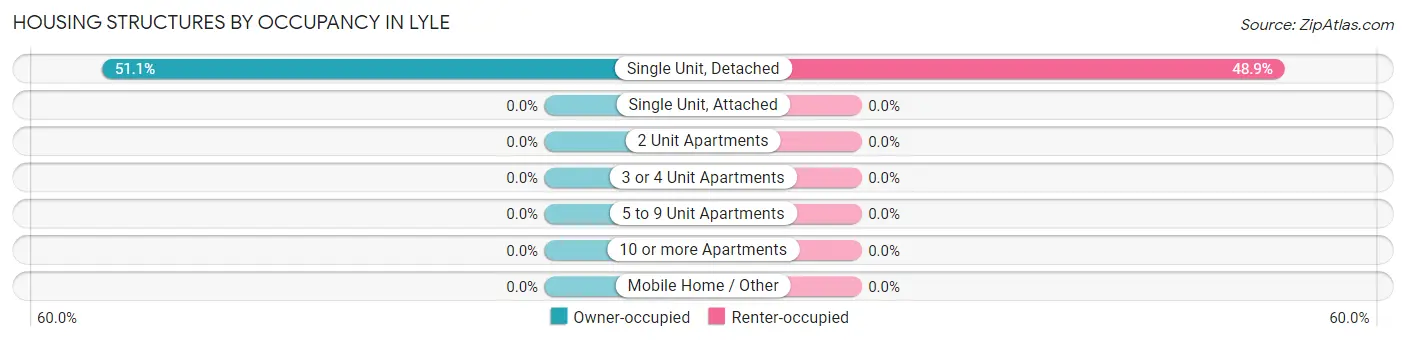
| Structure Type | Owner-occupied | Renter-occupied |
| Single Unit, Detached | 95 (51.1%) | 91 (48.9%) |
| Single Unit, Attached | 0 (0.0%) | 0 (0.0%) |
| 2 Unit Apartments | 0 (0.0%) | 0 (0.0%) |
| 3 or 4 Unit Apartments | 0 (0.0%) | 0 (0.0%) |
| 5 to 9 Unit Apartments | 0 (0.0%) | 0 (0.0%) |
| 10 or more Apartments | 0 (0.0%) | 0 (0.0%) |
| Mobile Home / Other | 0 (0.0%) | 0 (0.0%) |
| Total | 95 (51.1%) | 91 (48.9%) |
Housing Structures by Number of Rooms in Lyle
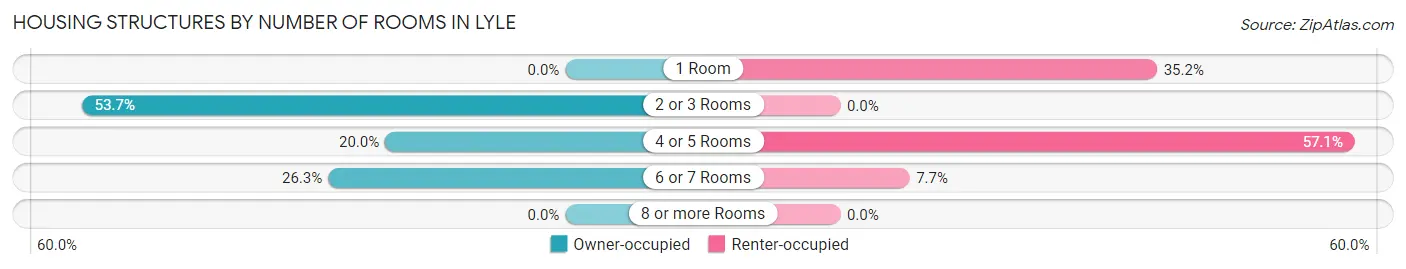
| Number of Rooms | Owner-occupied | Renter-occupied |
| 1 Room | 0 (0.0%) | 32 (35.2%) |
| 2 or 3 Rooms | 51 (53.7%) | 0 (0.0%) |
| 4 or 5 Rooms | 19 (20.0%) | 52 (57.1%) |
| 6 or 7 Rooms | 25 (26.3%) | 7 (7.7%) |
| 8 or more Rooms | 0 (0.0%) | 0 (0.0%) |
| Total | 95 (100.0%) | 91 (100.0%) |
Housing Structure by Heating Type in Lyle
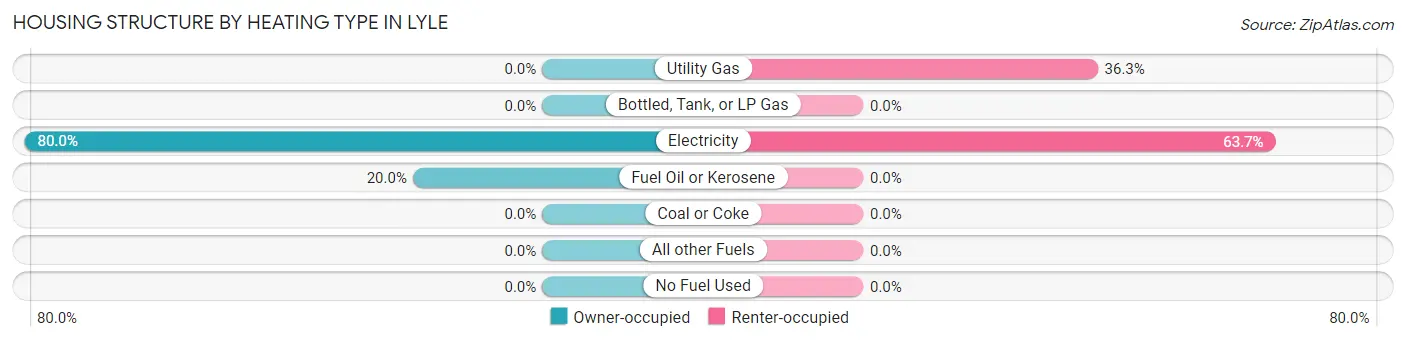
| Heating Type | Owner-occupied | Renter-occupied |
| Utility Gas | 0 (0.0%) | 33 (36.3%) |
| Bottled, Tank, or LP Gas | 0 (0.0%) | 0 (0.0%) |
| Electricity | 76 (80.0%) | 58 (63.7%) |
| Fuel Oil or Kerosene | 19 (20.0%) | 0 (0.0%) |
| Coal or Coke | 0 (0.0%) | 0 (0.0%) |
| All other Fuels | 0 (0.0%) | 0 (0.0%) |
| No Fuel Used | 0 (0.0%) | 0 (0.0%) |
| Total | 95 (100.0%) | 91 (100.0%) |
Household Vehicle Usage in Lyle
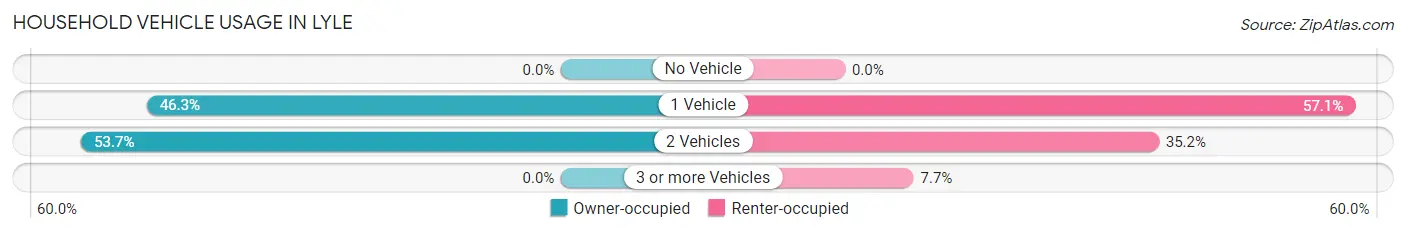
| Vehicles per Household | Owner-occupied | Renter-occupied |
| No Vehicle | 0 (0.0%) | 0 (0.0%) |
| 1 Vehicle | 44 (46.3%) | 52 (57.1%) |
| 2 Vehicles | 51 (53.7%) | 32 (35.2%) |
| 3 or more Vehicles | 0 (0.0%) | 7 (7.7%) |
| Total | 95 (100.0%) | 91 (100.0%) |
Real Estate & Mortgages in Lyle
Real Estate and Mortgage Overview in Lyle
| Characteristic | Without Mortgage | With Mortgage |
| Housing Units | 70 | 25 |
| Median Property Value | - | - |
| Median Household Income | - | - |
| Monthly Housing Costs | - | - |
| Real Estate Taxes | - | - |
Property Value by Mortgage Status in Lyle
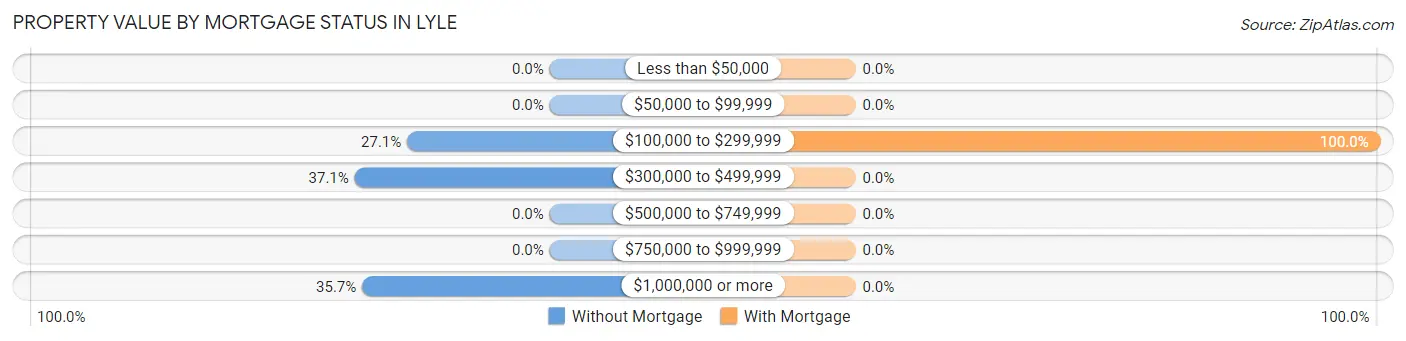
| Property Value | Without Mortgage | With Mortgage |
| Less than $50,000 | 0 (0.0%) | 0 (0.0%) |
| $50,000 to $99,999 | 0 (0.0%) | 0 (0.0%) |
| $100,000 to $299,999 | 19 (27.1%) | 25 (100.0%) |
| $300,000 to $499,999 | 26 (37.1%) | 0 (0.0%) |
| $500,000 to $749,999 | 0 (0.0%) | 0 (0.0%) |
| $750,000 to $999,999 | 0 (0.0%) | 0 (0.0%) |
| $1,000,000 or more | 25 (35.7%) | 0 (0.0%) |
| Total | 70 (100.0%) | 25 (100.0%) |
Household Income by Mortgage Status in Lyle
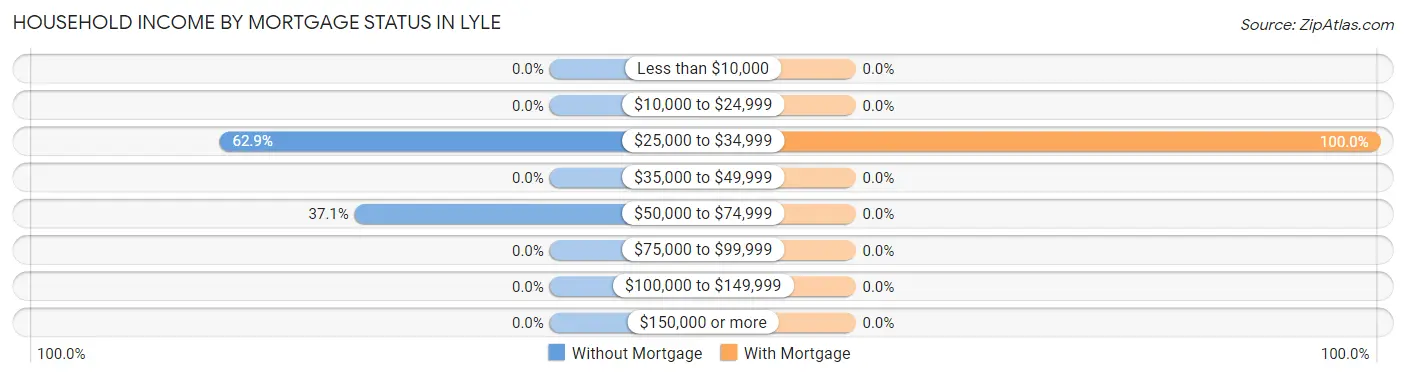
| Household Income | Without Mortgage | With Mortgage |
| Less than $10,000 | 0 (0.0%) | 0 (0.0%) |
| $10,000 to $24,999 | 0 (0.0%) | 0 (0.0%) |
| $25,000 to $34,999 | 44 (62.9%) | 25 (100.0%) |
| $35,000 to $49,999 | 0 (0.0%) | 0 (0.0%) |
| $50,000 to $74,999 | 26 (37.1%) | 0 (0.0%) |
| $75,000 to $99,999 | 0 (0.0%) | 0 (0.0%) |
| $100,000 to $149,999 | 0 (0.0%) | 0 (0.0%) |
| $150,000 or more | 0 (0.0%) | 0 (0.0%) |
| Total | 70 (100.0%) | 25 (100.0%) |
Property Value to Household Income Ratio in Lyle
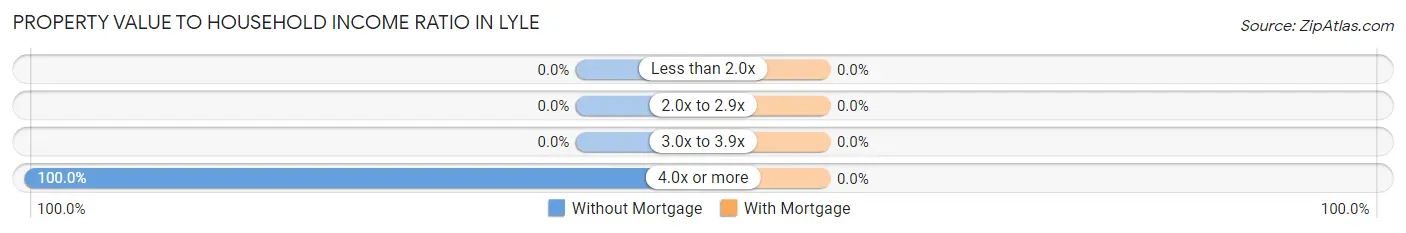
| Value-to-Income Ratio | Without Mortgage | With Mortgage |
| Less than 2.0x | 0 (0.0%) | 0 (0.0%) |
| 2.0x to 2.9x | 0 (0.0%) | 0 (0.0%) |
| 3.0x to 3.9x | 0 (0.0%) | 0 (0.0%) |
| 4.0x or more | 70 (100.0%) | 0 (0.0%) |
| Total | 70 (100.0%) | 25 (100.0%) |
Real Estate Taxes by Mortgage Status in Lyle
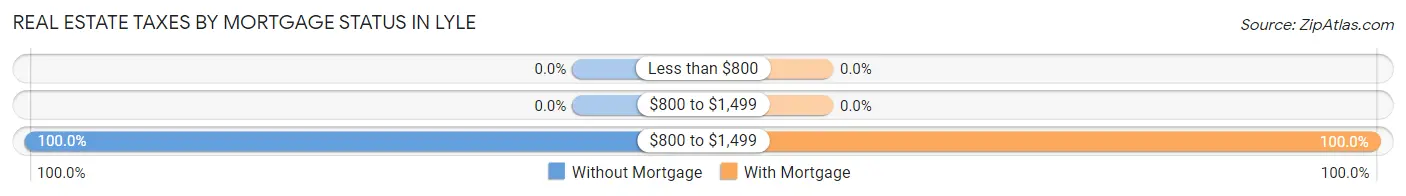
| Property Taxes | Without Mortgage | With Mortgage |
| Less than $800 | 0 (0.0%) | 0 (0.0%) |
| $800 to $1,499 | 0 (0.0%) | 0 (0.0%) |
| $800 to $1,499 | 70 (100.0%) | 25 (100.0%) |
| Total | 70 (100.0%) | 25 (100.0%) |
Health & Disability in Lyle
Health Insurance Coverage by Age in Lyle
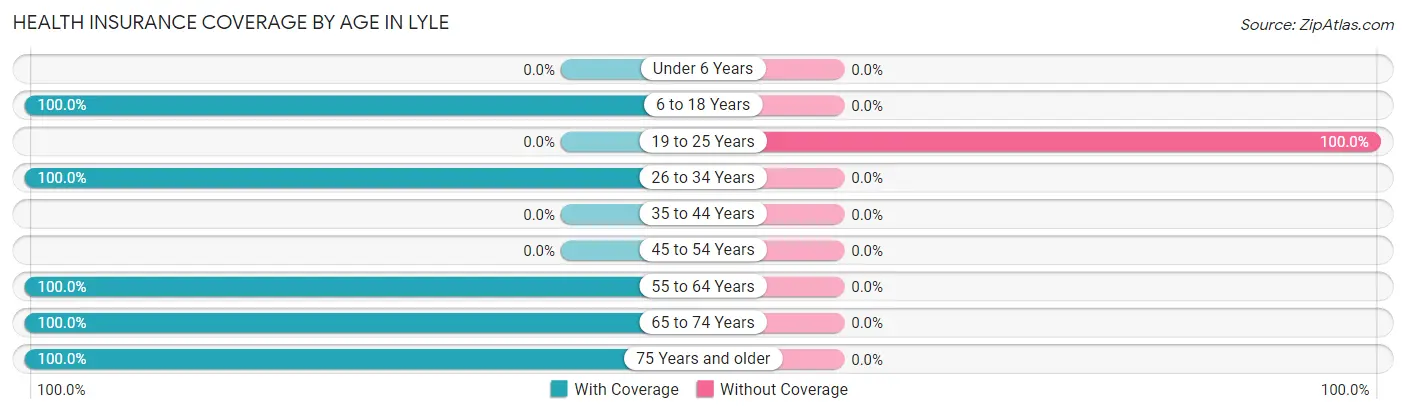
| Age Bracket | With Coverage | Without Coverage |
| Under 6 Years | 0 (0.0%) | 0 (0.0%) |
| 6 to 18 Years | 25 (100.0%) | 0 (0.0%) |
| 19 to 25 Years | 0 (0.0%) | 26 (100.0%) |
| 26 to 34 Years | 41 (100.0%) | 0 (0.0%) |
| 35 to 44 Years | 0 (0.0%) | 0 (0.0%) |
| 45 to 54 Years | 0 (0.0%) | 0 (0.0%) |
| 55 to 64 Years | 48 (100.0%) | 0 (0.0%) |
| 65 to 74 Years | 44 (100.0%) | 0 (0.0%) |
| 75 Years and older | 70 (100.0%) | 0 (0.0%) |
| Total | 228 (89.8%) | 26 (10.2%) |
Health Insurance Coverage by Citizenship Status in Lyle
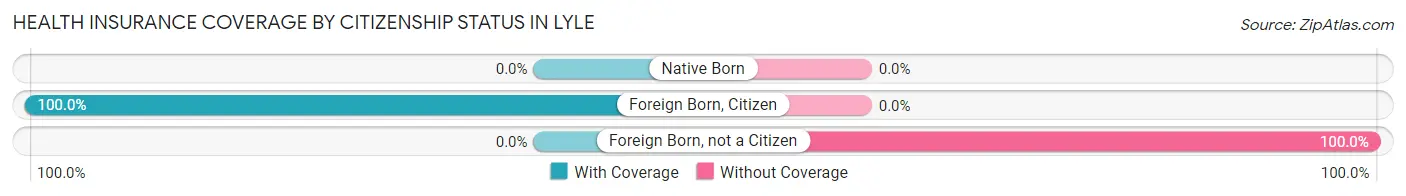
| Citizenship Status | With Coverage | Without Coverage |
| Native Born | 0 (0.0%) | 0 (0.0%) |
| Foreign Born, Citizen | 25 (100.0%) | 0 (0.0%) |
| Foreign Born, not a Citizen | 0 (0.0%) | 26 (100.0%) |
Health Insurance Coverage by Household Income in Lyle
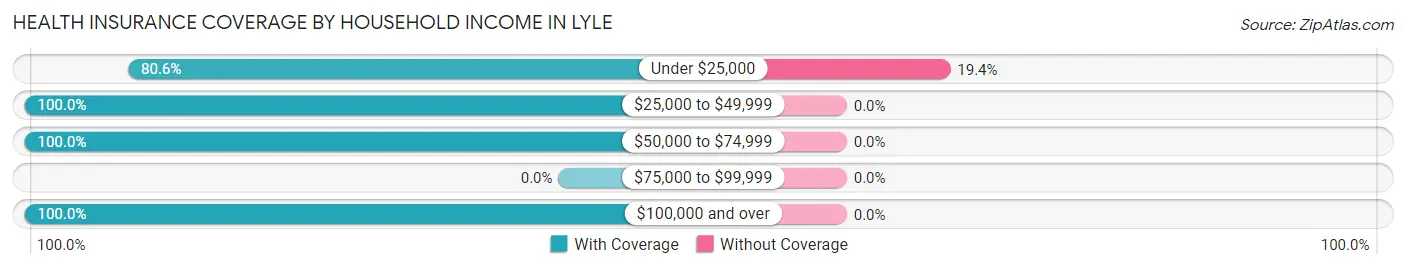
| Household Income | With Coverage | Without Coverage |
| Under $25,000 | 108 (80.6%) | 26 (19.4%) |
| $25,000 to $49,999 | 66 (100.0%) | 0 (0.0%) |
| $50,000 to $74,999 | 26 (100.0%) | 0 (0.0%) |
| $75,000 to $99,999 | 0 (0.0%) | 0 (0.0%) |
| $100,000 and over | 15 (100.0%) | 0 (0.0%) |
Public vs Private Health Insurance Coverage by Age in Lyle
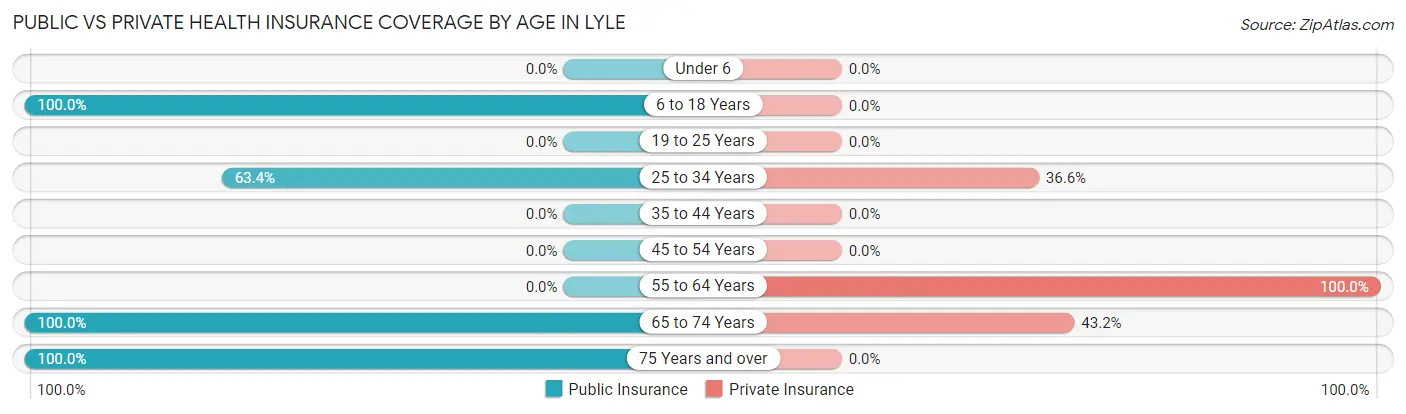
| Age Bracket | Public Insurance | Private Insurance |
| Under 6 | 0 (0.0%) | 0 (0.0%) |
| 6 to 18 Years | 25 (100.0%) | 0 (0.0%) |
| 19 to 25 Years | 0 (0.0%) | 0 (0.0%) |
| 25 to 34 Years | 26 (63.4%) | 15 (36.6%) |
| 35 to 44 Years | 0 (0.0%) | 0 (0.0%) |
| 45 to 54 Years | 0 (0.0%) | 0 (0.0%) |
| 55 to 64 Years | 0 (0.0%) | 48 (100.0%) |
| 65 to 74 Years | 44 (100.0%) | 19 (43.2%) |
| 75 Years and over | 70 (100.0%) | 0 (0.0%) |
| Total | 165 (65.0%) | 82 (32.3%) |
Disability Status by Sex by Age in Lyle
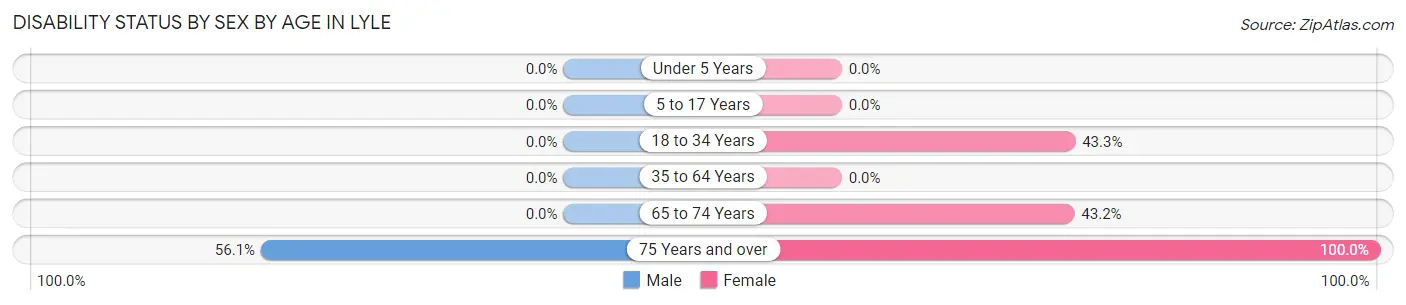
| Age Bracket | Male | Female |
| Under 5 Years | 0 (0.0%) | 0 (0.0%) |
| 5 to 17 Years | 0 (0.0%) | 0 (0.0%) |
| 18 to 34 Years | 0 (0.0%) | 26 (43.3%) |
| 35 to 64 Years | 0 (0.0%) | 0 (0.0%) |
| 65 to 74 Years | 0 (0.0%) | 19 (43.2%) |
| 75 Years and over | 32 (56.1%) | 13 (100.0%) |
Disability Class by Sex by Age in Lyle
Disability Class: Hearing Difficulty
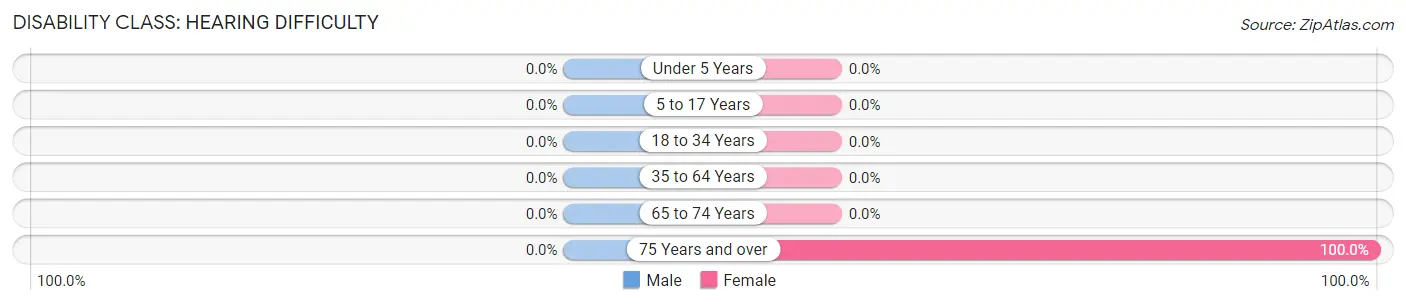
| Age Bracket | Male | Female |
| Under 5 Years | 0 (0.0%) | 0 (0.0%) |
| 5 to 17 Years | 0 (0.0%) | 0 (0.0%) |
| 18 to 34 Years | 0 (0.0%) | 0 (0.0%) |
| 35 to 64 Years | 0 (0.0%) | 0 (0.0%) |
| 65 to 74 Years | 0 (0.0%) | 0 (0.0%) |
| 75 Years and over | 0 (0.0%) | 13 (100.0%) |
Disability Class: Vision Difficulty
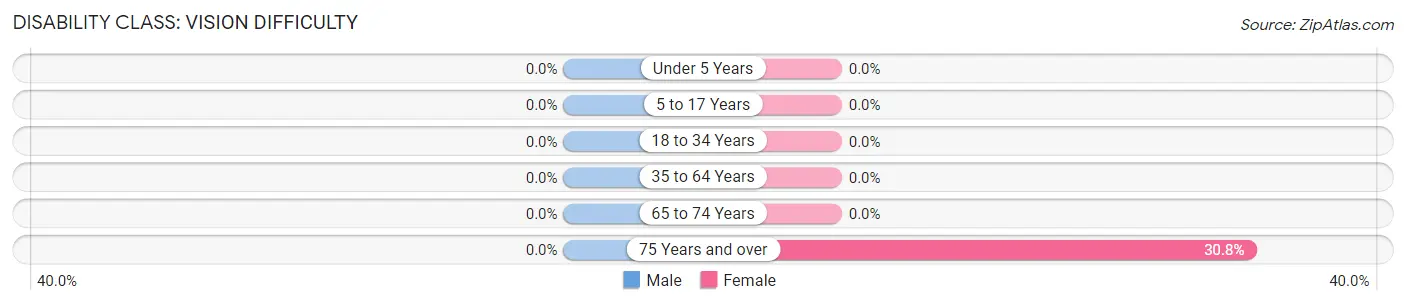
| Age Bracket | Male | Female |
| Under 5 Years | 0 (0.0%) | 0 (0.0%) |
| 5 to 17 Years | 0 (0.0%) | 0 (0.0%) |
| 18 to 34 Years | 0 (0.0%) | 0 (0.0%) |
| 35 to 64 Years | 0 (0.0%) | 0 (0.0%) |
| 65 to 74 Years | 0 (0.0%) | 0 (0.0%) |
| 75 Years and over | 0 (0.0%) | 4 (30.8%) |
Disability Class: Cognitive Difficulty
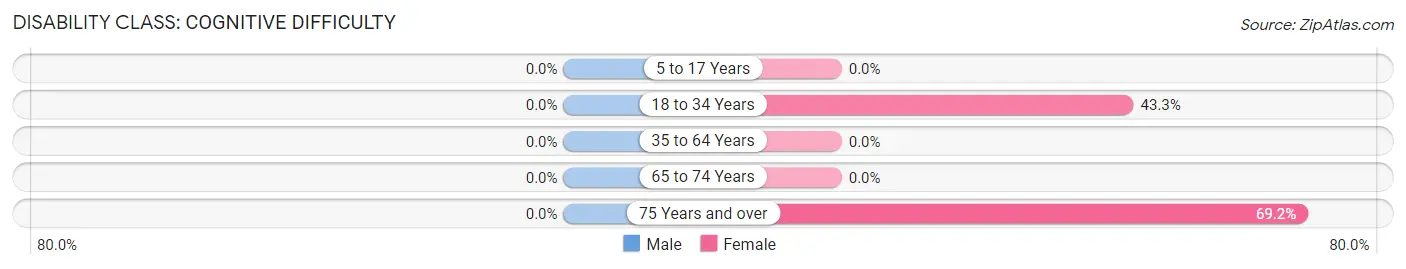
| Age Bracket | Male | Female |
| 5 to 17 Years | 0 (0.0%) | 0 (0.0%) |
| 18 to 34 Years | 0 (0.0%) | 26 (43.3%) |
| 35 to 64 Years | 0 (0.0%) | 0 (0.0%) |
| 65 to 74 Years | 0 (0.0%) | 0 (0.0%) |
| 75 Years and over | 0 (0.0%) | 9 (69.2%) |
Disability Class: Ambulatory Difficulty
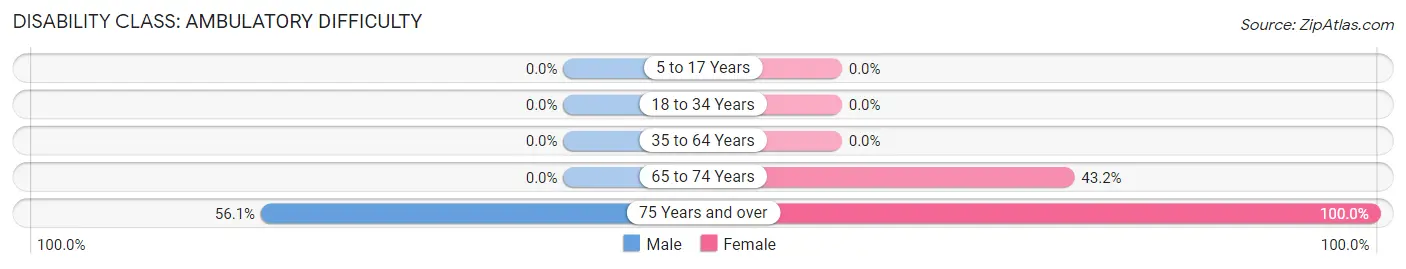
| Age Bracket | Male | Female |
| 5 to 17 Years | 0 (0.0%) | 0 (0.0%) |
| 18 to 34 Years | 0 (0.0%) | 0 (0.0%) |
| 35 to 64 Years | 0 (0.0%) | 0 (0.0%) |
| 65 to 74 Years | 0 (0.0%) | 19 (43.2%) |
| 75 Years and over | 32 (56.1%) | 13 (100.0%) |
Disability Class: Self-Care Difficulty
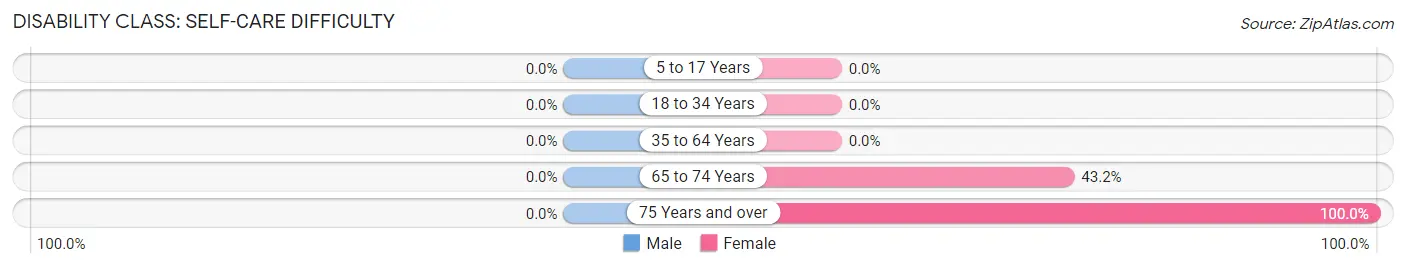
| Age Bracket | Male | Female |
| 5 to 17 Years | 0 (0.0%) | 0 (0.0%) |
| 18 to 34 Years | 0 (0.0%) | 0 (0.0%) |
| 35 to 64 Years | 0 (0.0%) | 0 (0.0%) |
| 65 to 74 Years | 0 (0.0%) | 19 (43.2%) |
| 75 Years and over | 0 (0.0%) | 13 (100.0%) |
Technology Access in Lyle
Computing Device Access in Lyle
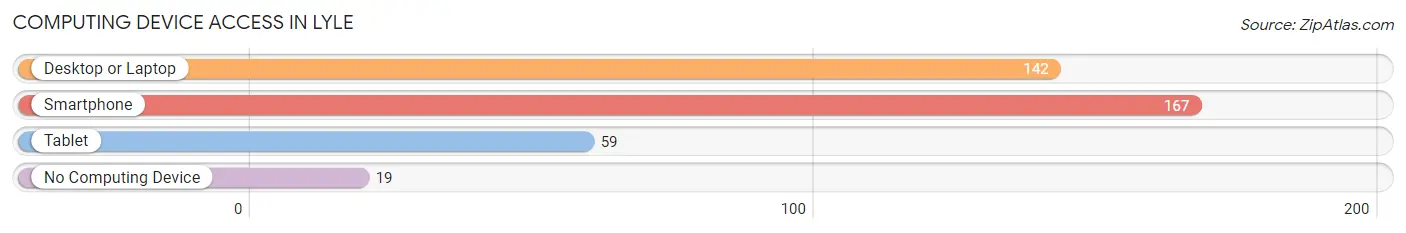
| Device Type | # Households | % Households |
| Desktop or Laptop | 142 | 76.3% |
| Smartphone | 167 | 89.8% |
| Tablet | 59 | 31.7% |
| No Computing Device | 19 | 10.2% |
| Total | 186 | 100.0% |
Internet Access in Lyle
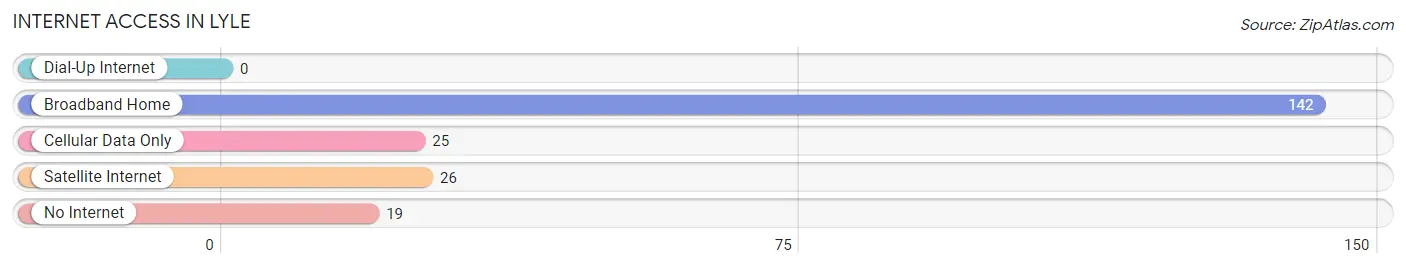
| Internet Type | # Households | % Households |
| Dial-Up Internet | 0 | 0.0% |
| Broadband Home | 142 | 76.3% |
| Cellular Data Only | 25 | 13.4% |
| Satellite Internet | 26 | 14.0% |
| No Internet | 19 | 10.2% |
| Total | 186 | 100.0% |
Lyle Summary
Lyle is a small town located in Klickitat County, Washington, United States. It is situated along the Columbia River, approximately 20 miles east of the city of The Dalles, Oregon. The population of Lyle was 545 at the 2010 census.
History
The area around Lyle was first inhabited by Native American tribes, including the Yakama, Klickitat, and Wasco. The first white settlers arrived in the area in the late 1800s, and the town of Lyle was officially established in 1891. The town was named after Lyle H. Cady, a local businessman and rancher.
In the early 1900s, Lyle was a thriving agricultural community, with many farms and orchards in the area. The town was also home to a number of businesses, including a general store, a hotel, a blacksmith shop, and a sawmill.
In the 1950s, the construction of the Dalles Dam on the Columbia River changed the landscape of the area. The dam created Lake Celilo, which flooded much of the land around Lyle. The town was relocated to higher ground, and the population decreased as many of the residents moved away.
Geography
Lyle is located in Klickitat County, Washington, at the confluence of the Columbia and Klickitat Rivers. The town is situated at an elevation of 545 feet above sea level.
The climate in Lyle is semi-arid, with hot summers and cold winters. The average annual temperature is 54°F, and the average annual precipitation is 11.5 inches.
Economy
The economy of Lyle is largely based on agriculture and tourism. The town is home to several wineries, and the nearby Columbia River Gorge is a popular destination for outdoor recreation.
The town is also home to a number of small businesses, including a grocery store, a hardware store, and a cafe.
Demographics
As of the 2010 census, the population of Lyle was 545. The racial makeup of the town was 94.2% White, 0.7% Native American, 0.2% Asian, 0.2% Pacific Islander, 0.2% from other races, and 4.7% from two or more races.
The median household income in Lyle was $37,500, and the median family income was $41,250. The per capita income was $17,857. About 11.2% of the population was below the poverty line.
Common Questions
What is Per Capita Income in Lyle?
Per Capita income in Lyle is $18,680.
What is Inequality or Gini Index in Lyle?
Inequality or Gini Index in Lyle is 0.59.
What is the Total Population of Lyle?
Total Population of Lyle is 254.
What is the Total Male Population of Lyle?
Total Male Population of Lyle is 115.
What is the Total Female Population of Lyle?
Total Female Population of Lyle is 139.
What is the Ratio of Males per 100 Females in Lyle?
There are 82.73 Males per 100 Females in Lyle.
What is the Ratio of Females per 100 Males in Lyle?
There are 120.87 Females per 100 Males in Lyle.
What is the Median Population Age in Lyle?
Median Population Age in Lyle is 61.7 Years.
What is the Average Family Size in Lyle
Average Family Size in Lyle is 1.9 People.
What is the Average Household Size in Lyle
Average Household Size in Lyle is 1.3 People.
How Large is the Labor Force in Lyle?
There are 89 People in the Labor Forcein in Lyle.
What is the Percentage of People in the Labor Force in Lyle?
38.9% of People are in the Labor Force in Lyle.