Zip Codes with the Highest Percentage of Population Employed in Health Diagnosing & Treating in Kennewick, WA
RELATED REPORTS & OPTIONS
Health Diagnosing & Treating
Kennewick
Compare Zip Codes
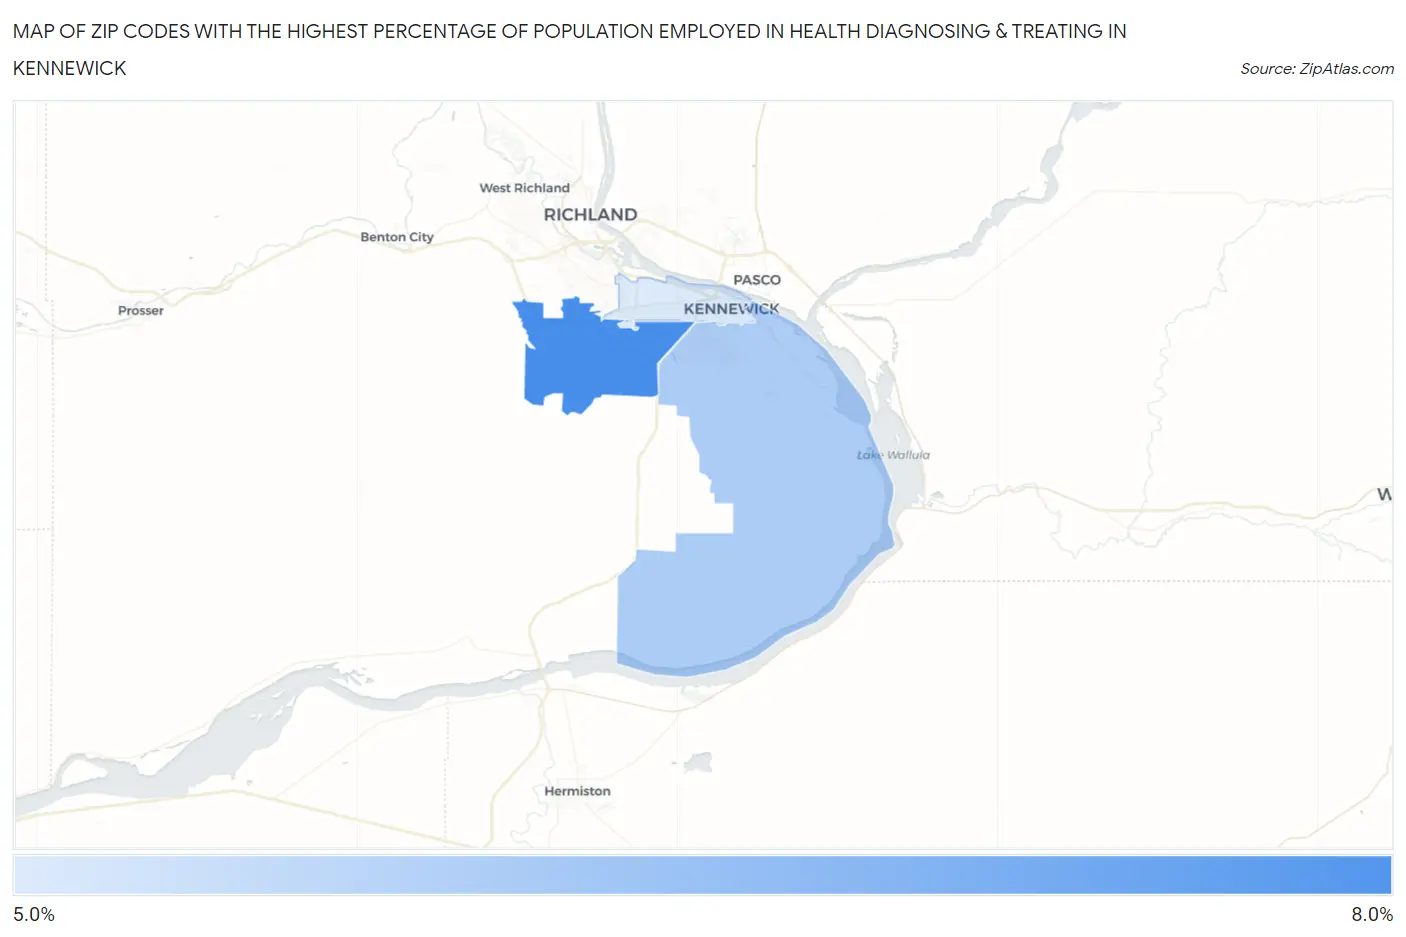
Map of Zip Codes with the Highest Percentage of Population Employed in Health Diagnosing & Treating in Kennewick
5.1%
7.2%
Zip Codes with the Highest Percentage of Population Employed in Health Diagnosing & Treating in Kennewick, WA
| Zip Code | % Employed | vs State | vs National | |
| 1. | 99338 | 7.2% | 5.6%(+1.68)#109 | 6.2%(+0.990)#9,607 |
| 2. | 99337 | 5.7% | 5.6%(+0.193)#195 | 6.2%(-0.497)#14,803 |
| 3. | 99336 | 5.1% | 5.6%(-0.500)#263 | 6.2%(-1.19)#17,483 |
1
Common Questions
What are the Top Zip Codes with the Highest Percentage of Population Employed in Health Diagnosing & Treating in Kennewick, WA?
Top Zip Codes with the Highest Percentage of Population Employed in Health Diagnosing & Treating in Kennewick, WA are:
What zip code has the Highest Percentage of Population Employed in Health Diagnosing & Treating in Kennewick, WA?
99338 has the Highest Percentage of Population Employed in Health Diagnosing & Treating in Kennewick, WA with 7.2%.
What is the Percentage of Population Employed in Health Diagnosing & Treating in Kennewick, WA?
Percentage of Population Employed in Health Diagnosing & Treating in Kennewick is 5.7%.
What is the Percentage of Population Employed in Health Diagnosing & Treating in Washington?
Percentage of Population Employed in Health Diagnosing & Treating in Washington is 5.6%.
What is the Percentage of Population Employed in Health Diagnosing & Treating in the United States?
Percentage of Population Employed in Health Diagnosing & Treating in the United States is 6.2%.