Zip Codes with the Highest Percentage of Population Employed in Health Diagnosing & Treating in Puyallup, WA
RELATED REPORTS & OPTIONS
Health Diagnosing & Treating
Puyallup
Compare Zip Codes
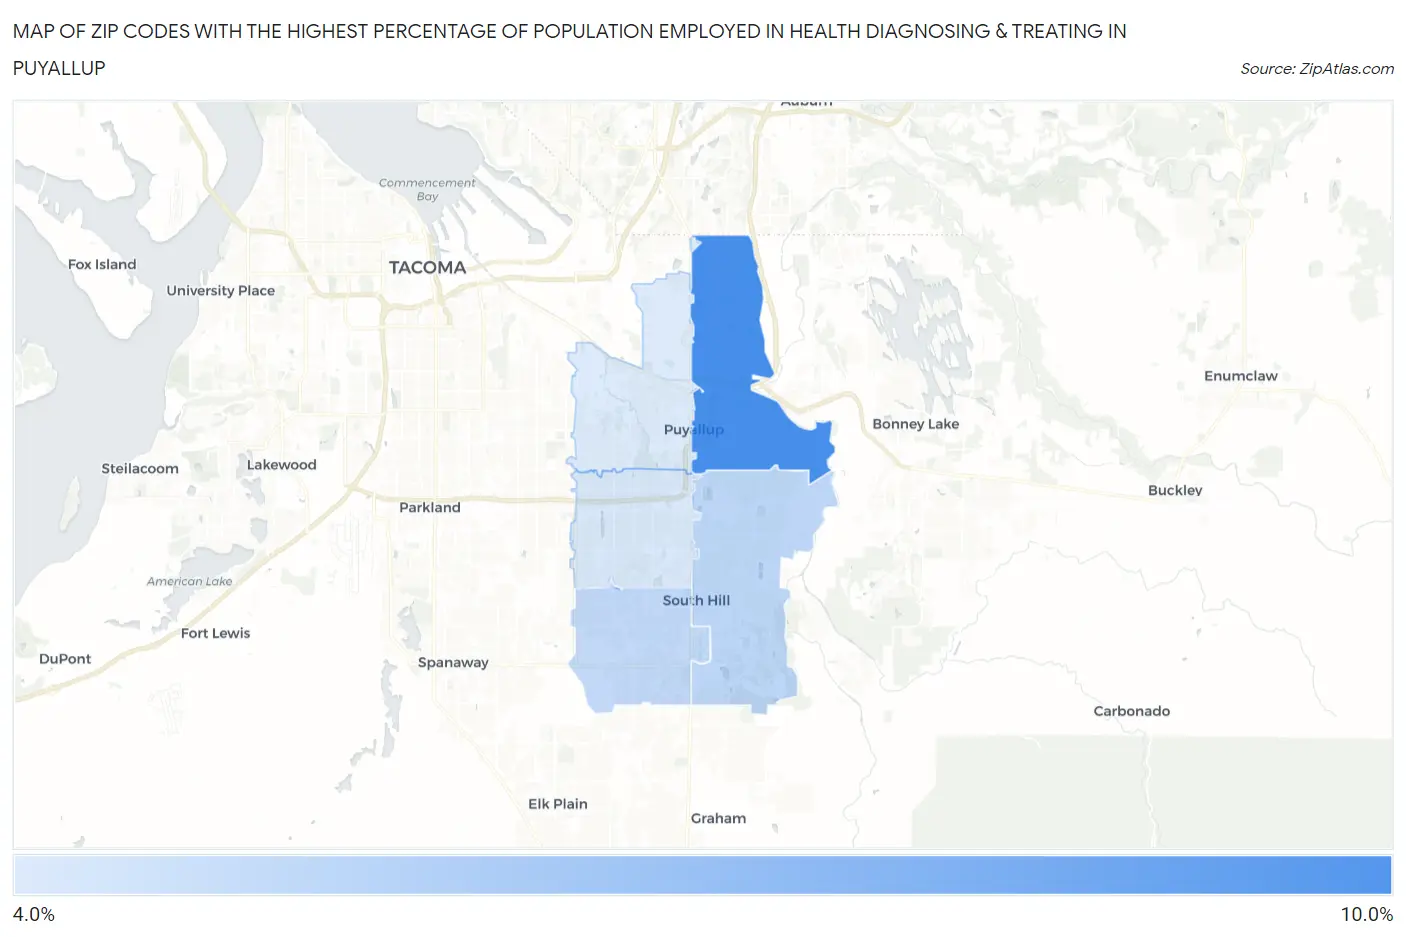
Map of Zip Codes with the Highest Percentage of Population Employed in Health Diagnosing & Treating in Puyallup
5.0%
8.0%
Zip Codes with the Highest Percentage of Population Employed in Health Diagnosing & Treating in Puyallup, WA
| Zip Code | % Employed | vs State | vs National | |
| 1. | 98372 | 8.0% | 5.6%(+2.46)#75 | 6.2%(+1.77)#7,464 |
| 2. | 98374 | 5.6% | 5.6%(+0.028)#214 | 6.2%(-0.663)#15,466 |
| 3. | 98375 | 5.5% | 5.6%(-0.057)#221 | 6.2%(-0.748)#15,798 |
| 4. | 98373 | 5.0% | 5.6%(-0.505)#264 | 6.2%(-1.20)#17,502 |
| 5. | 98371 | 5.0% | 5.6%(-0.601)#276 | 6.2%(-1.29)#17,895 |
1
Common Questions
What are the Top 3 Zip Codes with the Highest Percentage of Population Employed in Health Diagnosing & Treating in Puyallup, WA?
Top 3 Zip Codes with the Highest Percentage of Population Employed in Health Diagnosing & Treating in Puyallup, WA are:
What zip code has the Highest Percentage of Population Employed in Health Diagnosing & Treating in Puyallup, WA?
98372 has the Highest Percentage of Population Employed in Health Diagnosing & Treating in Puyallup, WA with 8.0%.
What is the Percentage of Population Employed in Health Diagnosing & Treating in Puyallup, WA?
Percentage of Population Employed in Health Diagnosing & Treating in Puyallup is 6.1%.
What is the Percentage of Population Employed in Health Diagnosing & Treating in Washington?
Percentage of Population Employed in Health Diagnosing & Treating in Washington is 5.6%.
What is the Percentage of Population Employed in Health Diagnosing & Treating in the United States?
Percentage of Population Employed in Health Diagnosing & Treating in the United States is 6.2%.