River Road, WA Map & Demographics
River Road Map
River Road Overview
$26,739
PER CAPITA INCOME
$93,304
AVG FAMILY INCOME
$93,304
AVG HOUSEHOLD INCOME
37.3%
WAGE / INCOME GAP [ % ]
62.7¢/ $1
WAGE / INCOME GAP [ $ ]
0.31
INEQUALITY / GINI INDEX
800
TOTAL POPULATION
455
MALE POPULATION
345
FEMALE POPULATION
131.88
MALES / 100 FEMALES
75.82
FEMALES / 100 MALES
43.8
MEDIAN AGE
3.6
AVG FAMILY SIZE
3.6
AVG HOUSEHOLD SIZE
316
LABOR FORCE [ PEOPLE ]
53.5%
PERCENT IN LABOR FORCE
10.8%
UNEMPLOYMENT RATE
Income in River Road
Income Overview in River Road
Per Capita Income in River Road is $26,739, while median incomes of families and households are $93,304 and $93,304 respectively.
| Characteristic | Number | Measure |
| Per Capita Income | 800 | $26,739 |
| Median Family Income | 221 | $93,304 |
| Mean Family Income | 221 | $95,951 |
| Median Household Income | 221 | $93,304 |
| Mean Household Income | 221 | $95,951 |
| Income Deficit | 221 | $0 |
| Wage / Income Gap (%) | 800 | 37.26% |
| Wage / Income Gap ($) | 800 | 62.74¢ per $1 |
| Gini / Inequality Index | 800 | 0.31 |
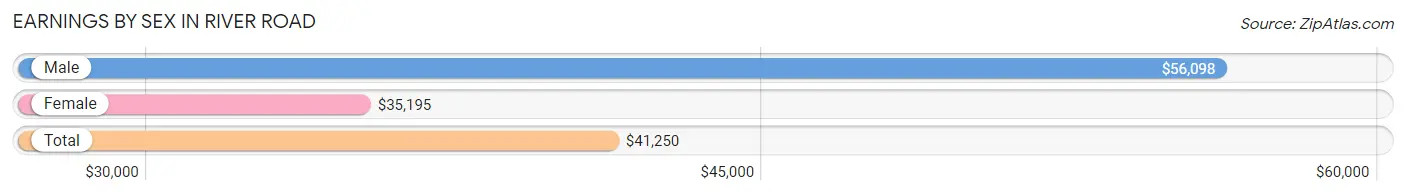
Earnings by Sex in River Road
Average Earnings in River Road are $41,250, $56,098 for men and $35,195 for women, a difference of 37.3%.
| Sex | Number | Average Earnings |
| Male | 175 (52.7%) | $56,098 |
| Female | 157 (47.3%) | $35,195 |
| Total | 332 (100.0%) | $41,250 |
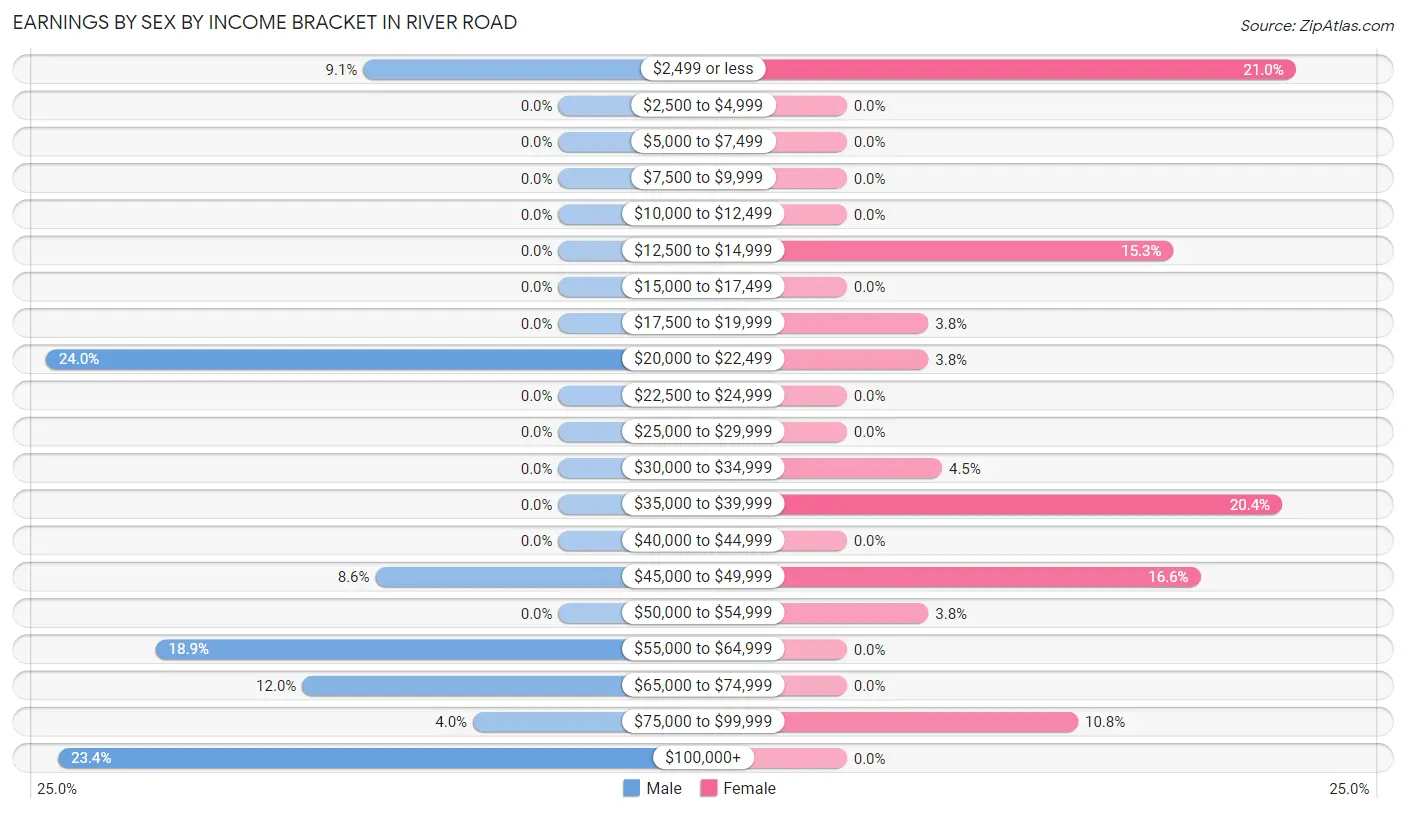
Earnings by Sex by Income Bracket in River Road
The most common earnings brackets in River Road are $20,000 to $22,499 for men (42 | 24.0%) and $2,499 or less for women (33 | 21.0%).
| Income | Male | Female |
| $2,499 or less | 16 (9.1%) | 33 (21.0%) |
| $2,500 to $4,999 | 0 (0.0%) | 0 (0.0%) |
| $5,000 to $7,499 | 0 (0.0%) | 0 (0.0%) |
| $7,500 to $9,999 | 0 (0.0%) | 0 (0.0%) |
| $10,000 to $12,499 | 0 (0.0%) | 0 (0.0%) |
| $12,500 to $14,999 | 0 (0.0%) | 24 (15.3%) |
| $15,000 to $17,499 | 0 (0.0%) | 0 (0.0%) |
| $17,500 to $19,999 | 0 (0.0%) | 6 (3.8%) |
| $20,000 to $22,499 | 42 (24.0%) | 6 (3.8%) |
| $22,500 to $24,999 | 0 (0.0%) | 0 (0.0%) |
| $25,000 to $29,999 | 0 (0.0%) | 0 (0.0%) |
| $30,000 to $34,999 | 0 (0.0%) | 7 (4.5%) |
| $35,000 to $39,999 | 0 (0.0%) | 32 (20.4%) |
| $40,000 to $44,999 | 0 (0.0%) | 0 (0.0%) |
| $45,000 to $49,999 | 15 (8.6%) | 26 (16.6%) |
| $50,000 to $54,999 | 0 (0.0%) | 6 (3.8%) |
| $55,000 to $64,999 | 33 (18.9%) | 0 (0.0%) |
| $65,000 to $74,999 | 21 (12.0%) | 0 (0.0%) |
| $75,000 to $99,999 | 7 (4.0%) | 17 (10.8%) |
| $100,000+ | 41 (23.4%) | 0 (0.0%) |
| Total | 175 (100.0%) | 157 (100.0%) |
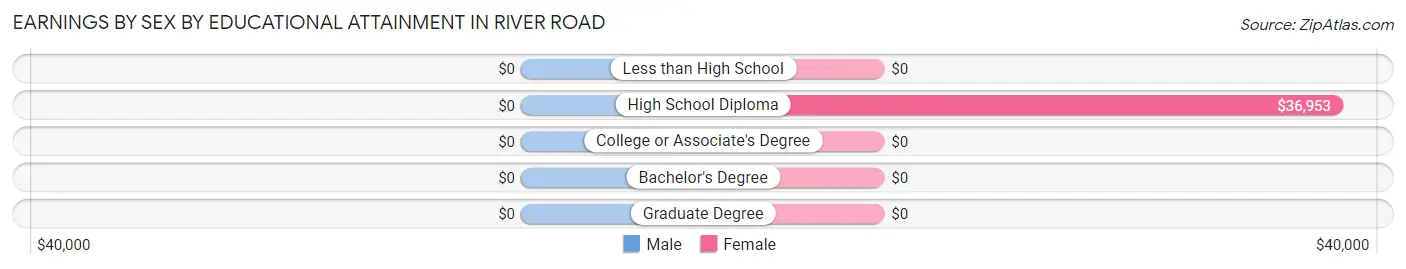
Earnings by Sex by Educational Attainment in River Road
| Educational Attainment | Male Income | Female Income |
| Less than High School | - | - |
| High School Diploma | - | - |
| College or Associate's Degree | - | - |
| Bachelor's Degree | - | - |
| Graduate Degree | - | - |
| Total | $65,298 | $35,195 |
Family Income in River Road
Family Income Brackets in River Road
According to the River Road family income data, there are 80 families falling into the $100,000 to $149,999 income range, which is the most common income bracket and makes up 36.2% of all families.
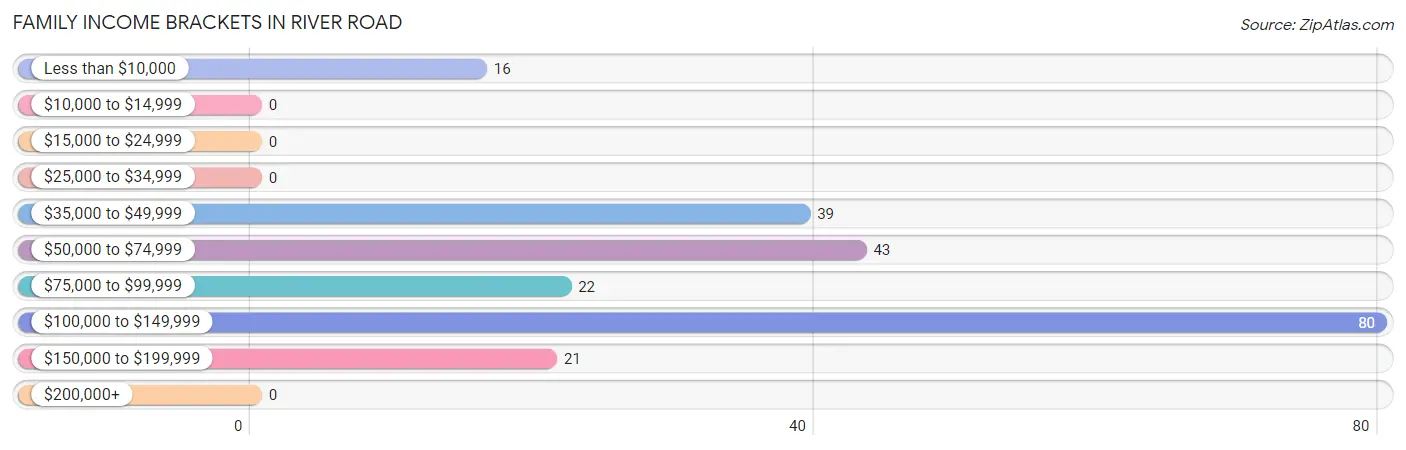
| Income Bracket | # Families | % Families |
| Less than $10,000 | 16 | 7.2% |
| $10,000 to $14,999 | 0 | 0.0% |
| $15,000 to $24,999 | 0 | 0.0% |
| $25,000 to $34,999 | 0 | 0.0% |
| $35,000 to $49,999 | 39 | 17.6% |
| $50,000 to $74,999 | 43 | 19.5% |
| $75,000 to $99,999 | 22 | 10.0% |
| $100,000 to $149,999 | 80 | 36.2% |
| $150,000 to $199,999 | 21 | 9.5% |
| $200,000+ | 0 | 0.0% |
Family Income by Famaliy Size in River Road
2-person families (71 | 32.1%) account for the highest median family income in River Road with $58,365 per family, while 2-person families (71 | 32.1%) have the highest median income of $29,182 per family member.
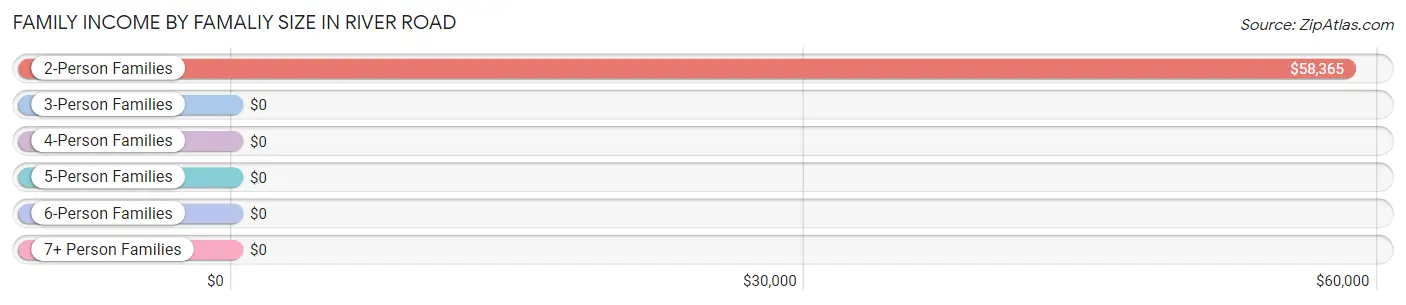
| Income Bracket | # Families | Median Income |
| 2-Person Families | 71 (32.1%) | $58,365 |
| 3-Person Families | 82 (37.1%) | $0 |
| 4-Person Families | 14 (6.3%) | $0 |
| 5-Person Families | 0 (0.0%) | $0 |
| 6-Person Families | 21 (9.5%) | $0 |
| 7+ Person Families | 33 (14.9%) | $0 |
| Total | 221 (100.0%) | $93,304 |
Family Income by Number of Earners in River Road
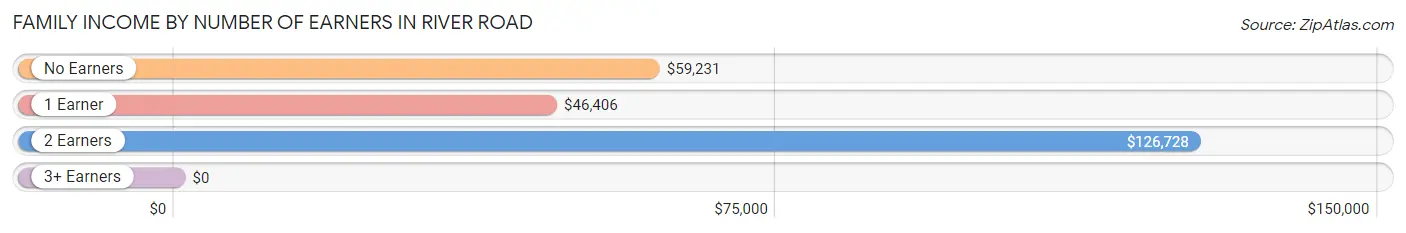
| Number of Earners | # Families | Median Income |
| No Earners | 48 (21.7%) | $59,231 |
| 1 Earner | 59 (26.7%) | $46,406 |
| 2 Earners | 87 (39.4%) | $126,728 |
| 3+ Earners | 27 (12.2%) | $0 |
| Total | 221 (100.0%) | $93,304 |
Household Income in River Road
Household Income Brackets in River Road
With 80 households falling in the category, the $100,000 to $149,999 income range is the most frequent in River Road, accounting for 36.2% of all households.
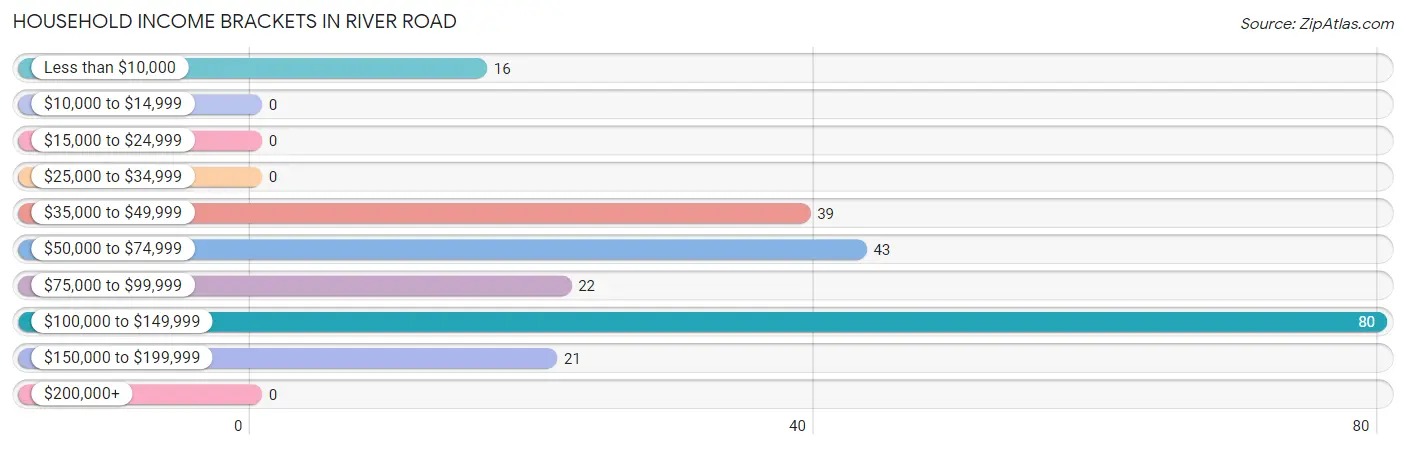
| Income Bracket | # Households | % Households |
| Less than $10,000 | 16 | 7.2% |
| $10,000 to $14,999 | 0 | 0.0% |
| $15,000 to $24,999 | 0 | 0.0% |
| $25,000 to $34,999 | 0 | 0.0% |
| $35,000 to $49,999 | 39 | 17.6% |
| $50,000 to $74,999 | 43 | 19.5% |
| $75,000 to $99,999 | 22 | 10.0% |
| $100,000 to $149,999 | 80 | 36.2% |
| $150,000 to $199,999 | 21 | 9.5% |
| $200,000+ | 0 | 0.0% |
Household Income by Householder Age in River Road
The median household income in River Road is $93,304, with the highest median household income of $113,750 found in the 65+ years age bracket for the primary householder. A total of 66 households (29.9%) fall into this category.
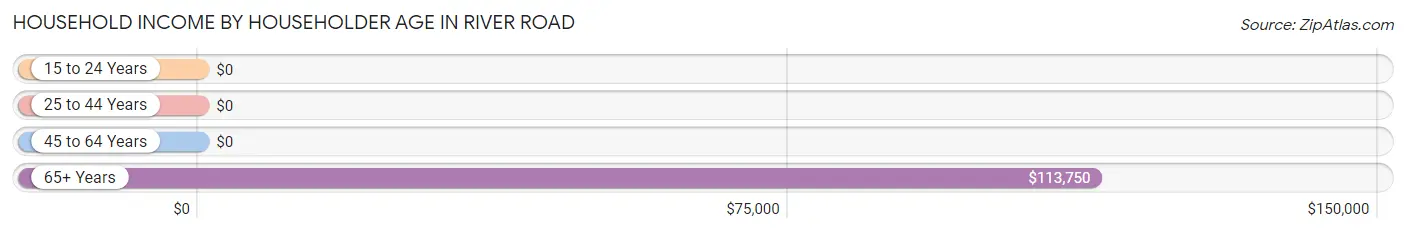
| Income Bracket | # Households | Median Income |
| 15 to 24 Years | 0 (0.0%) | $0 |
| 25 to 44 Years | 47 (21.3%) | $0 |
| 45 to 64 Years | 108 (48.9%) | $0 |
| 65+ Years | 66 (29.9%) | $113,750 |
| Total | 221 (100.0%) | $93,304 |
Poverty in River Road
Income Below Poverty by Sex and Age in River Road
With 3.5% poverty level for males and 3.5% for females among the residents of River Road, 55 to 64 year old males and 55 to 64 year old females are the most vulnerable to poverty, with 16 males (25.0%) and 12 females (9.5%) in their respective age groups living below the poverty level.
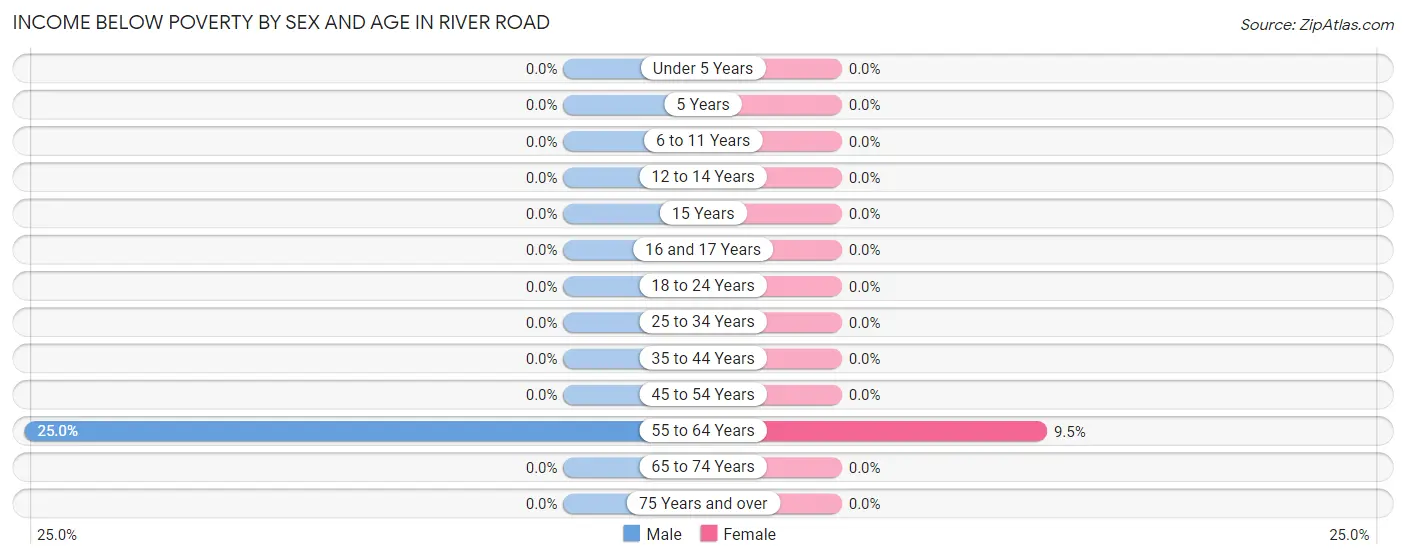
| Age Bracket | Male | Female |
| Under 5 Years | 0 (0.0%) | 0 (0.0%) |
| 5 Years | 0 (0.0%) | 0 (0.0%) |
| 6 to 11 Years | 0 (0.0%) | 0 (0.0%) |
| 12 to 14 Years | 0 (0.0%) | 0 (0.0%) |
| 15 Years | 0 (0.0%) | 0 (0.0%) |
| 16 and 17 Years | 0 (0.0%) | 0 (0.0%) |
| 18 to 24 Years | 0 (0.0%) | 0 (0.0%) |
| 25 to 34 Years | 0 (0.0%) | 0 (0.0%) |
| 35 to 44 Years | 0 (0.0%) | 0 (0.0%) |
| 45 to 54 Years | 0 (0.0%) | 0 (0.0%) |
| 55 to 64 Years | 16 (25.0%) | 12 (9.5%) |
| 65 to 74 Years | 0 (0.0%) | 0 (0.0%) |
| 75 Years and over | 0 (0.0%) | 0 (0.0%) |
| Total | 16 (3.5%) | 12 (3.5%) |
Income Above Poverty by Sex and Age in River Road
According to the poverty statistics in River Road, males aged under 5 years and females aged under 5 years are the age groups that are most secure financially, with 100.0% of males and 100.0% of females in these age groups living above the poverty line.
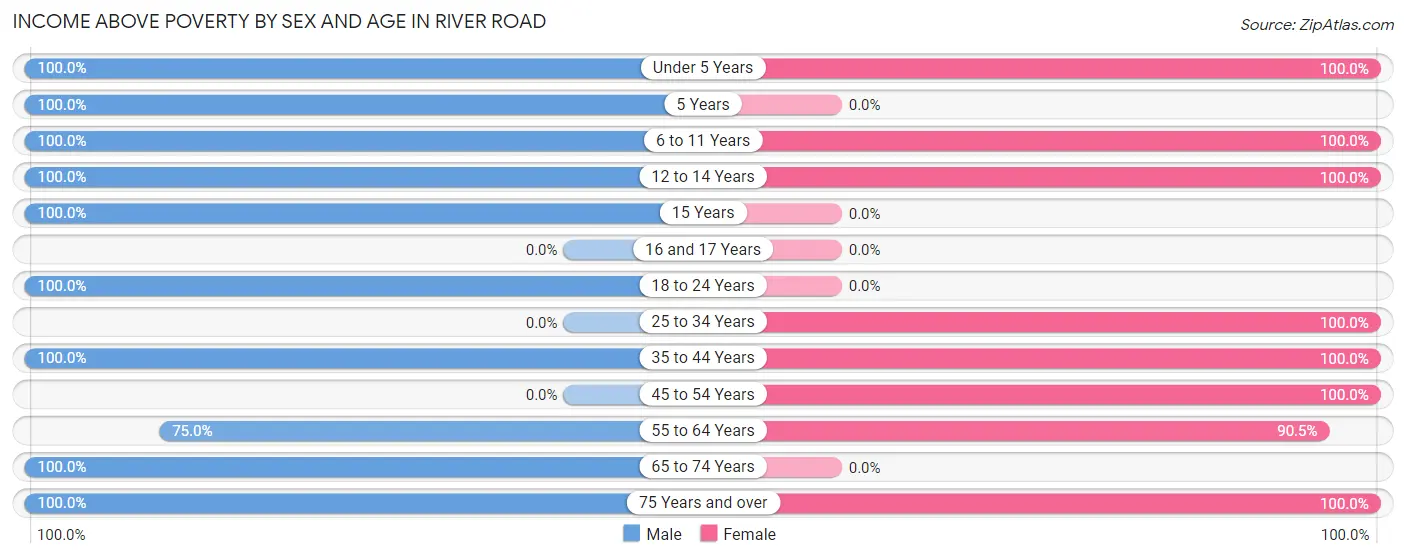
| Age Bracket | Male | Female |
| Under 5 Years | 17 (100.0%) | 8 (100.0%) |
| 5 Years | 32 (100.0%) | 0 (0.0%) |
| 6 to 11 Years | 24 (100.0%) | 25 (100.0%) |
| 12 to 14 Years | 50 (100.0%) | 31 (100.0%) |
| 15 Years | 22 (100.0%) | 0 (0.0%) |
| 16 and 17 Years | 0 (0.0%) | 0 (0.0%) |
| 18 to 24 Years | 42 (100.0%) | 0 (0.0%) |
| 25 to 34 Years | 0 (0.0%) | 18 (100.0%) |
| 35 to 44 Years | 69 (100.0%) | 70 (100.0%) |
| 45 to 54 Years | 0 (0.0%) | 33 (100.0%) |
| 55 to 64 Years | 48 (75.0%) | 114 (90.5%) |
| 65 to 74 Years | 69 (100.0%) | 0 (0.0%) |
| 75 Years and over | 66 (100.0%) | 34 (100.0%) |
| Total | 439 (96.5%) | 333 (96.5%) |
Income Below Poverty Among Married-Couple Families in River Road
The poverty statistics for married-couple families in River Road show that 9.4% or 16 of the total 170 families live below the poverty line. Families with no children have the highest poverty rate of 20.8%, comprising of 16 families. On the other hand, families with 1 or 2 children have the lowest poverty rate of 0.0%, which includes 0 families.
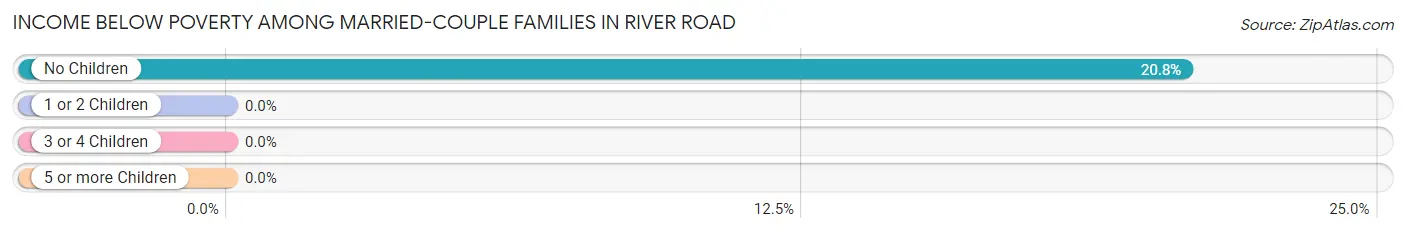
| Children | Above Poverty | Below Poverty |
| No Children | 61 (79.2%) | 16 (20.8%) |
| 1 or 2 Children | 93 (100.0%) | 0 (0.0%) |
| 3 or 4 Children | 0 (0.0%) | 0 (0.0%) |
| 5 or more Children | 0 (0.0%) | 0 (0.0%) |
| Total | 154 (90.6%) | 16 (9.4%) |
Income Below Poverty Among Single-Parent Households in River Road
| Children | Single Father | Single Mother |
| No Children | 0 (0.0%) | 0 (0.0%) |
| 1 or 2 Children | 0 (0.0%) | 0 (0.0%) |
| 3 or 4 Children | 0 (0.0%) | 0 (0.0%) |
| 5 or more Children | 0 (0.0%) | 0 (0.0%) |
| Total | 0 (0.0%) | 0 (0.0%) |
Income Below Poverty Among Married-Couple vs Single-Parent Households in River Road
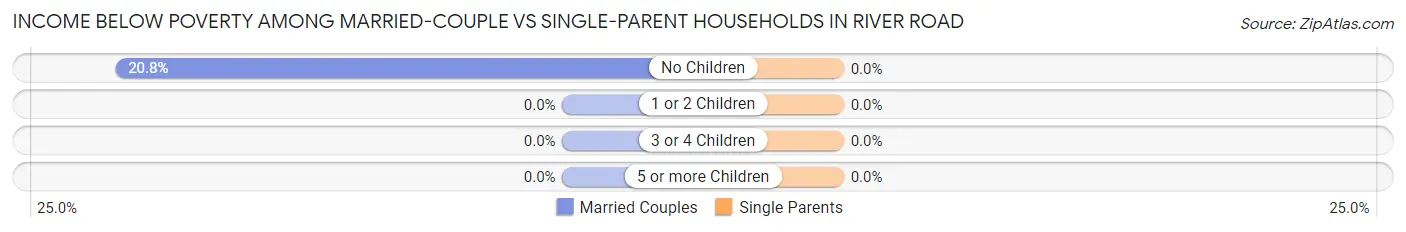
| Children | Married-Couple Families | Single-Parent Households |
| No Children | 16 (20.8%) | 0 (0.0%) |
| 1 or 2 Children | 0 (0.0%) | 0 (0.0%) |
| 3 or 4 Children | 0 (0.0%) | 0 (0.0%) |
| 5 or more Children | 0 (0.0%) | 0 (0.0%) |
| Total | 16 (9.4%) | 0 (0.0%) |
Race in River Road
The most populous races in River Road are White / Caucasian (659 | 82.4%), Two or more Races (129 | 16.1%), and Asian (12 | 1.5%).
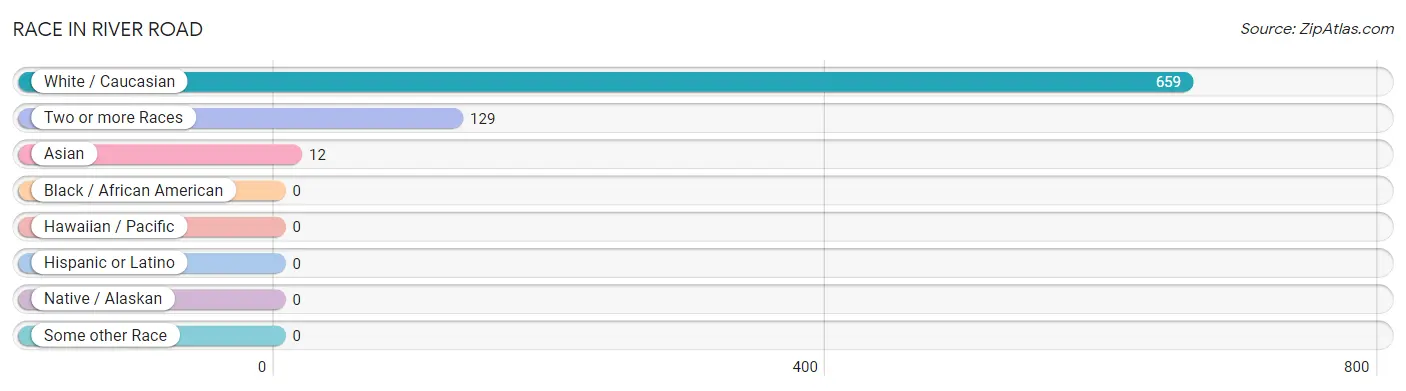
| Race | # Population | % Population |
| Asian | 12 | 1.5% |
| Black / African American | 0 | 0.0% |
| Hawaiian / Pacific | 0 | 0.0% |
| Hispanic or Latino | 0 | 0.0% |
| Native / Alaskan | 0 | 0.0% |
| White / Caucasian | 659 | 82.4% |
| Two or more Races | 129 | 16.1% |
| Some other Race | 0 | 0.0% |
| Total | 800 | 100.0% |
Ancestry in River Road
The most populous ancestries reported in River Road are German (100 | 12.5%), English (75 | 9.4%), Italian (31 | 3.9%), Norwegian (24 | 3.0%), and Swedish (24 | 3.0%), together accounting for 31.8% of all River Road residents.
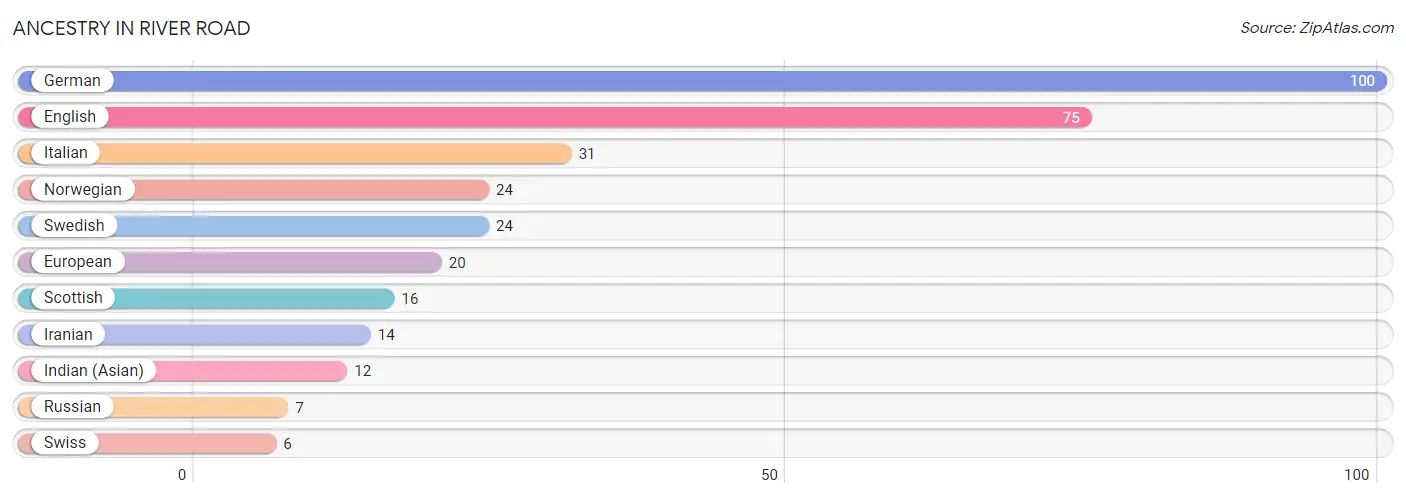
| Ancestry | # Population | % Population |
| English | 75 | 9.4% |
| European | 20 | 2.5% |
| German | 100 | 12.5% |
| Indian (Asian) | 12 | 1.5% |
| Iranian | 14 | 1.8% |
| Italian | 31 | 3.9% |
| Norwegian | 24 | 3.0% |
| Russian | 7 | 0.9% |
| Scottish | 16 | 2.0% |
| Swedish | 24 | 3.0% |
| Swiss | 6 | 0.7% | View All 11 Rows |
Immigrants in River Road
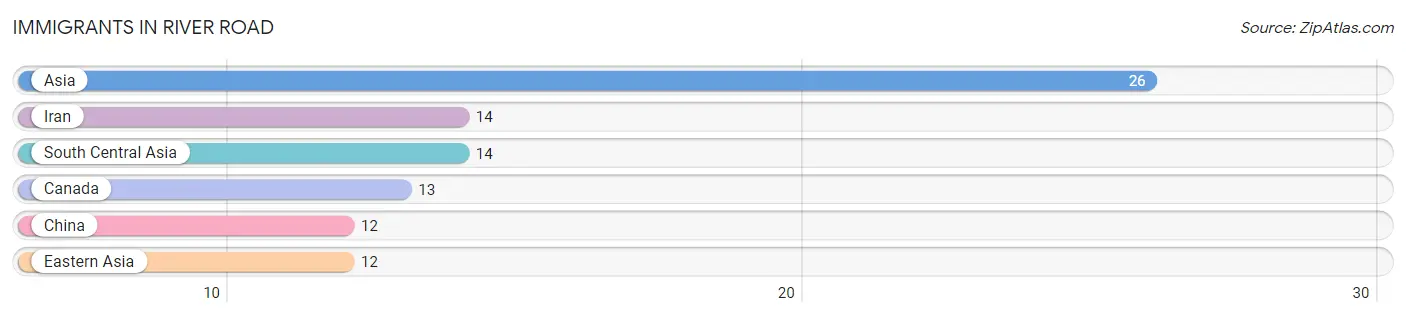
The most numerous immigrant groups reported in River Road came from Asia (26 | 3.3%), Iran (14 | 1.8%), South Central Asia (14 | 1.8%), Canada (13 | 1.6%), and China (12 | 1.5%), together accounting for 9.9% of all River Road residents.
| Immigration Origin | # Population | % Population |
| Asia | 26 | 3.3% |
| Canada | 13 | 1.6% |
| China | 12 | 1.5% |
| Eastern Asia | 12 | 1.5% |
| Iran | 14 | 1.8% |
| South Central Asia | 14 | 1.8% | View All 6 Rows |
Sex and Age in River Road
Sex and Age in River Road
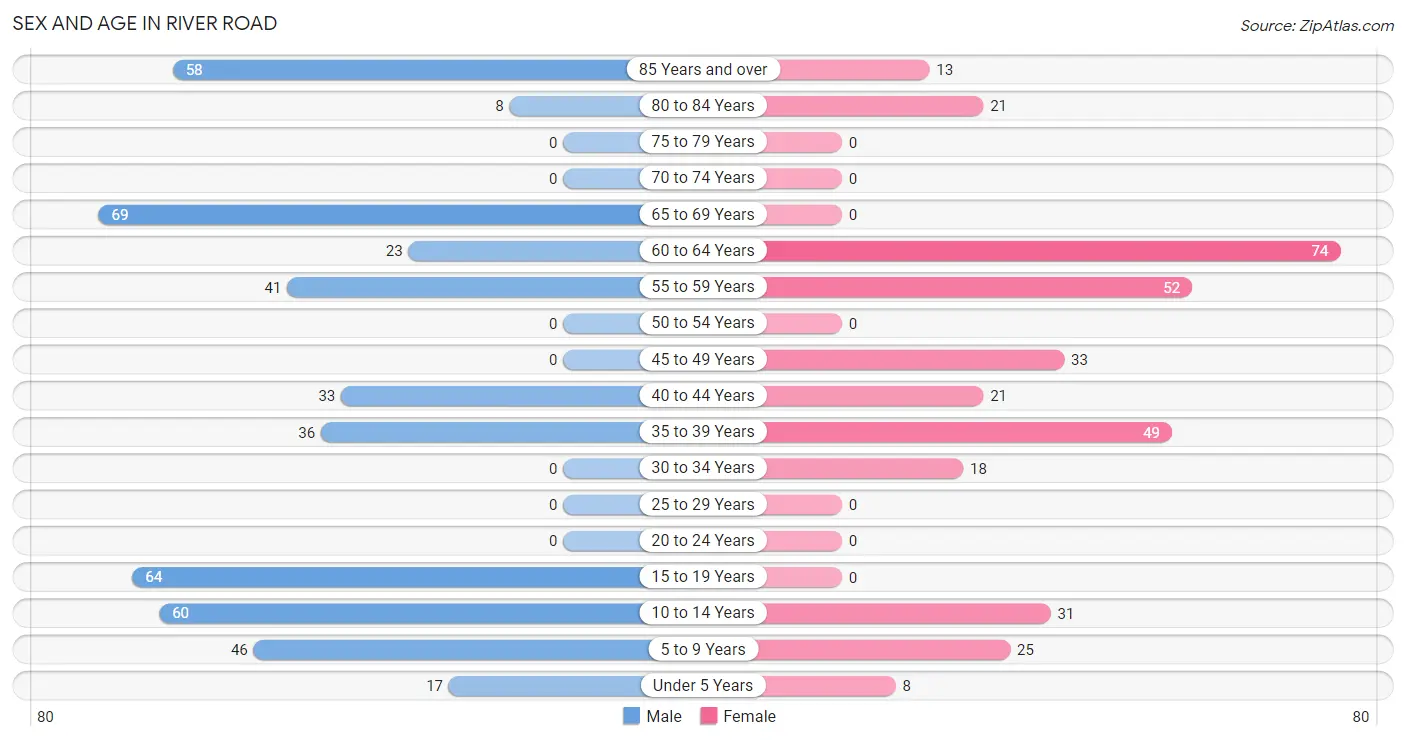
The most populous age groups in River Road are 65 to 69 Years (69 | 15.2%) for men and 60 to 64 Years (74 | 21.4%) for women.
| Age Bracket | Male | Female |
| Under 5 Years | 17 (3.7%) | 8 (2.3%) |
| 5 to 9 Years | 46 (10.1%) | 25 (7.2%) |
| 10 to 14 Years | 60 (13.2%) | 31 (9.0%) |
| 15 to 19 Years | 64 (14.1%) | 0 (0.0%) |
| 20 to 24 Years | 0 (0.0%) | 0 (0.0%) |
| 25 to 29 Years | 0 (0.0%) | 0 (0.0%) |
| 30 to 34 Years | 0 (0.0%) | 18 (5.2%) |
| 35 to 39 Years | 36 (7.9%) | 49 (14.2%) |
| 40 to 44 Years | 33 (7.2%) | 21 (6.1%) |
| 45 to 49 Years | 0 (0.0%) | 33 (9.6%) |
| 50 to 54 Years | 0 (0.0%) | 0 (0.0%) |
| 55 to 59 Years | 41 (9.0%) | 52 (15.1%) |
| 60 to 64 Years | 23 (5.1%) | 74 (21.4%) |
| 65 to 69 Years | 69 (15.2%) | 0 (0.0%) |
| 70 to 74 Years | 0 (0.0%) | 0 (0.0%) |
| 75 to 79 Years | 0 (0.0%) | 0 (0.0%) |
| 80 to 84 Years | 8 (1.8%) | 21 (6.1%) |
| 85 Years and over | 58 (12.8%) | 13 (3.8%) |
| Total | 455 (100.0%) | 345 (100.0%) |
Families and Households in River Road
Median Family Size in River Road
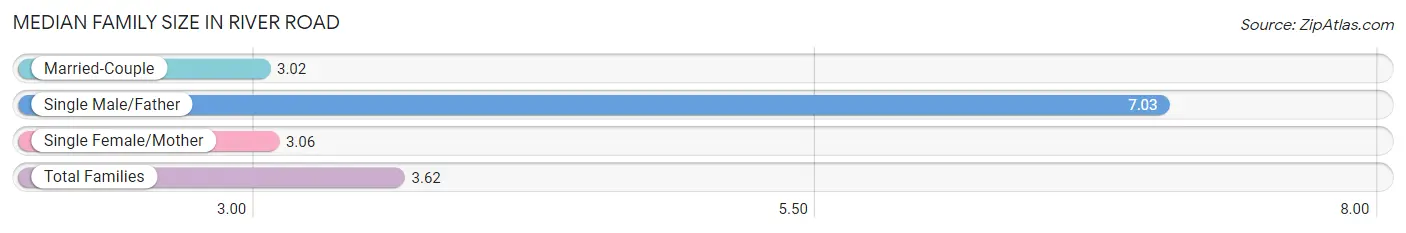
The median family size in River Road is 3.62 persons per family, with single male/father families (33 | 14.9%) accounting for the largest median family size of 7.03 persons per family. On the other hand, married-couple families (170 | 76.9%) represent the smallest median family size with 3.02 persons per family.
| Family Type | # Families | Family Size |
| Married-Couple | 170 (76.9%) | 3.02 |
| Single Male/Father | 33 (14.9%) | 7.03 |
| Single Female/Mother | 18 (8.1%) | 3.06 |
| Total Families | 221 (100.0%) | 3.62 |
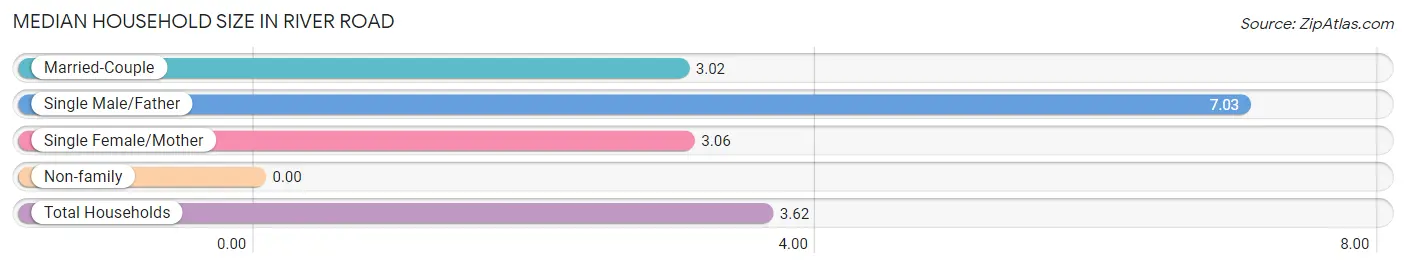
Median Household Size in River Road
| Household Type | # Households | Household Size |
| Married-Couple | 170 (76.9%) | 3.02 |
| Single Male/Father | 33 (14.9%) | 7.03 |
| Single Female/Mother | 18 (8.1%) | 3.06 |
| Non-family | 0 (0.0%) | - |
| Total Households | 221 (100.0%) | 3.62 |
Household Size by Marriage Status in River Road
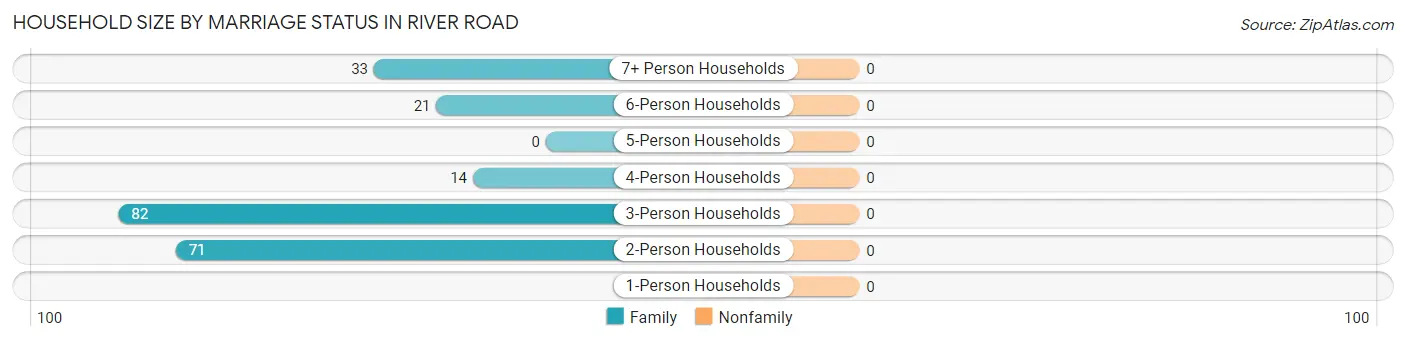
| Household Size | Family Households | Nonfamily Households |
| 1-Person Households | - | 0 (0.0%) |
| 2-Person Households | 71 (32.1%) | 0 (0.0%) |
| 3-Person Households | 82 (37.1%) | 0 (0.0%) |
| 4-Person Households | 14 (6.3%) | 0 (0.0%) |
| 5-Person Households | 0 (0.0%) | 0 (0.0%) |
| 6-Person Households | 21 (9.5%) | 0 (0.0%) |
| 7+ Person Households | 33 (14.9%) | 0 (0.0%) |
| Total | 221 (100.0%) | 0 (0.0%) |
Female Fertility in River Road
Fertility by Age in River Road
| Age Bracket | Women with Births | Births / 1,000 Women |
| 15 to 19 years | 0 (0.0%) | 0.0 |
| 20 to 34 years | 0 (0.0%) | 0.0 |
| 35 to 50 years | 0 (0.0%) | 0.0 |
| Total | 0 (0.0%) | 0.0 |
Fertility by Age by Marriage Status in River Road
| Age Bracket | Married | Unmarried |
| 15 to 19 years | 0 (0.0%) | 0 (0.0%) |
| 20 to 34 years | 0 (0.0%) | 0 (0.0%) |
| 35 to 50 years | 0 (0.0%) | 0 (0.0%) |
| Total | 0 (0.0%) | 0 (0.0%) |
Fertility by Education in River Road
| Educational Attainment | Women with Births | Births / 1,000 Women |
| Less than High School | 0 (0.0%) | 0.0 |
| High School Diploma | 0 (0.0%) | 0.0 |
| College or Associate's Degree | 0 (0.0%) | 0.0 |
| Bachelor's Degree | 0 (0.0%) | 0.0 |
| Graduate Degree | 0 (0.0%) | 0.0 |
| Total | 0 (0.0%) | 0.0 |
Fertility by Education by Marriage Status in River Road
| Educational Attainment | Married | Unmarried |
| Less than High School | 0 (0.0%) | 0 (0.0%) |
| High School Diploma | 0 (0.0%) | 0 (0.0%) |
| College or Associate's Degree | 0 (0.0%) | 0 (0.0%) |
| Bachelor's Degree | 0 (0.0%) | 0 (0.0%) |
| Graduate Degree | 0 (0.0%) | 0 (0.0%) |
| Total | 0 (0.0%) | 0 (0.0%) |
Employment Characteristics in River Road
Employment by Class of Employer in River Road
Among the 282 employed individuals in River Road, not-for-profit organizations (98 | 34.7%), private company employees (79 | 28.0%), and local government employees (76 | 27.0%) make up the most common classes of employment.
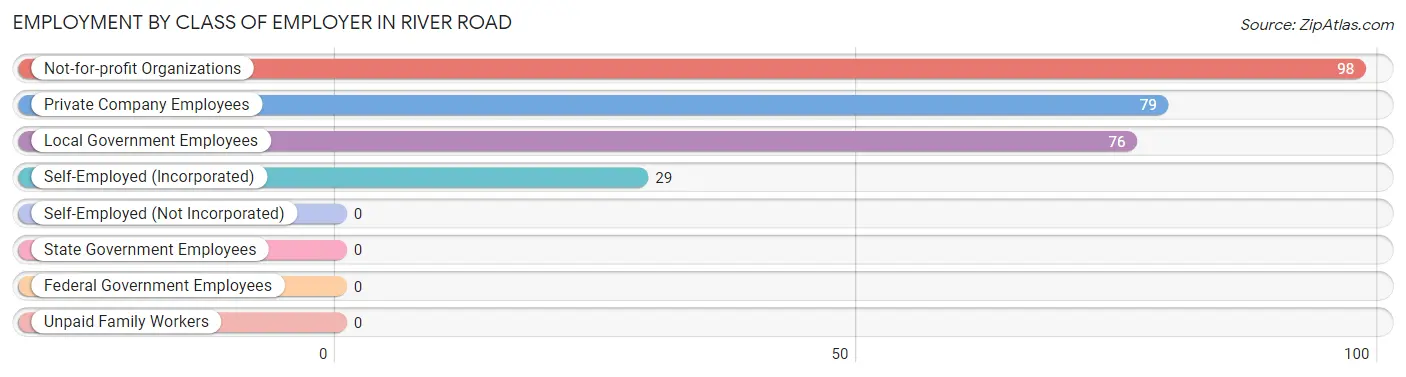
| Employer Class | # Employees | % Employees |
| Private Company Employees | 79 | 28.0% |
| Self-Employed (Incorporated) | 29 | 10.3% |
| Self-Employed (Not Incorporated) | 0 | 0.0% |
| Not-for-profit Organizations | 98 | 34.7% |
| Local Government Employees | 76 | 27.0% |
| State Government Employees | 0 | 0.0% |
| Federal Government Employees | 0 | 0.0% |
| Unpaid Family Workers | 0 | 0.0% |
| Total | 282 | 100.0% |
Employment Status by Age in River Road
According to the labor force statistics for River Road, out of the total population over 16 years of age (591), 53.5% or 316 individuals are in the labor force, with 10.8% or 34 of them unemployed. The age group with the highest labor force participation rate is 16 to 19 years, with 100.0% or 42 individuals in the labor force. Within the labor force, the 55 to 59 years age range has the highest percentage of unemployed individuals, with 72.3% or 34 of them being unemployed.
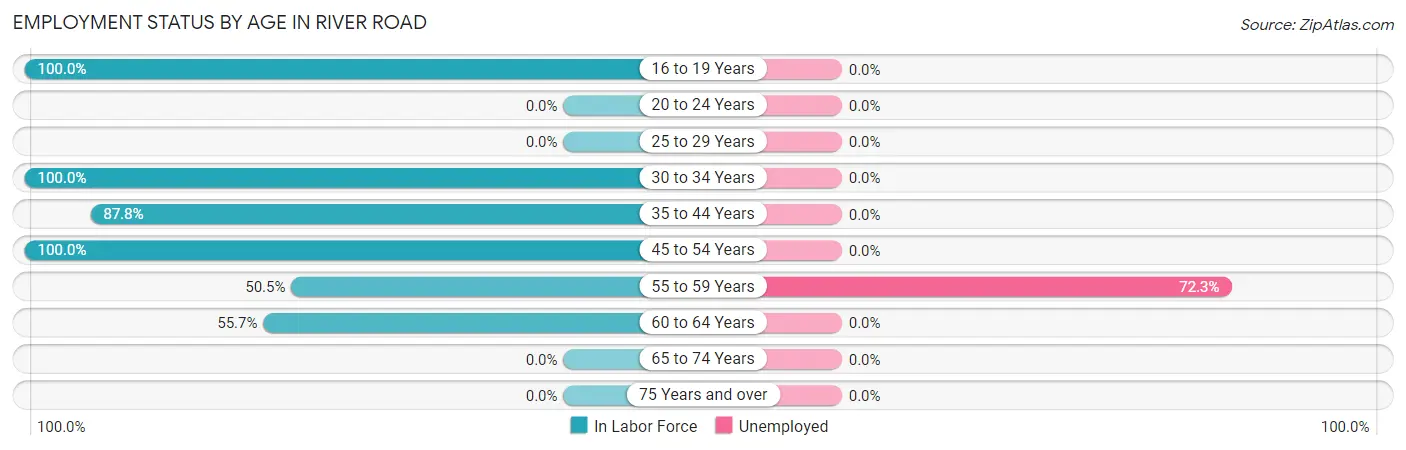
| Age Bracket | In Labor Force | Unemployed |
| 16 to 19 Years | 42 (100.0%) | 0 (0.0%) |
| 20 to 24 Years | 0 (0.0%) | 0 (0.0%) |
| 25 to 29 Years | 0 (0.0%) | 0 (0.0%) |
| 30 to 34 Years | 18 (100.0%) | 0 (0.0%) |
| 35 to 44 Years | 122 (87.8%) | 0 (0.0%) |
| 45 to 54 Years | 33 (100.0%) | 0 (0.0%) |
| 55 to 59 Years | 47 (50.5%) | 34 (72.3%) |
| 60 to 64 Years | 54 (55.7%) | 0 (0.0%) |
| 65 to 74 Years | 0 (0.0%) | 0 (0.0%) |
| 75 Years and over | 0 (0.0%) | 0 (0.0%) |
| Total | 316 (53.5%) | 34 (10.8%) |
Employment Status by Educational Attainment in River Road
According to labor force statistics for River Road, 72.1% of individuals (274) out of the total population between 25 and 64 years of age (380) are in the labor force, with 12.4% or 34 of them being unemployed. The group with the highest labor force participation rate are those with the educational attainment of high school diploma, with 90.7% or 98 individuals in the labor force. Within the labor force, individuals with college / associate degree education have the highest percentage of unemployment, with 23.9% or 34 of them being unemployed.
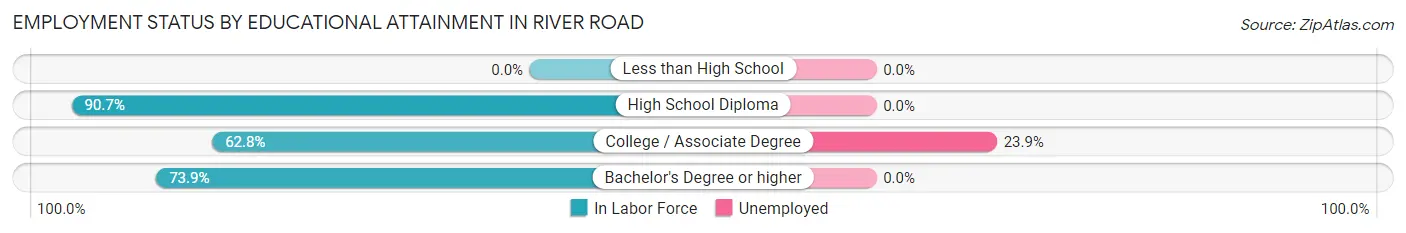
| Educational Attainment | In Labor Force | Unemployed |
| Less than High School | 0 (0.0%) | 0 (0.0%) |
| High School Diploma | 98 (90.7%) | 0 (0.0%) |
| College / Associate Degree | 142 (62.8%) | 54 (23.9%) |
| Bachelor's Degree or higher | 34 (73.9%) | 0 (0.0%) |
| Total | 274 (72.1%) | 47 (12.4%) |
Employment Occupations by Sex in River Road
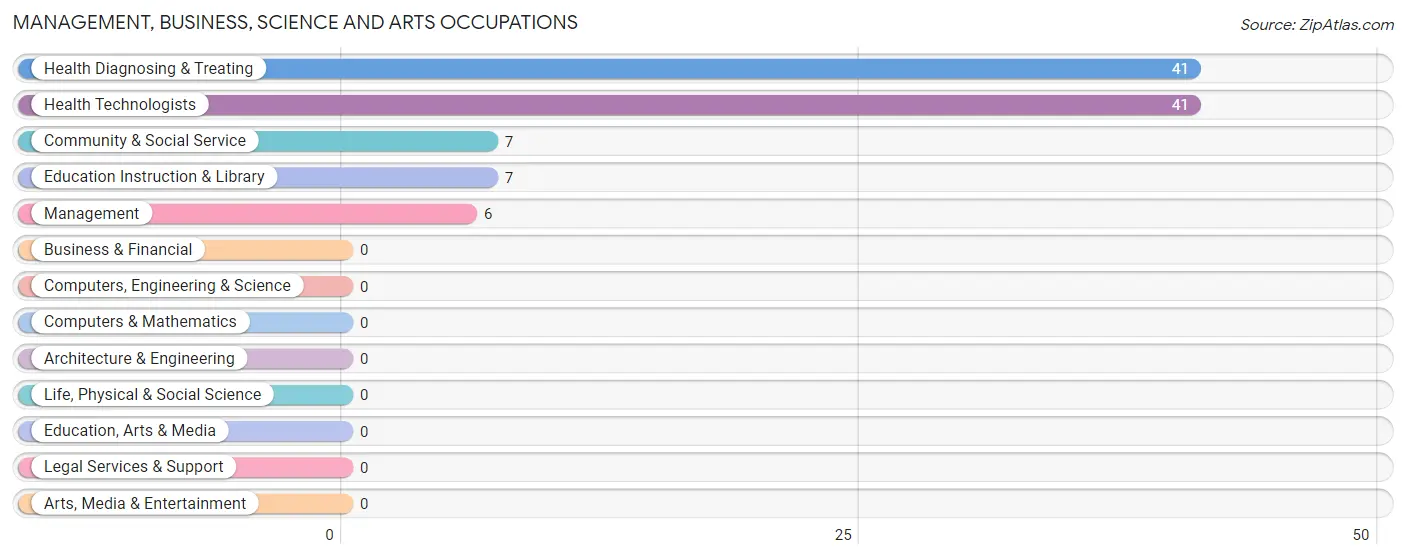
Management, Business, Science and Arts Occupations
The most common Management, Business, Science and Arts occupations in River Road are Health Diagnosing & Treating (41 | 14.5%), Health Technologists (41 | 14.5%), Community & Social Service (7 | 2.5%), Education Instruction & Library (7 | 2.5%), and Management (6 | 2.1%).
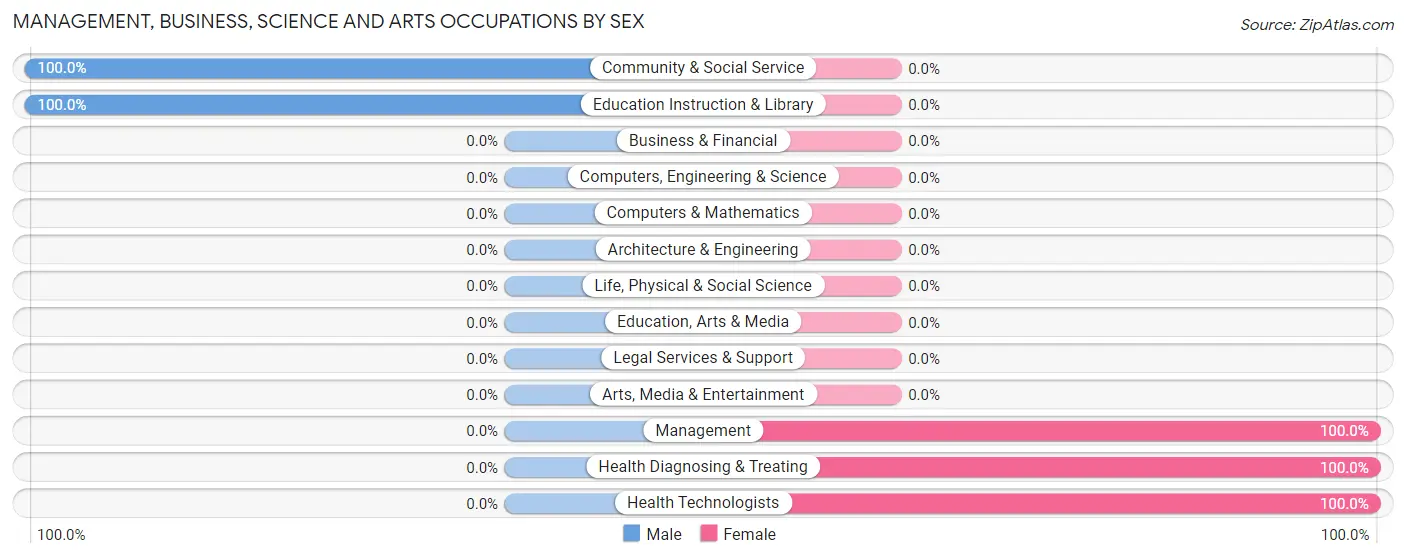
Management, Business, Science and Arts Occupations by Sex
Within the Management, Business, Science and Arts occupations in River Road, the most male-oriented occupations are Community & Social Service (100.0%), and Education Instruction & Library (100.0%), while the most female-oriented occupations are Management (100.0%), Health Diagnosing & Treating (100.0%), and Health Technologists (100.0%).
| Occupation | Male | Female |
| Management | 0 (0.0%) | 6 (100.0%) |
| Business & Financial | 0 (0.0%) | 0 (0.0%) |
| Computers, Engineering & Science | 0 (0.0%) | 0 (0.0%) |
| Computers & Mathematics | 0 (0.0%) | 0 (0.0%) |
| Architecture & Engineering | 0 (0.0%) | 0 (0.0%) |
| Life, Physical & Social Science | 0 (0.0%) | 0 (0.0%) |
| Community & Social Service | 7 (100.0%) | 0 (0.0%) |
| Education, Arts & Media | 0 (0.0%) | 0 (0.0%) |
| Legal Services & Support | 0 (0.0%) | 0 (0.0%) |
| Education Instruction & Library | 7 (100.0%) | 0 (0.0%) |
| Arts, Media & Entertainment | 0 (0.0%) | 0 (0.0%) |
| Health Diagnosing & Treating | 0 (0.0%) | 41 (100.0%) |
| Health Technologists | 0 (0.0%) | 41 (100.0%) |
| Total (Category) | 7 (13.0%) | 47 (87.0%) |
| Total (Overall) | 125 (44.3%) | 157 (55.7%) |
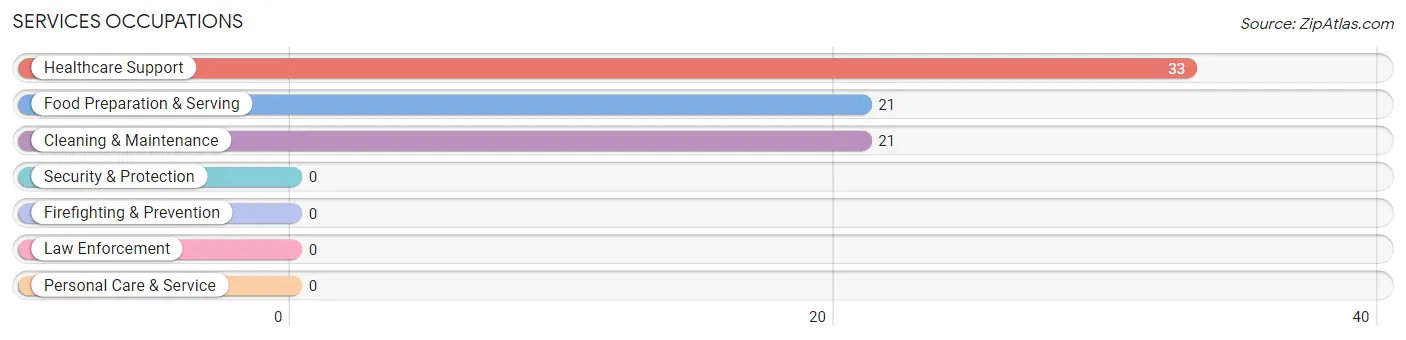
Services Occupations
The most common Services occupations in River Road are Healthcare Support (33 | 11.7%), Food Preparation & Serving (21 | 7.4%), and Cleaning & Maintenance (21 | 7.4%).
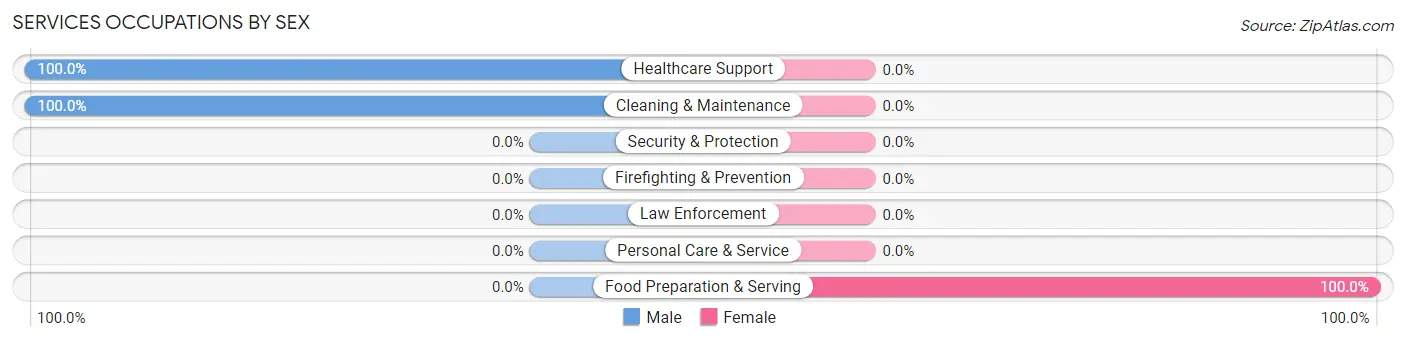
Services Occupations by Sex
| Occupation | Male | Female |
| Healthcare Support | 33 (100.0%) | 0 (0.0%) |
| Security & Protection | 0 (0.0%) | 0 (0.0%) |
| Firefighting & Prevention | 0 (0.0%) | 0 (0.0%) |
| Law Enforcement | 0 (0.0%) | 0 (0.0%) |
| Food Preparation & Serving | 0 (0.0%) | 21 (100.0%) |
| Cleaning & Maintenance | 21 (100.0%) | 0 (0.0%) |
| Personal Care & Service | 0 (0.0%) | 0 (0.0%) |
| Total (Category) | 54 (72.0%) | 21 (28.0%) |
| Total (Overall) | 125 (44.3%) | 157 (55.7%) |
Sales and Office Occupations
The most common Sales and Office occupations in River Road are Office & Administration (50 | 17.7%), and Sales & Related (6 | 2.1%).
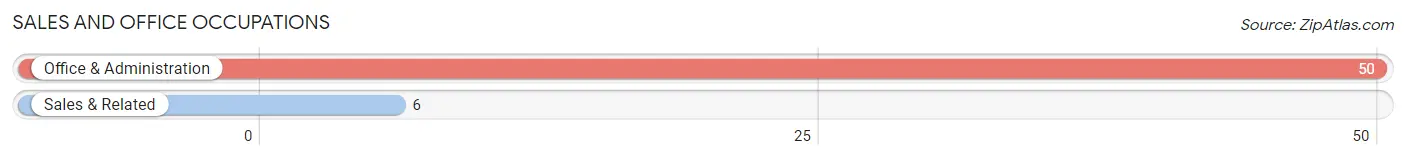
Sales and Office Occupations by Sex
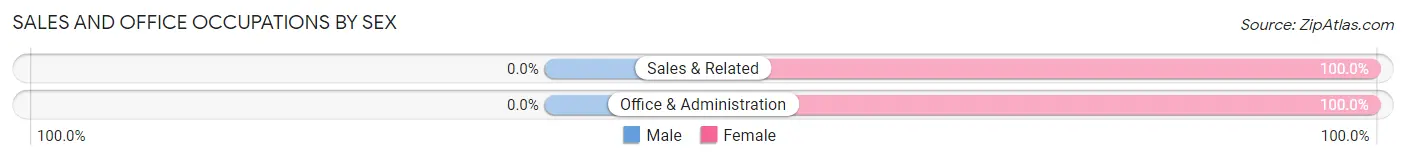
| Occupation | Male | Female |
| Sales & Related | 0 (0.0%) | 6 (100.0%) |
| Office & Administration | 0 (0.0%) | 50 (100.0%) |
| Total (Category) | 0 (0.0%) | 56 (100.0%) |
| Total (Overall) | 125 (44.3%) | 157 (55.7%) |
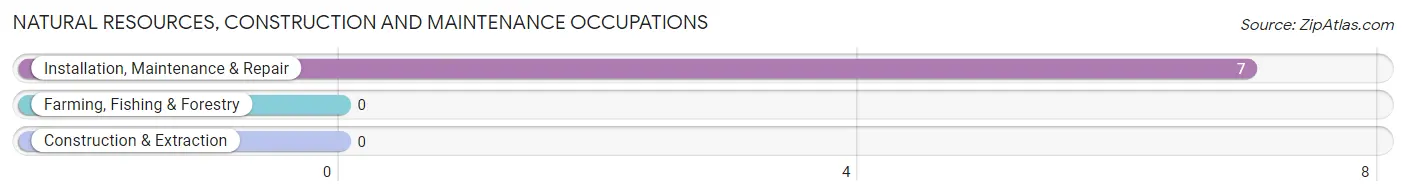
Natural Resources, Construction and Maintenance Occupations
The most common Natural Resources, Construction and Maintenance occupations in River Road are , and Installation, Maintenance & Repair (7 | 2.5%).
Natural Resources, Construction and Maintenance Occupations by Sex
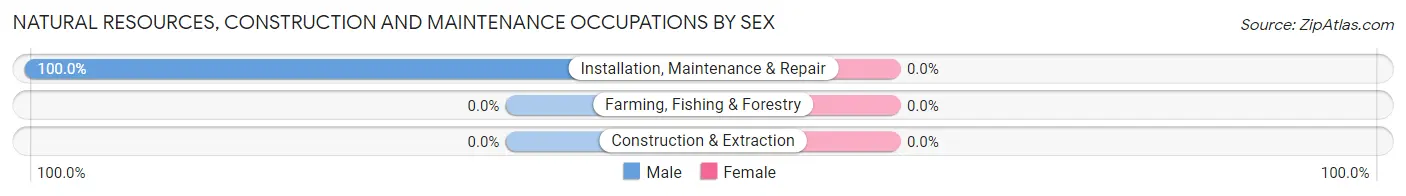
| Occupation | Male | Female |
| Farming, Fishing & Forestry | 0 (0.0%) | 0 (0.0%) |
| Construction & Extraction | 0 (0.0%) | 0 (0.0%) |
| Installation, Maintenance & Repair | 7 (100.0%) | 0 (0.0%) |
| Total (Category) | 7 (100.0%) | 0 (0.0%) |
| Total (Overall) | 125 (44.3%) | 157 (55.7%) |
Production, Transportation and Moving Occupations
The most common Production, Transportation and Moving occupations in River Road are Transportation (48 | 17.0%), and Production (42 | 14.9%).
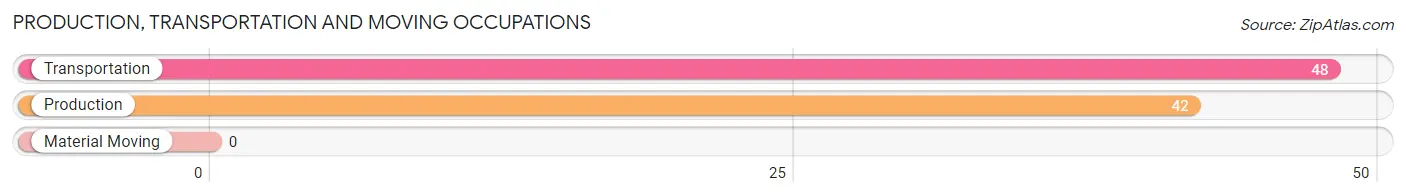
Production, Transportation and Moving Occupations by Sex
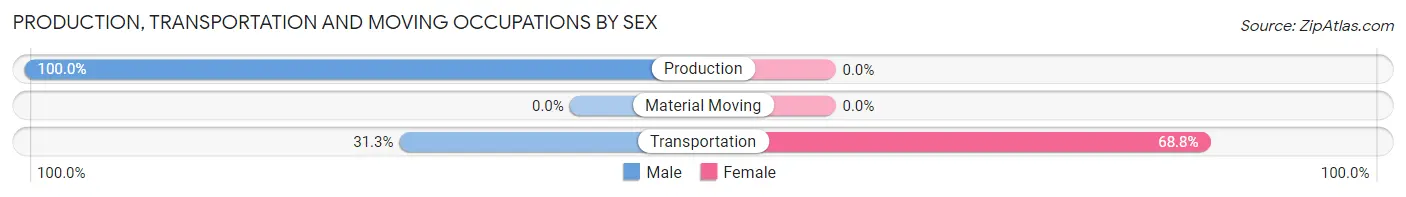
| Occupation | Male | Female |
| Production | 42 (100.0%) | 0 (0.0%) |
| Transportation | 15 (31.2%) | 33 (68.8%) |
| Material Moving | 0 (0.0%) | 0 (0.0%) |
| Total (Category) | 57 (63.3%) | 33 (36.7%) |
| Total (Overall) | 125 (44.3%) | 157 (55.7%) |
Employment Industries by Sex in River Road
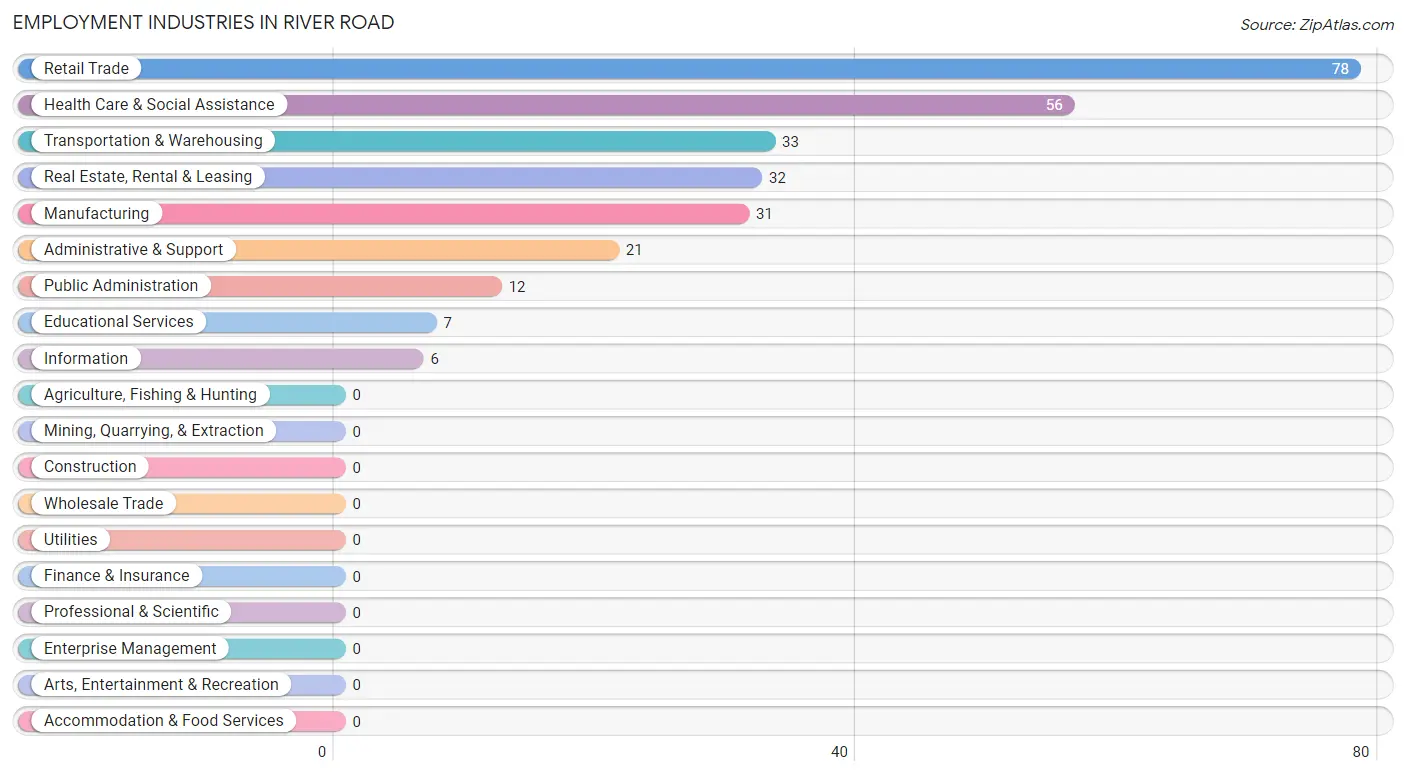
Employment Industries in River Road
The major employment industries in River Road include Retail Trade (78 | 27.7%), Health Care & Social Assistance (56 | 19.9%), Transportation & Warehousing (33 | 11.7%), Real Estate, Rental & Leasing (32 | 11.4%), and Manufacturing (31 | 11.0%).
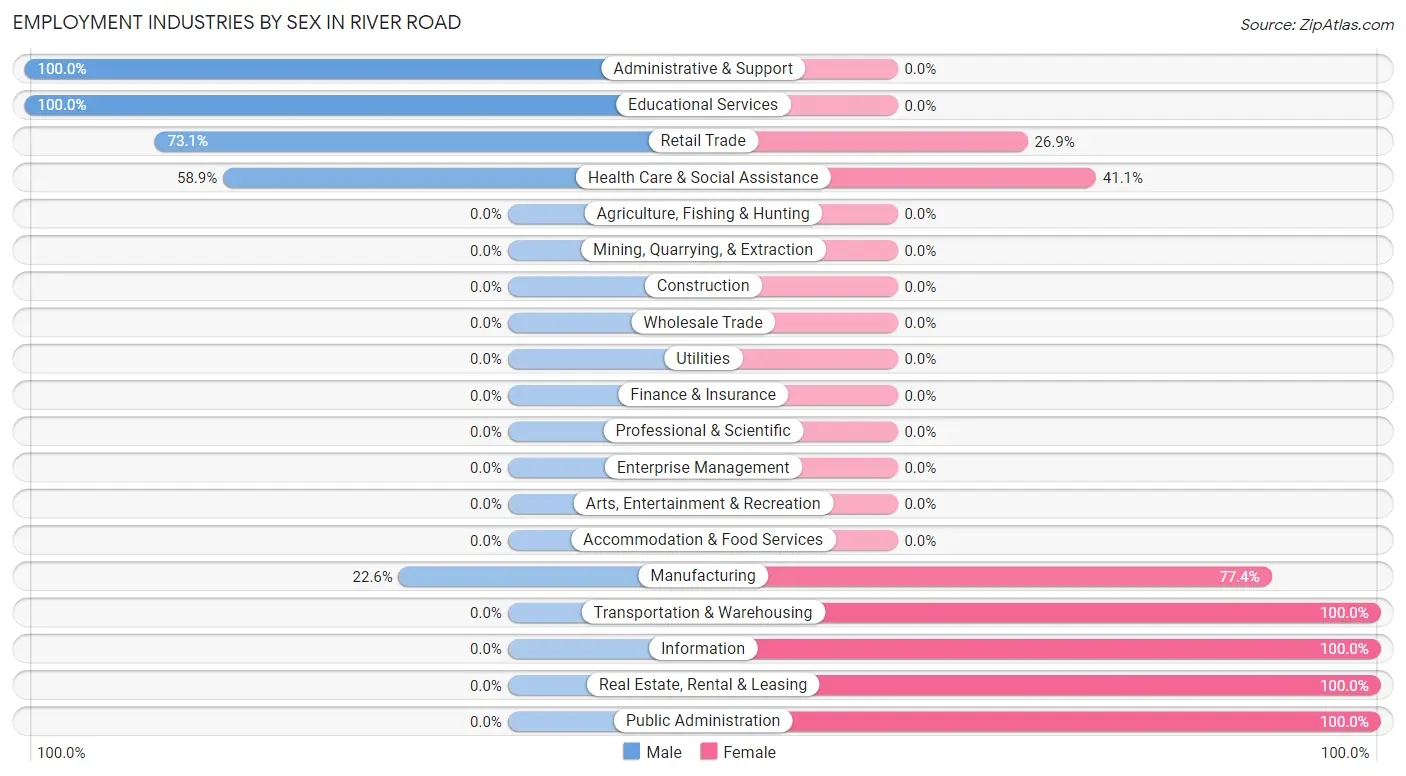
Employment Industries by Sex in River Road
The River Road industries that see more men than women are Administrative & Support (100.0%), Educational Services (100.0%), and Retail Trade (73.1%), whereas the industries that tend to have a higher number of women are Transportation & Warehousing (100.0%), Information (100.0%), and Real Estate, Rental & Leasing (100.0%).
| Industry | Male | Female |
| Agriculture, Fishing & Hunting | 0 (0.0%) | 0 (0.0%) |
| Mining, Quarrying, & Extraction | 0 (0.0%) | 0 (0.0%) |
| Construction | 0 (0.0%) | 0 (0.0%) |
| Manufacturing | 7 (22.6%) | 24 (77.4%) |
| Wholesale Trade | 0 (0.0%) | 0 (0.0%) |
| Retail Trade | 57 (73.1%) | 21 (26.9%) |
| Transportation & Warehousing | 0 (0.0%) | 33 (100.0%) |
| Utilities | 0 (0.0%) | 0 (0.0%) |
| Information | 0 (0.0%) | 6 (100.0%) |
| Finance & Insurance | 0 (0.0%) | 0 (0.0%) |
| Real Estate, Rental & Leasing | 0 (0.0%) | 32 (100.0%) |
| Professional & Scientific | 0 (0.0%) | 0 (0.0%) |
| Enterprise Management | 0 (0.0%) | 0 (0.0%) |
| Administrative & Support | 21 (100.0%) | 0 (0.0%) |
| Educational Services | 7 (100.0%) | 0 (0.0%) |
| Health Care & Social Assistance | 33 (58.9%) | 23 (41.1%) |
| Arts, Entertainment & Recreation | 0 (0.0%) | 0 (0.0%) |
| Accommodation & Food Services | 0 (0.0%) | 0 (0.0%) |
| Public Administration | 0 (0.0%) | 12 (100.0%) |
| Total | 125 (44.3%) | 157 (55.7%) |
Education in River Road
School Enrollment in River Road
The most common levels of schooling among the 134 students in River Road are middle school (60 | 44.8%), kindergarten (32 | 23.9%), and high school (22 | 16.4%).
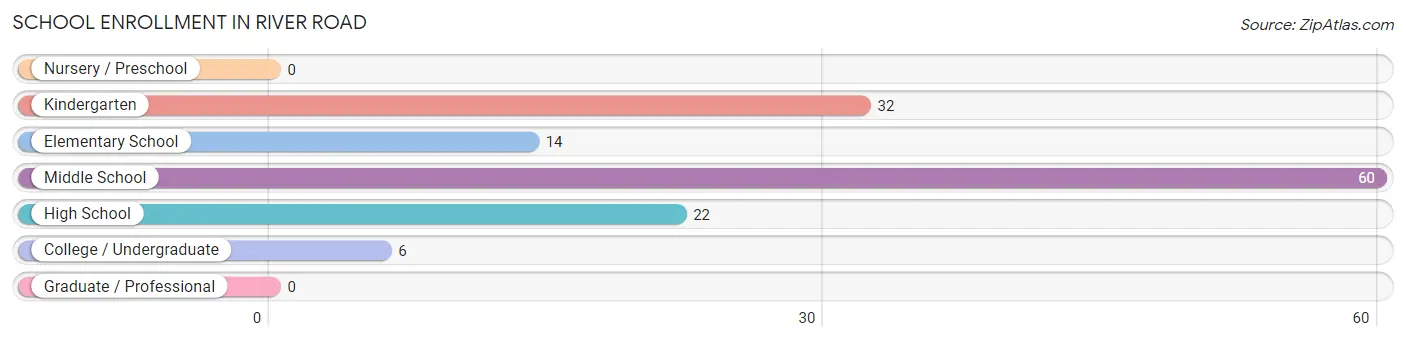
| School Level | # Students | % Students |
| Nursery / Preschool | 0 | 0.0% |
| Kindergarten | 32 | 23.9% |
| Elementary School | 14 | 10.4% |
| Middle School | 60 | 44.8% |
| High School | 22 | 16.4% |
| College / Undergraduate | 6 | 4.5% |
| Graduate / Professional | 0 | 0.0% |
| Total | 134 | 100.0% |
School Enrollment by Age by Funding Source in River Road
Out of a total of 134 students who are enrolled in schools in River Road, 36 (26.9%) attend a private institution, while the remaining 98 (73.1%) are enrolled in public schools. The age group of 15 to 17 year olds has the highest likelihood of being enrolled in private schools, with 22 (100.0% in the age bracket) enrolled. Conversely, the age group of 10 to 14 year olds has the lowest likelihood of being enrolled in a private school, with 60 (100.0% in the age bracket) attending a public institution.
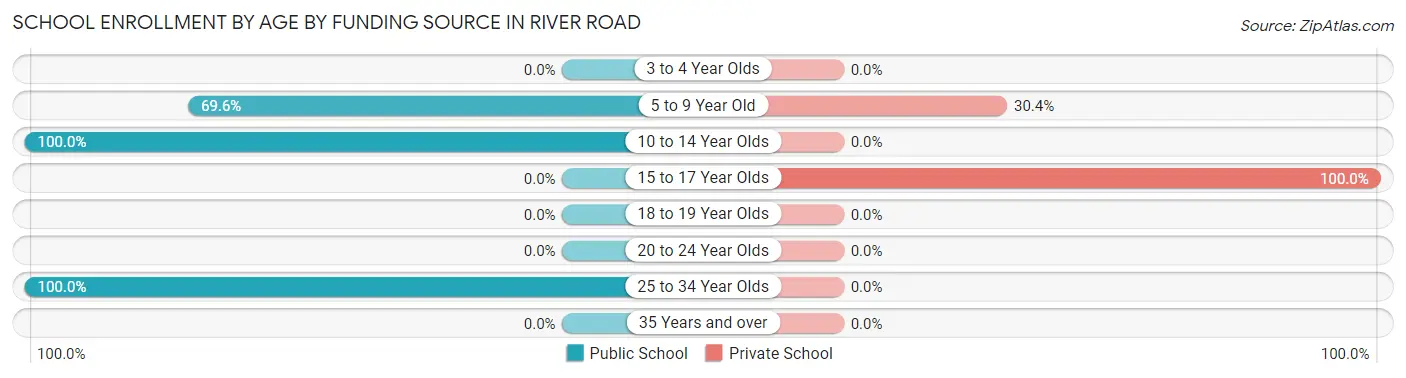
| Age Bracket | Public School | Private School |
| 3 to 4 Year Olds | 0 (0.0%) | 0 (0.0%) |
| 5 to 9 Year Old | 32 (69.6%) | 14 (30.4%) |
| 10 to 14 Year Olds | 60 (100.0%) | 0 (0.0%) |
| 15 to 17 Year Olds | 0 (0.0%) | 22 (100.0%) |
| 18 to 19 Year Olds | 0 (0.0%) | 0 (0.0%) |
| 20 to 24 Year Olds | 0 (0.0%) | 0 (0.0%) |
| 25 to 34 Year Olds | 6 (100.0%) | 0 (0.0%) |
| 35 Years and over | 0 (0.0%) | 0 (0.0%) |
| Total | 98 (73.1%) | 36 (26.9%) |
Educational Attainment by Field of Study in River Road
Science & technology (34 | 23.1%), literature & languages (34 | 23.1%), computers & mathematics (21 | 14.3%), business (19 | 12.9%), and bio, nature & agricultural (13 | 8.8%) are the most common fields of study among 147 individuals in River Road who have obtained a bachelor's degree or higher.
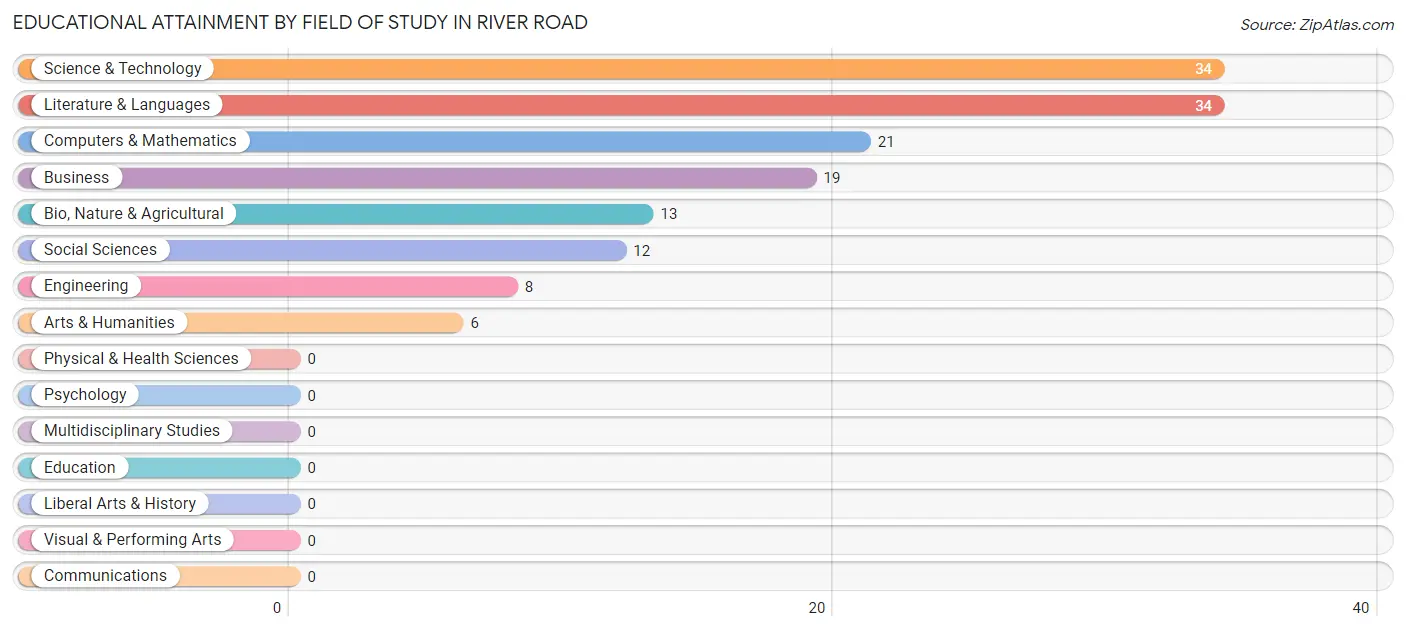
| Field of Study | # Graduates | % Graduates |
| Computers & Mathematics | 21 | 14.3% |
| Bio, Nature & Agricultural | 13 | 8.8% |
| Physical & Health Sciences | 0 | 0.0% |
| Psychology | 0 | 0.0% |
| Social Sciences | 12 | 8.2% |
| Engineering | 8 | 5.4% |
| Multidisciplinary Studies | 0 | 0.0% |
| Science & Technology | 34 | 23.1% |
| Business | 19 | 12.9% |
| Education | 0 | 0.0% |
| Literature & Languages | 34 | 23.1% |
| Liberal Arts & History | 0 | 0.0% |
| Visual & Performing Arts | 0 | 0.0% |
| Communications | 0 | 0.0% |
| Arts & Humanities | 6 | 4.1% |
| Total | 147 | 100.0% |
Transportation & Commute in River Road
Vehicle Availability by Sex in River Road
The most prevalent vehicle ownership categories in River Road are males with 2 vehicles (77, accounting for 61.6%) and females with 2 vehicles (99, making up 49.0%).
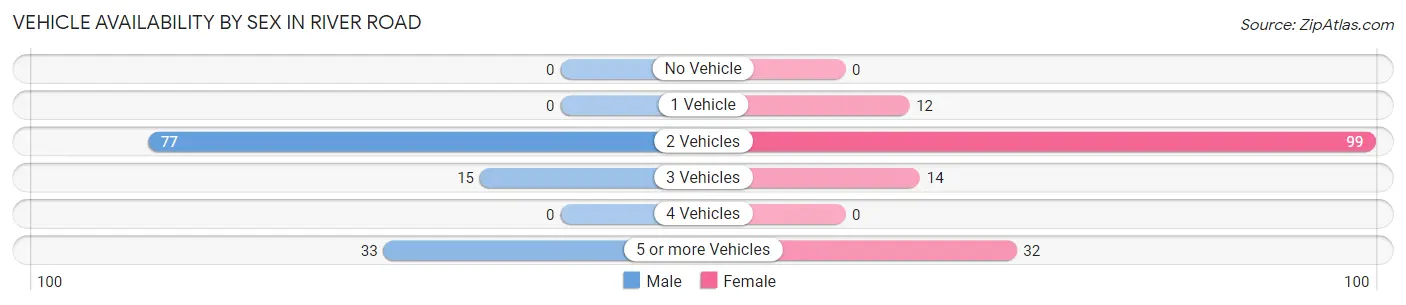
| Vehicles Available | Male | Female |
| No Vehicle | 0 (0.0%) | 0 (0.0%) |
| 1 Vehicle | 0 (0.0%) | 12 (7.6%) |
| 2 Vehicles | 77 (61.6%) | 99 (63.1%) |
| 3 Vehicles | 15 (12.0%) | 14 (8.9%) |
| 4 Vehicles | 0 (0.0%) | 0 (0.0%) |
| 5 or more Vehicles | 33 (26.4%) | 32 (20.4%) |
| Total | 125 (100.0%) | 157 (100.0%) |
Commute Time in River Road
The most frequently occuring commute durations in River Road are 10 to 14 minutes (132 commuters, 49.2%), 45 to 59 minutes (47 commuters, 17.5%), and 30 to 34 minutes (33 commuters, 12.3%).
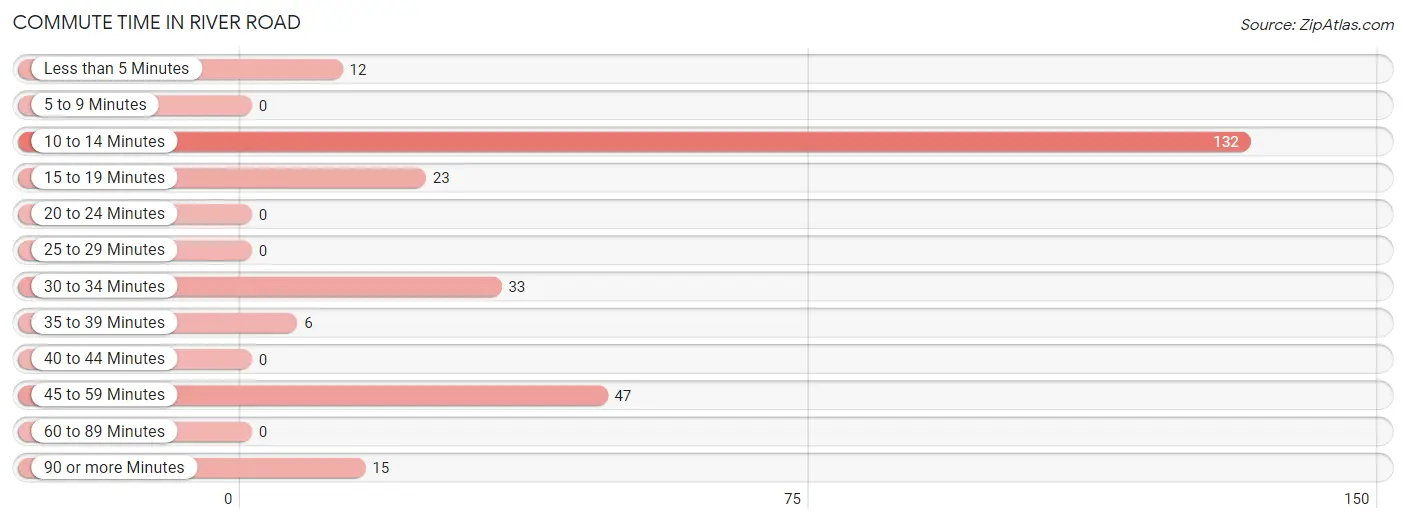
| Commute Time | # Commuters | % Commuters |
| Less than 5 Minutes | 12 | 4.5% |
| 5 to 9 Minutes | 0 | 0.0% |
| 10 to 14 Minutes | 132 | 49.2% |
| 15 to 19 Minutes | 23 | 8.6% |
| 20 to 24 Minutes | 0 | 0.0% |
| 25 to 29 Minutes | 0 | 0.0% |
| 30 to 34 Minutes | 33 | 12.3% |
| 35 to 39 Minutes | 6 | 2.2% |
| 40 to 44 Minutes | 0 | 0.0% |
| 45 to 59 Minutes | 47 | 17.5% |
| 60 to 89 Minutes | 0 | 0.0% |
| 90 or more Minutes | 15 | 5.6% |
Commute Time by Sex in River Road
The most common commute times in River Road are 10 to 14 minutes (63 commuters, 50.4%) for males and 10 to 14 minutes (69 commuters, 48.2%) for females.
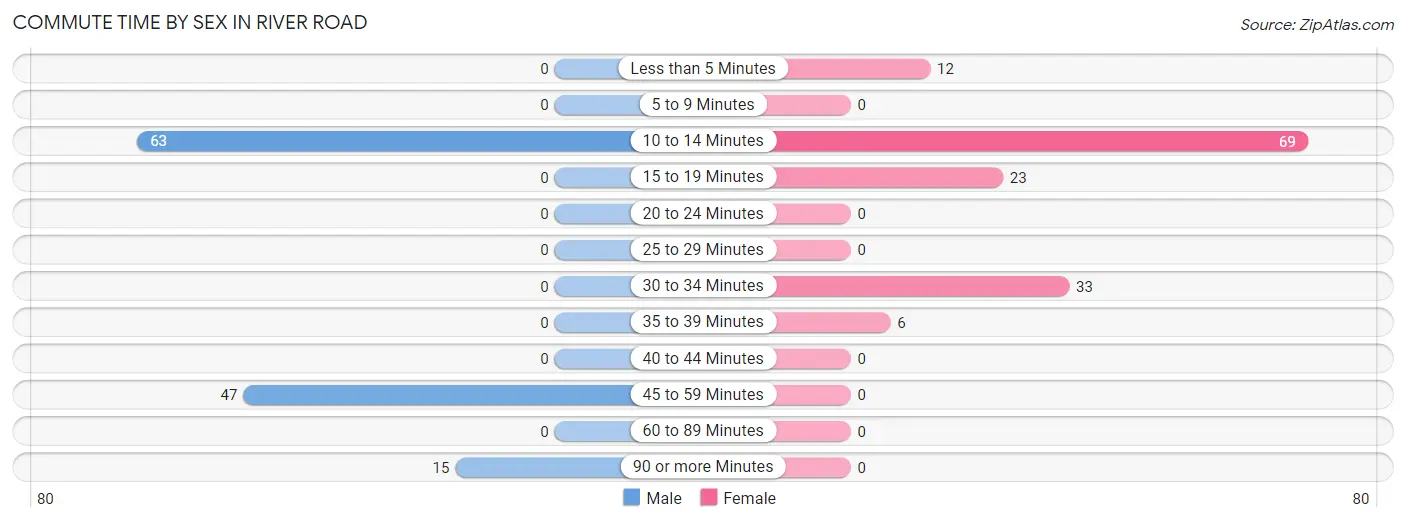
| Commute Time | Male | Female |
| Less than 5 Minutes | 0 (0.0%) | 12 (8.4%) |
| 5 to 9 Minutes | 0 (0.0%) | 0 (0.0%) |
| 10 to 14 Minutes | 63 (50.4%) | 69 (48.2%) |
| 15 to 19 Minutes | 0 (0.0%) | 23 (16.1%) |
| 20 to 24 Minutes | 0 (0.0%) | 0 (0.0%) |
| 25 to 29 Minutes | 0 (0.0%) | 0 (0.0%) |
| 30 to 34 Minutes | 0 (0.0%) | 33 (23.1%) |
| 35 to 39 Minutes | 0 (0.0%) | 6 (4.2%) |
| 40 to 44 Minutes | 0 (0.0%) | 0 (0.0%) |
| 45 to 59 Minutes | 47 (37.6%) | 0 (0.0%) |
| 60 to 89 Minutes | 0 (0.0%) | 0 (0.0%) |
| 90 or more Minutes | 15 (12.0%) | 0 (0.0%) |
Time of Departure to Work by Sex in River Road
The most frequent times of departure to work in River Road are 7:30 AM to 7:59 AM (42, 33.6%) for males and 8:00 AM to 8:29 AM (56, 39.2%) for females.
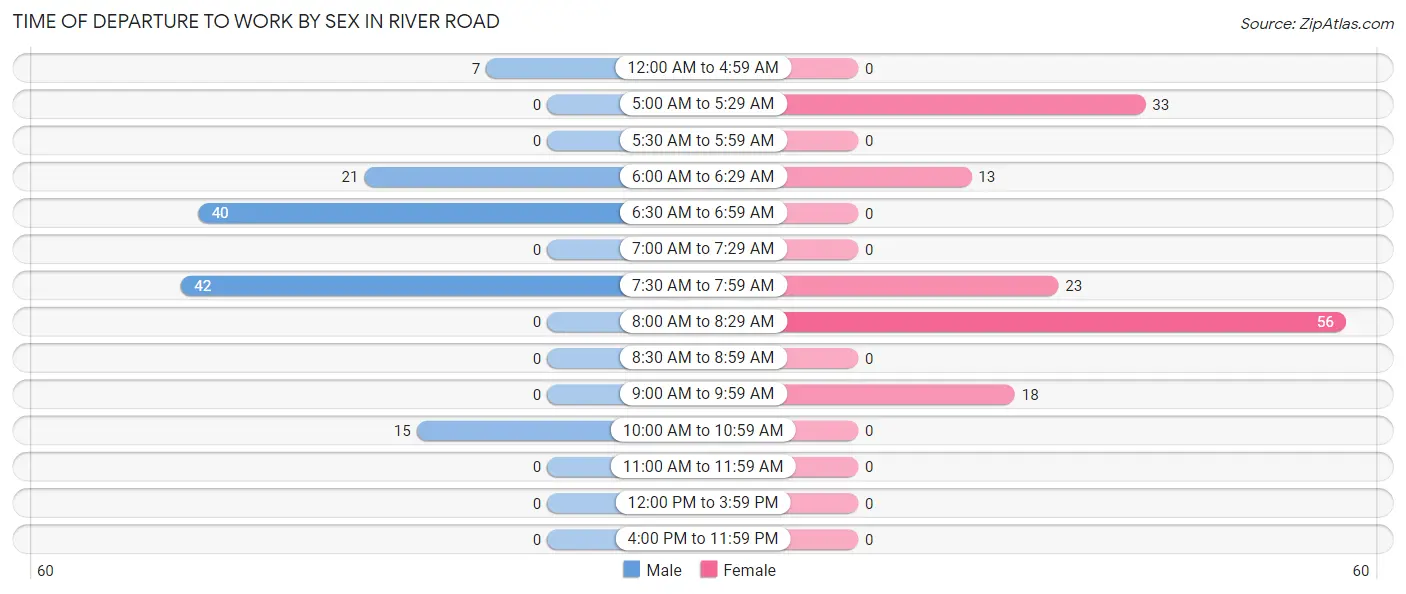
| Time of Departure | Male | Female |
| 12:00 AM to 4:59 AM | 7 (5.6%) | 0 (0.0%) |
| 5:00 AM to 5:29 AM | 0 (0.0%) | 33 (23.1%) |
| 5:30 AM to 5:59 AM | 0 (0.0%) | 0 (0.0%) |
| 6:00 AM to 6:29 AM | 21 (16.8%) | 13 (9.1%) |
| 6:30 AM to 6:59 AM | 40 (32.0%) | 0 (0.0%) |
| 7:00 AM to 7:29 AM | 0 (0.0%) | 0 (0.0%) |
| 7:30 AM to 7:59 AM | 42 (33.6%) | 23 (16.1%) |
| 8:00 AM to 8:29 AM | 0 (0.0%) | 56 (39.2%) |
| 8:30 AM to 8:59 AM | 0 (0.0%) | 0 (0.0%) |
| 9:00 AM to 9:59 AM | 0 (0.0%) | 18 (12.6%) |
| 10:00 AM to 10:59 AM | 15 (12.0%) | 0 (0.0%) |
| 11:00 AM to 11:59 AM | 0 (0.0%) | 0 (0.0%) |
| 12:00 PM to 3:59 PM | 0 (0.0%) | 0 (0.0%) |
| 4:00 PM to 11:59 PM | 0 (0.0%) | 0 (0.0%) |
| Total | 125 (100.0%) | 143 (100.0%) |
Housing Occupancy in River Road
Occupancy by Ownership in River Road
Of the total 221 dwellings in River Road, owner-occupied units account for 215 (97.3%), while renter-occupied units make up 6 (2.7%).
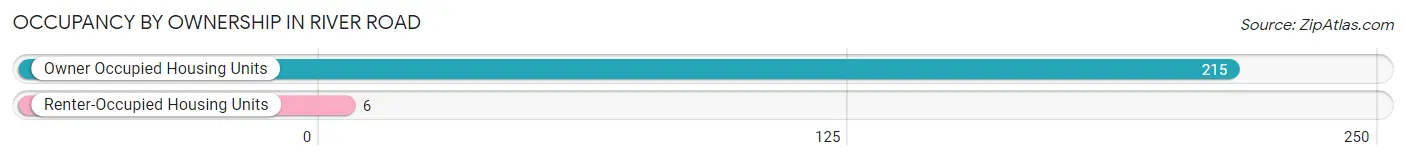
| Occupancy | # Housing Units | % Housing Units |
| Owner Occupied Housing Units | 215 | 97.3% |
| Renter-Occupied Housing Units | 6 | 2.7% |
| Total Occupied Housing Units | 221 | 100.0% |
Occupancy by Household Size in River Road
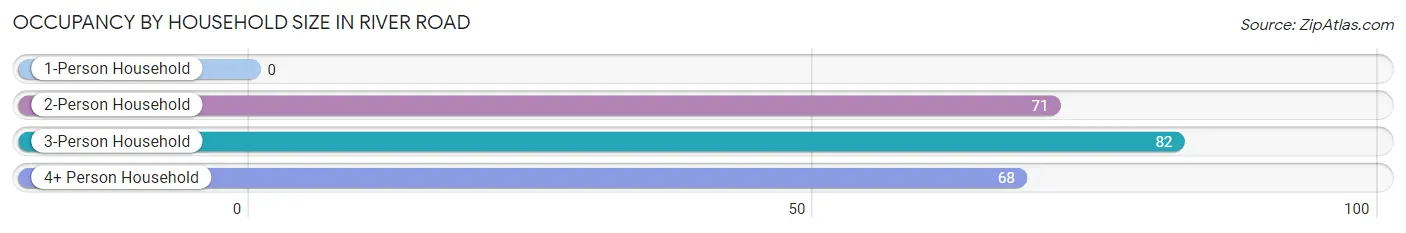
| Household Size | # Housing Units | % Housing Units |
| 1-Person Household | 0 | 0.0% |
| 2-Person Household | 71 | 32.1% |
| 3-Person Household | 82 | 37.1% |
| 4+ Person Household | 68 | 30.8% |
| Total Housing Units | 221 | 100.0% |
Occupancy by Ownership by Household Size in River Road
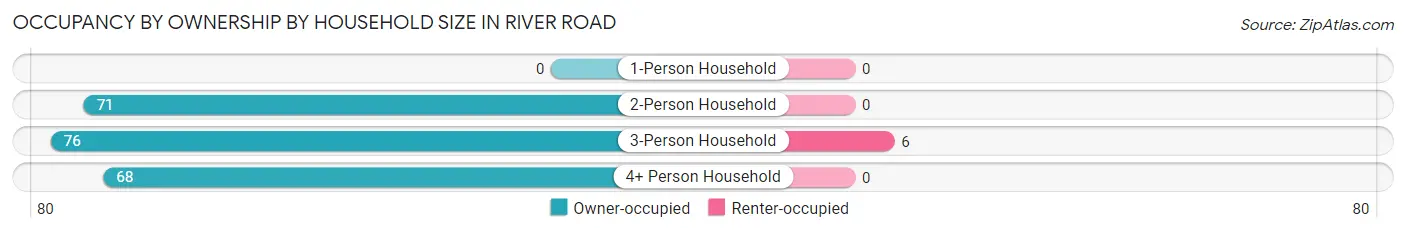
| Household Size | Owner-occupied | Renter-occupied |
| 1-Person Household | 0 (0.0%) | 0 (0.0%) |
| 2-Person Household | 71 (100.0%) | 0 (0.0%) |
| 3-Person Household | 76 (92.7%) | 6 (7.3%) |
| 4+ Person Household | 68 (100.0%) | 0 (0.0%) |
| Total Housing Units | 215 (97.3%) | 6 (2.7%) |
Occupancy by Educational Attainment in River Road
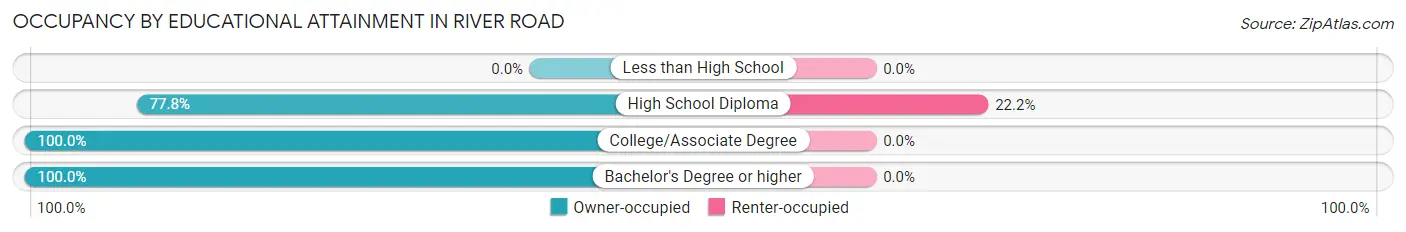
| Household Size | Owner-occupied | Renter-occupied |
| Less than High School | 0 (0.0%) | 0 (0.0%) |
| High School Diploma | 21 (77.8%) | 6 (22.2%) |
| College/Associate Degree | 142 (100.0%) | 0 (0.0%) |
| Bachelor's Degree or higher | 52 (100.0%) | 0 (0.0%) |
Occupancy by Age of Householder in River Road
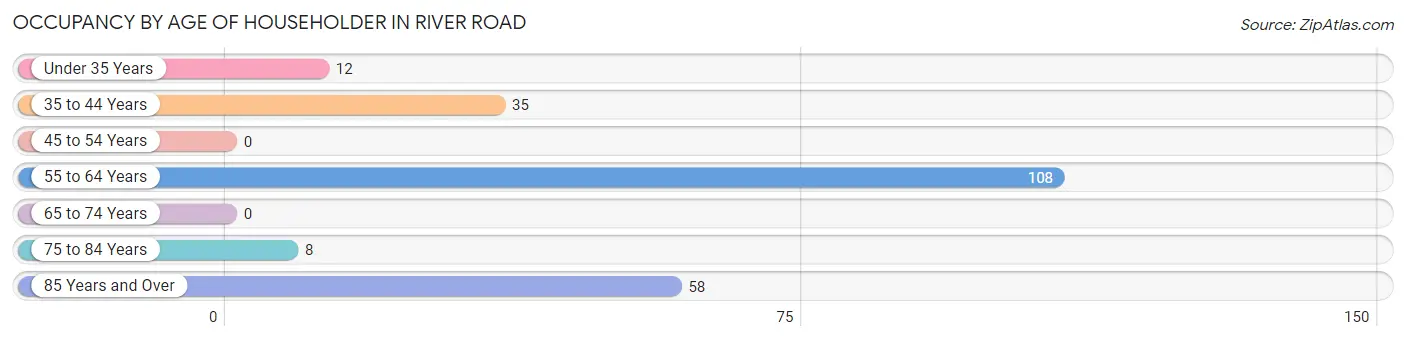
| Age Bracket | # Households | % Households |
| Under 35 Years | 12 | 5.4% |
| 35 to 44 Years | 35 | 15.8% |
| 45 to 54 Years | 0 | 0.0% |
| 55 to 64 Years | 108 | 48.9% |
| 65 to 74 Years | 0 | 0.0% |
| 75 to 84 Years | 8 | 3.6% |
| 85 Years and Over | 58 | 26.2% |
| Total | 221 | 100.0% |
Housing Finances in River Road
Median Income by Occupancy in River Road
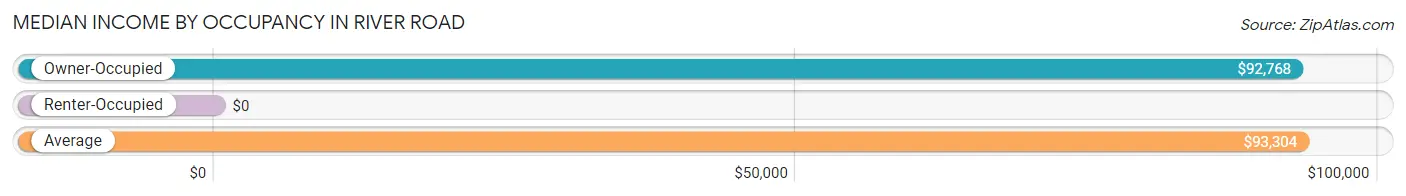
| Occupancy Type | # Households | Median Income |
| Owner-Occupied | 215 (97.3%) | $92,768 |
| Renter-Occupied | 6 (2.7%) | $0 |
| Average | 221 (100.0%) | $93,304 |
Occupancy by Householder Income Bracket in River Road
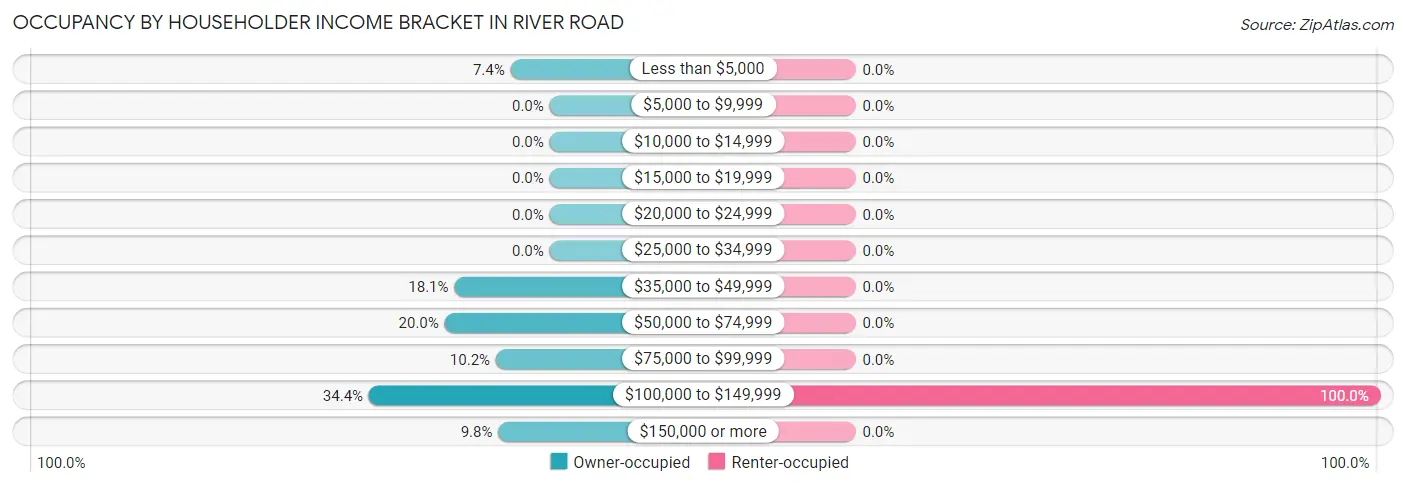
| Income Bracket | Owner-occupied | Renter-occupied |
| Less than $5,000 | 16 (7.4%) | 0 (0.0%) |
| $5,000 to $9,999 | 0 (0.0%) | 0 (0.0%) |
| $10,000 to $14,999 | 0 (0.0%) | 0 (0.0%) |
| $15,000 to $19,999 | 0 (0.0%) | 0 (0.0%) |
| $20,000 to $24,999 | 0 (0.0%) | 0 (0.0%) |
| $25,000 to $34,999 | 0 (0.0%) | 0 (0.0%) |
| $35,000 to $49,999 | 39 (18.1%) | 0 (0.0%) |
| $50,000 to $74,999 | 43 (20.0%) | 0 (0.0%) |
| $75,000 to $99,999 | 22 (10.2%) | 0 (0.0%) |
| $100,000 to $149,999 | 74 (34.4%) | 6 (100.0%) |
| $150,000 or more | 21 (9.8%) | 0 (0.0%) |
| Total | 215 (100.0%) | 6 (100.0%) |
Monthly Housing Cost Tiers in River Road
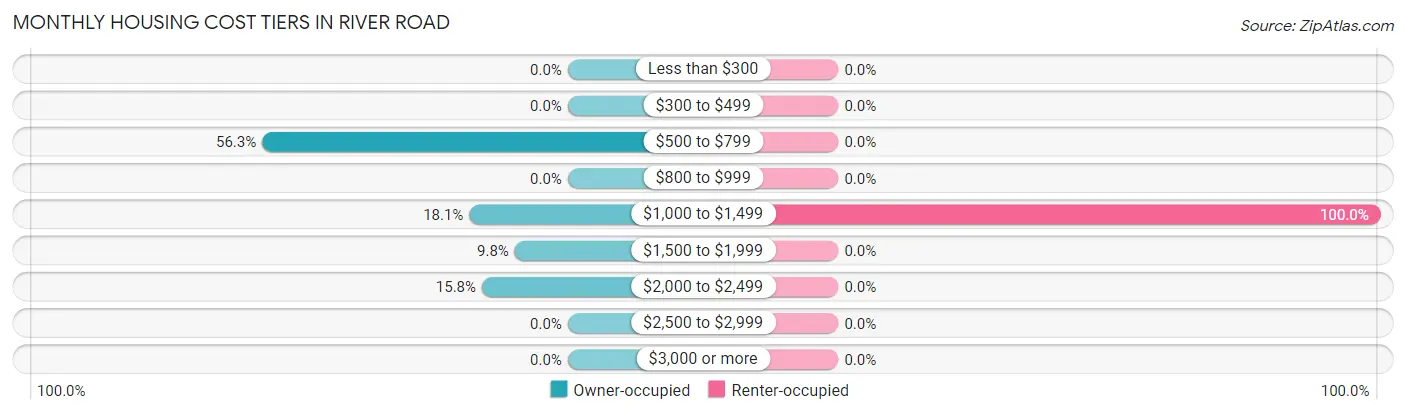
| Monthly Cost | Owner-occupied | Renter-occupied |
| Less than $300 | 0 (0.0%) | 0 (0.0%) |
| $300 to $499 | 0 (0.0%) | 0 (0.0%) |
| $500 to $799 | 121 (56.3%) | 0 (0.0%) |
| $800 to $999 | 0 (0.0%) | 0 (0.0%) |
| $1,000 to $1,499 | 39 (18.1%) | 6 (100.0%) |
| $1,500 to $1,999 | 21 (9.8%) | 0 (0.0%) |
| $2,000 to $2,499 | 34 (15.8%) | 0 (0.0%) |
| $2,500 to $2,999 | 0 (0.0%) | 0 (0.0%) |
| $3,000 or more | 0 (0.0%) | 0 (0.0%) |
| Total | 215 (100.0%) | 6 (100.0%) |
Physical Housing Characteristics in River Road
Housing Structures in River Road
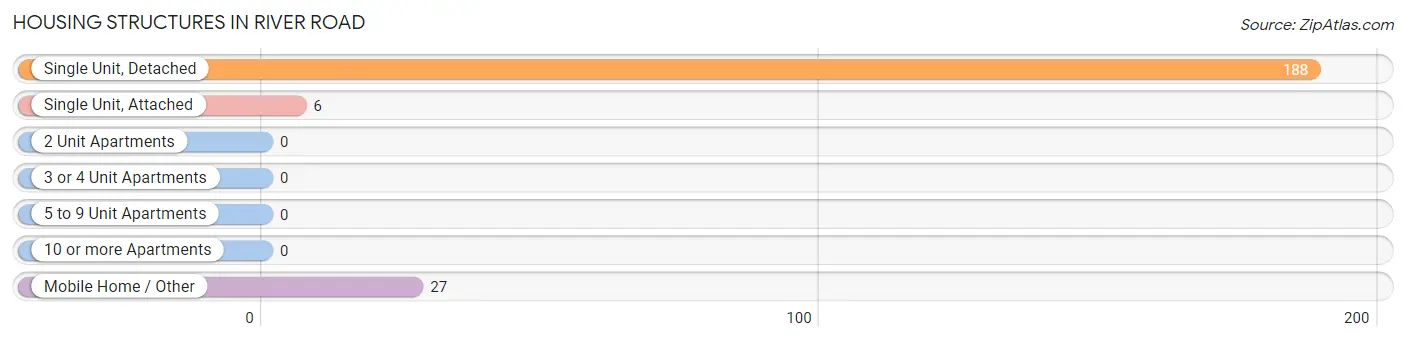
| Structure Type | # Housing Units | % Housing Units |
| Single Unit, Detached | 188 | 85.1% |
| Single Unit, Attached | 6 | 2.7% |
| 2 Unit Apartments | 0 | 0.0% |
| 3 or 4 Unit Apartments | 0 | 0.0% |
| 5 to 9 Unit Apartments | 0 | 0.0% |
| 10 or more Apartments | 0 | 0.0% |
| Mobile Home / Other | 27 | 12.2% |
| Total | 221 | 100.0% |
Housing Structures by Occupancy in River Road
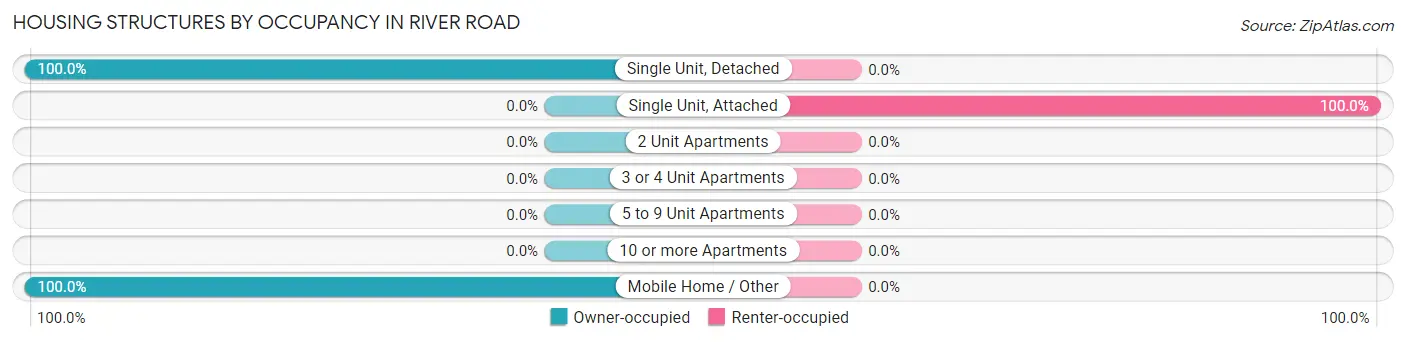
| Structure Type | Owner-occupied | Renter-occupied |
| Single Unit, Detached | 188 (100.0%) | 0 (0.0%) |
| Single Unit, Attached | 0 (0.0%) | 6 (100.0%) |
| 2 Unit Apartments | 0 (0.0%) | 0 (0.0%) |
| 3 or 4 Unit Apartments | 0 (0.0%) | 0 (0.0%) |
| 5 to 9 Unit Apartments | 0 (0.0%) | 0 (0.0%) |
| 10 or more Apartments | 0 (0.0%) | 0 (0.0%) |
| Mobile Home / Other | 27 (100.0%) | 0 (0.0%) |
| Total | 215 (97.3%) | 6 (2.7%) |
Housing Structures by Number of Rooms in River Road
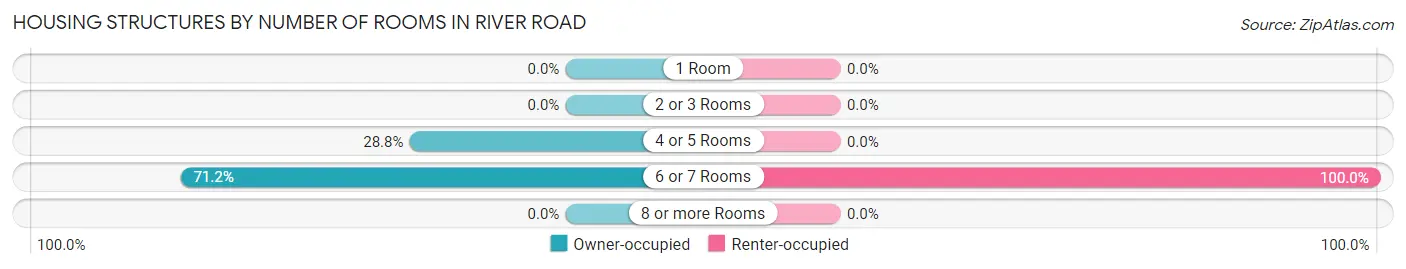
| Number of Rooms | Owner-occupied | Renter-occupied |
| 1 Room | 0 (0.0%) | 0 (0.0%) |
| 2 or 3 Rooms | 0 (0.0%) | 0 (0.0%) |
| 4 or 5 Rooms | 62 (28.8%) | 0 (0.0%) |
| 6 or 7 Rooms | 153 (71.2%) | 6 (100.0%) |
| 8 or more Rooms | 0 (0.0%) | 0 (0.0%) |
| Total | 215 (100.0%) | 6 (100.0%) |
Housing Structure by Heating Type in River Road
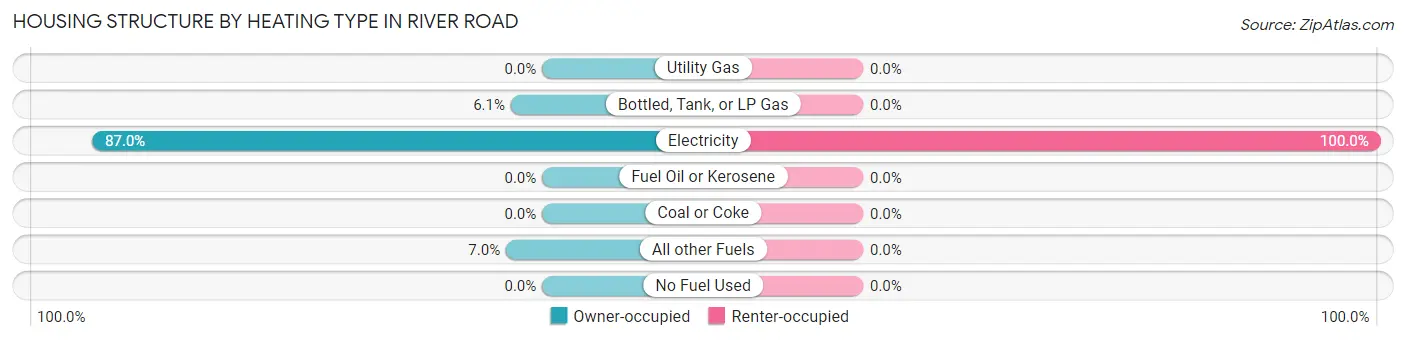
| Heating Type | Owner-occupied | Renter-occupied |
| Utility Gas | 0 (0.0%) | 0 (0.0%) |
| Bottled, Tank, or LP Gas | 13 (6.0%) | 0 (0.0%) |
| Electricity | 187 (87.0%) | 6 (100.0%) |
| Fuel Oil or Kerosene | 0 (0.0%) | 0 (0.0%) |
| Coal or Coke | 0 (0.0%) | 0 (0.0%) |
| All other Fuels | 15 (7.0%) | 0 (0.0%) |
| No Fuel Used | 0 (0.0%) | 0 (0.0%) |
| Total | 215 (100.0%) | 6 (100.0%) |
Household Vehicle Usage in River Road
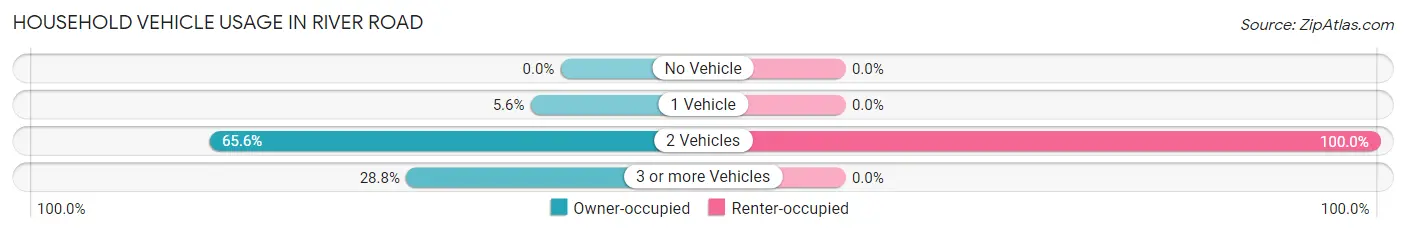
| Vehicles per Household | Owner-occupied | Renter-occupied |
| No Vehicle | 0 (0.0%) | 0 (0.0%) |
| 1 Vehicle | 12 (5.6%) | 0 (0.0%) |
| 2 Vehicles | 141 (65.6%) | 6 (100.0%) |
| 3 or more Vehicles | 62 (28.8%) | 0 (0.0%) |
| Total | 215 (100.0%) | 6 (100.0%) |
Real Estate & Mortgages in River Road
Real Estate and Mortgage Overview in River Road
| Characteristic | Without Mortgage | With Mortgage |
| Housing Units | 121 | 94 |
| Median Property Value | $396,300 | $358,800 |
| Median Household Income | $56,146 | $21 |
| Monthly Housing Costs | $664 | $0 |
| Real Estate Taxes | $2,963 | $0 |
Property Value by Mortgage Status in River Road
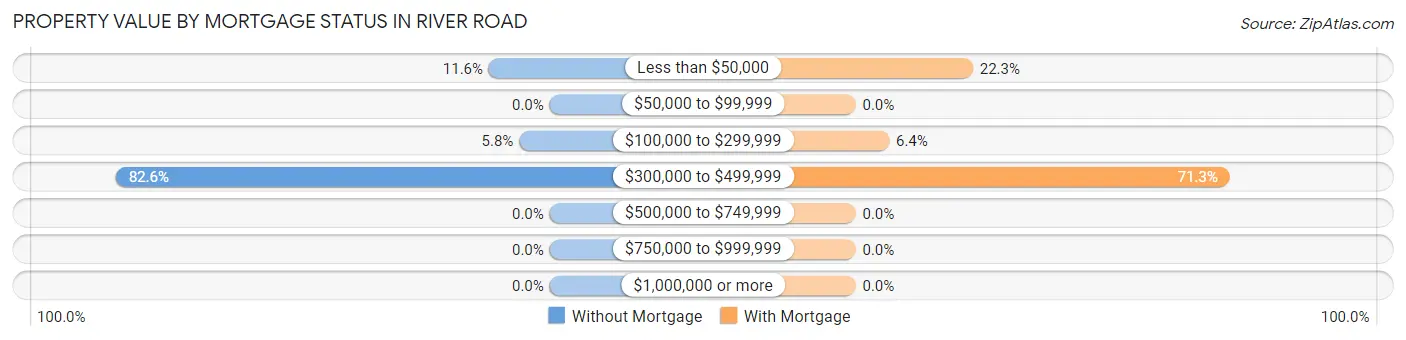
| Property Value | Without Mortgage | With Mortgage |
| Less than $50,000 | 14 (11.6%) | 21 (22.3%) |
| $50,000 to $99,999 | 0 (0.0%) | 0 (0.0%) |
| $100,000 to $299,999 | 7 (5.8%) | 6 (6.4%) |
| $300,000 to $499,999 | 100 (82.6%) | 67 (71.3%) |
| $500,000 to $749,999 | 0 (0.0%) | 0 (0.0%) |
| $750,000 to $999,999 | 0 (0.0%) | 0 (0.0%) |
| $1,000,000 or more | 0 (0.0%) | 0 (0.0%) |
| Total | 121 (100.0%) | 94 (100.0%) |
Household Income by Mortgage Status in River Road
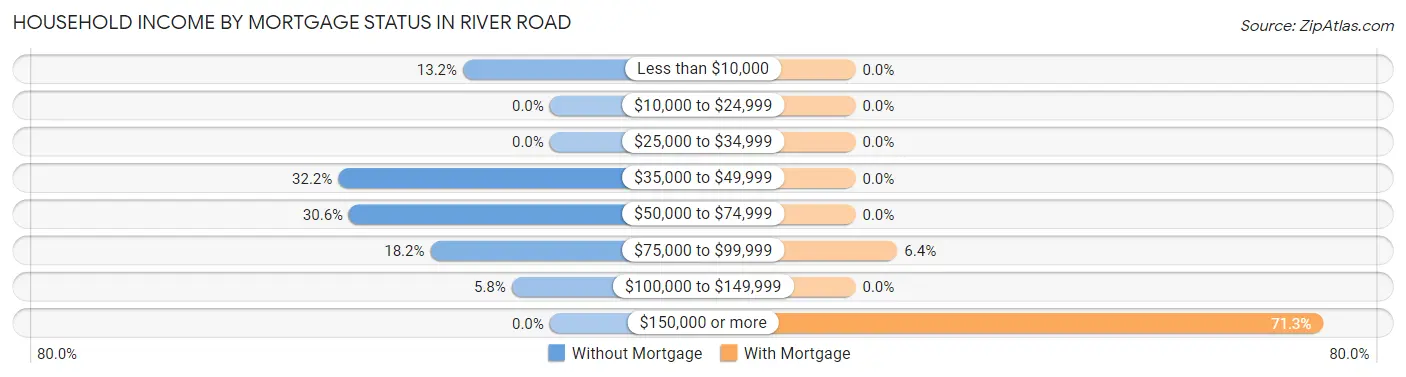
| Household Income | Without Mortgage | With Mortgage |
| Less than $10,000 | 16 (13.2%) | 0 (0.0%) |
| $10,000 to $24,999 | 0 (0.0%) | 0 (0.0%) |
| $25,000 to $34,999 | 0 (0.0%) | 0 (0.0%) |
| $35,000 to $49,999 | 39 (32.2%) | 0 (0.0%) |
| $50,000 to $74,999 | 37 (30.6%) | 0 (0.0%) |
| $75,000 to $99,999 | 22 (18.2%) | 6 (6.4%) |
| $100,000 to $149,999 | 7 (5.8%) | 0 (0.0%) |
| $150,000 or more | 0 (0.0%) | 67 (71.3%) |
| Total | 121 (100.0%) | 94 (100.0%) |
Property Value to Household Income Ratio in River Road
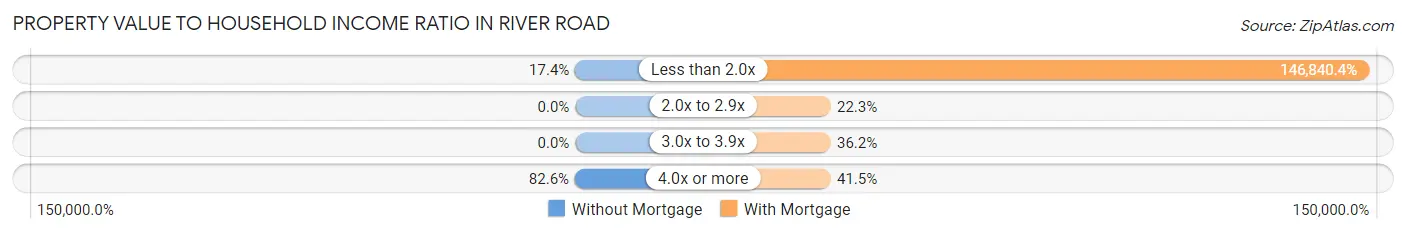
| Value-to-Income Ratio | Without Mortgage | With Mortgage |
| Less than 2.0x | 21 (17.4%) | 138,030 (146,840.4%) |
| 2.0x to 2.9x | 0 (0.0%) | 21 (22.3%) |
| 3.0x to 3.9x | 0 (0.0%) | 34 (36.2%) |
| 4.0x or more | 100 (82.6%) | 39 (41.5%) |
| Total | 121 (100.0%) | 94 (100.0%) |
Real Estate Taxes by Mortgage Status in River Road
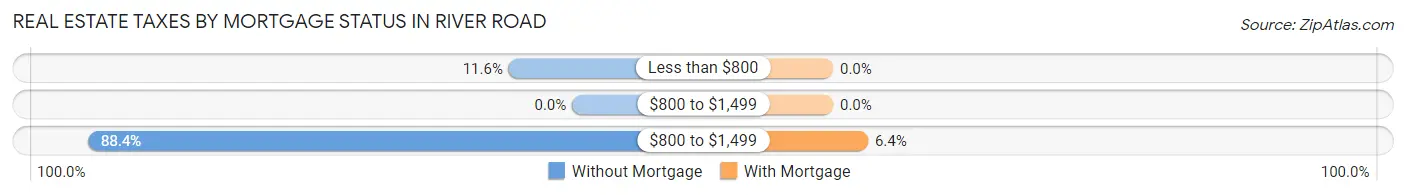
| Property Taxes | Without Mortgage | With Mortgage |
| Less than $800 | 14 (11.6%) | 0 (0.0%) |
| $800 to $1,499 | 0 (0.0%) | 0 (0.0%) |
| $800 to $1,499 | 107 (88.4%) | 6 (6.4%) |
| Total | 121 (100.0%) | 94 (100.0%) |
Health & Disability in River Road
Health Insurance Coverage by Age in River Road
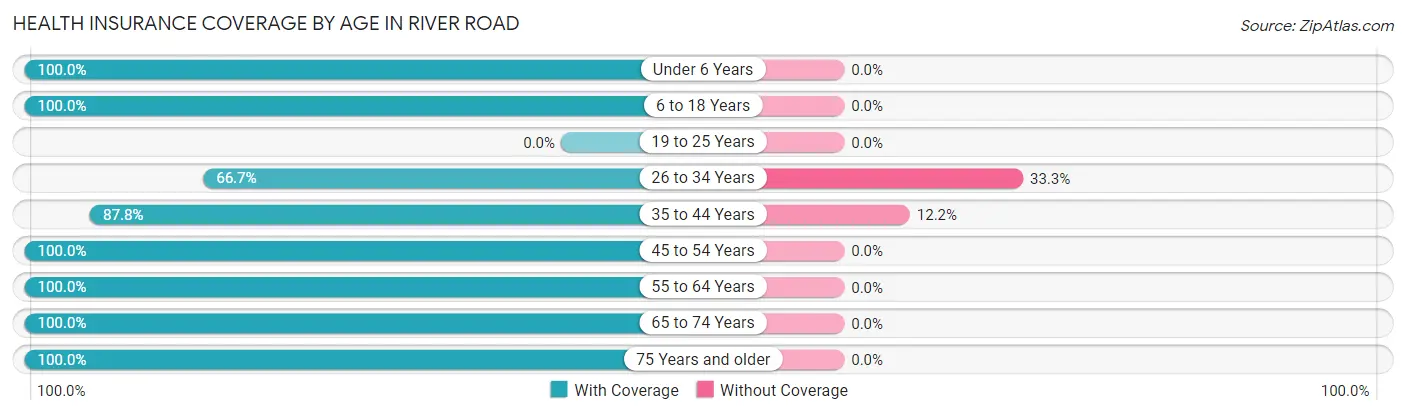
| Age Bracket | With Coverage | Without Coverage |
| Under 6 Years | 57 (100.0%) | 0 (0.0%) |
| 6 to 18 Years | 194 (100.0%) | 0 (0.0%) |
| 19 to 25 Years | 0 (0.0%) | 0 (0.0%) |
| 26 to 34 Years | 12 (66.7%) | 6 (33.3%) |
| 35 to 44 Years | 122 (87.8%) | 17 (12.2%) |
| 45 to 54 Years | 33 (100.0%) | 0 (0.0%) |
| 55 to 64 Years | 190 (100.0%) | 0 (0.0%) |
| 65 to 74 Years | 69 (100.0%) | 0 (0.0%) |
| 75 Years and older | 100 (100.0%) | 0 (0.0%) |
| Total | 777 (97.1%) | 23 (2.9%) |
Health Insurance Coverage by Citizenship Status in River Road
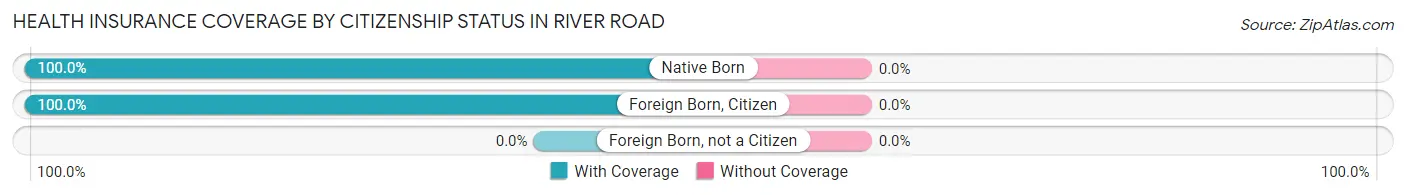
| Citizenship Status | With Coverage | Without Coverage |
| Native Born | 57 (100.0%) | 0 (0.0%) |
| Foreign Born, Citizen | 194 (100.0%) | 0 (0.0%) |
| Foreign Born, not a Citizen | 0 (0.0%) | 0 (0.0%) |
Health Insurance Coverage by Household Income in River Road
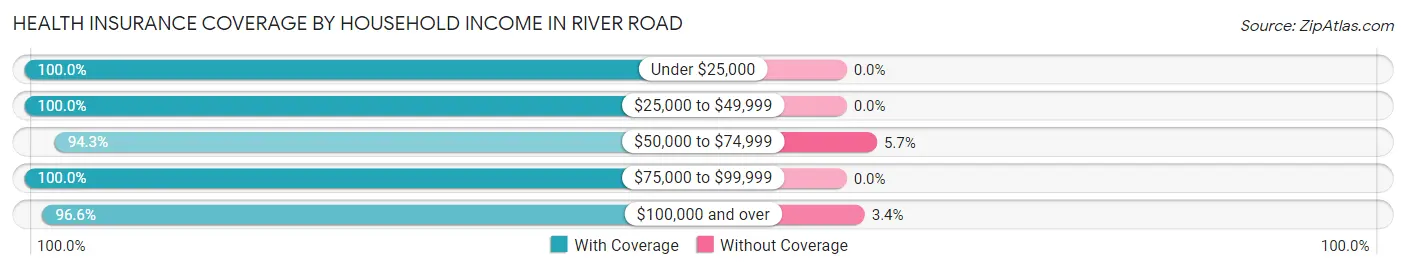
| Household Income | With Coverage | Without Coverage |
| Under $25,000 | 28 (100.0%) | 0 (0.0%) |
| $25,000 to $49,999 | 91 (100.0%) | 0 (0.0%) |
| $50,000 to $74,999 | 100 (94.3%) | 6 (5.7%) |
| $75,000 to $99,999 | 71 (100.0%) | 0 (0.0%) |
| $100,000 and over | 487 (96.6%) | 17 (3.4%) |
Public vs Private Health Insurance Coverage by Age in River Road
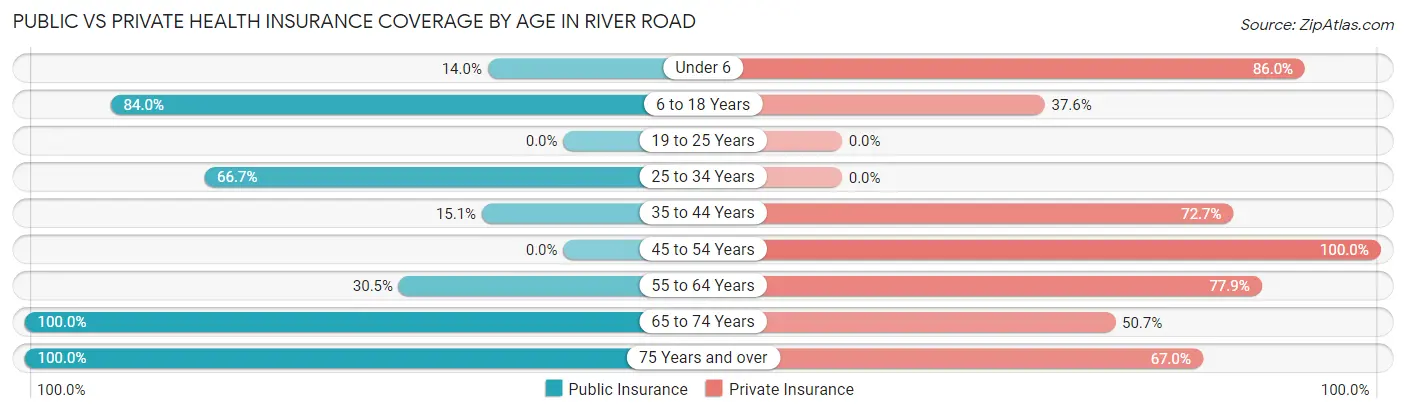
| Age Bracket | Public Insurance | Private Insurance |
| Under 6 | 8 (14.0%) | 49 (86.0%) |
| 6 to 18 Years | 163 (84.0%) | 73 (37.6%) |
| 19 to 25 Years | 0 (0.0%) | 0 (0.0%) |
| 25 to 34 Years | 12 (66.7%) | 0 (0.0%) |
| 35 to 44 Years | 21 (15.1%) | 101 (72.7%) |
| 45 to 54 Years | 0 (0.0%) | 33 (100.0%) |
| 55 to 64 Years | 58 (30.5%) | 148 (77.9%) |
| 65 to 74 Years | 69 (100.0%) | 35 (50.7%) |
| 75 Years and over | 100 (100.0%) | 67 (67.0%) |
| Total | 431 (53.9%) | 506 (63.2%) |
Disability Status by Sex by Age in River Road
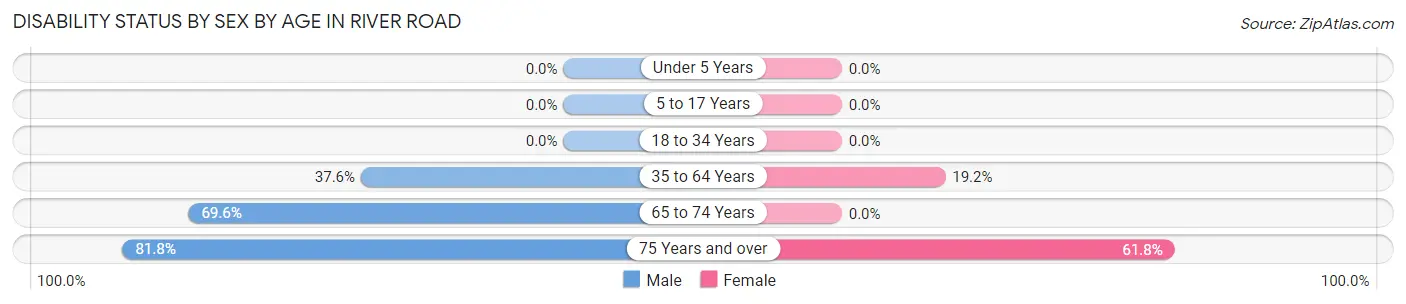
| Age Bracket | Male | Female |
| Under 5 Years | 0 (0.0%) | 0 (0.0%) |
| 5 to 17 Years | 0 (0.0%) | 0 (0.0%) |
| 18 to 34 Years | 0 (0.0%) | 0 (0.0%) |
| 35 to 64 Years | 50 (37.6%) | 44 (19.2%) |
| 65 to 74 Years | 48 (69.6%) | 0 (0.0%) |
| 75 Years and over | 54 (81.8%) | 21 (61.8%) |
Disability Class by Sex by Age in River Road
Disability Class: Hearing Difficulty
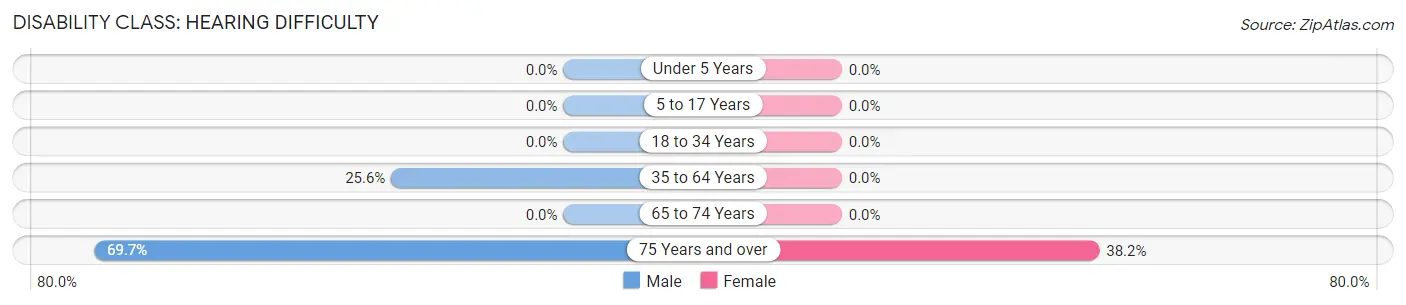
| Age Bracket | Male | Female |
| Under 5 Years | 0 (0.0%) | 0 (0.0%) |
| 5 to 17 Years | 0 (0.0%) | 0 (0.0%) |
| 18 to 34 Years | 0 (0.0%) | 0 (0.0%) |
| 35 to 64 Years | 34 (25.6%) | 0 (0.0%) |
| 65 to 74 Years | 0 (0.0%) | 0 (0.0%) |
| 75 Years and over | 46 (69.7%) | 13 (38.2%) |
Disability Class: Vision Difficulty
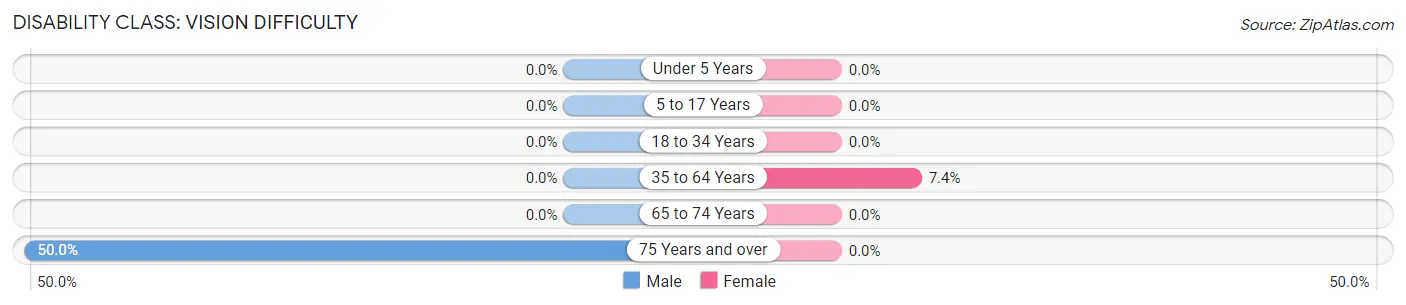
| Age Bracket | Male | Female |
| Under 5 Years | 0 (0.0%) | 0 (0.0%) |
| 5 to 17 Years | 0 (0.0%) | 0 (0.0%) |
| 18 to 34 Years | 0 (0.0%) | 0 (0.0%) |
| 35 to 64 Years | 0 (0.0%) | 17 (7.4%) |
| 65 to 74 Years | 0 (0.0%) | 0 (0.0%) |
| 75 Years and over | 33 (50.0%) | 0 (0.0%) |
Disability Class: Cognitive Difficulty
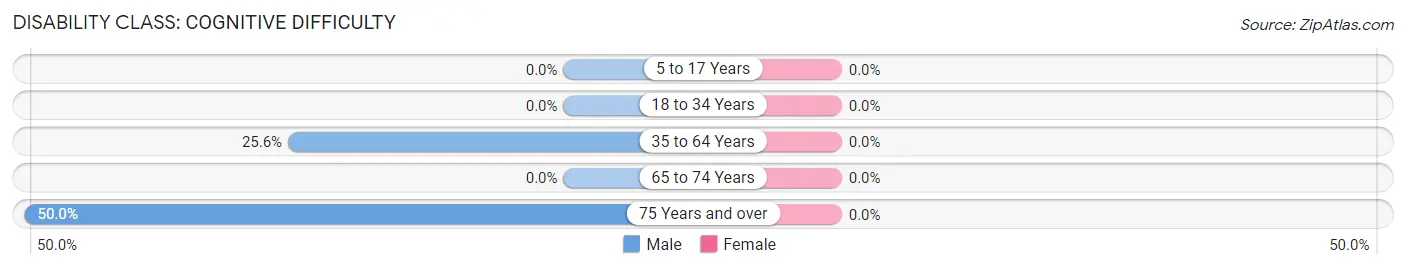
| Age Bracket | Male | Female |
| 5 to 17 Years | 0 (0.0%) | 0 (0.0%) |
| 18 to 34 Years | 0 (0.0%) | 0 (0.0%) |
| 35 to 64 Years | 34 (25.6%) | 0 (0.0%) |
| 65 to 74 Years | 0 (0.0%) | 0 (0.0%) |
| 75 Years and over | 33 (50.0%) | 0 (0.0%) |
Disability Class: Ambulatory Difficulty
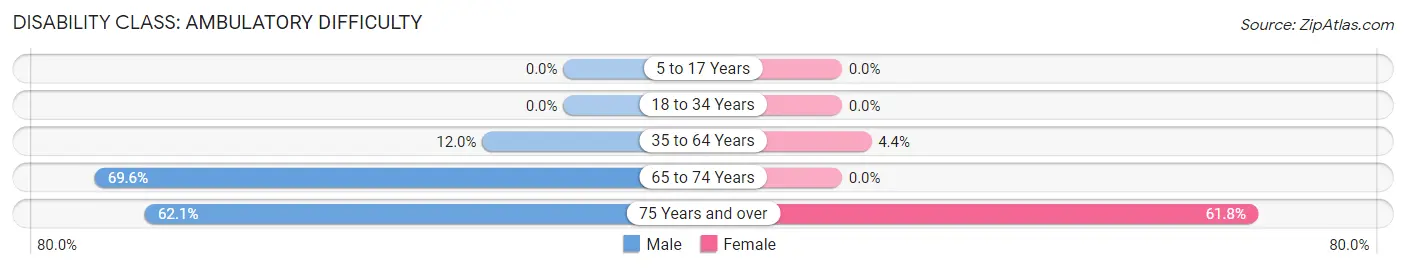
| Age Bracket | Male | Female |
| 5 to 17 Years | 0 (0.0%) | 0 (0.0%) |
| 18 to 34 Years | 0 (0.0%) | 0 (0.0%) |
| 35 to 64 Years | 16 (12.0%) | 10 (4.4%) |
| 65 to 74 Years | 48 (69.6%) | 0 (0.0%) |
| 75 Years and over | 41 (62.1%) | 21 (61.8%) |
Disability Class: Self-Care Difficulty
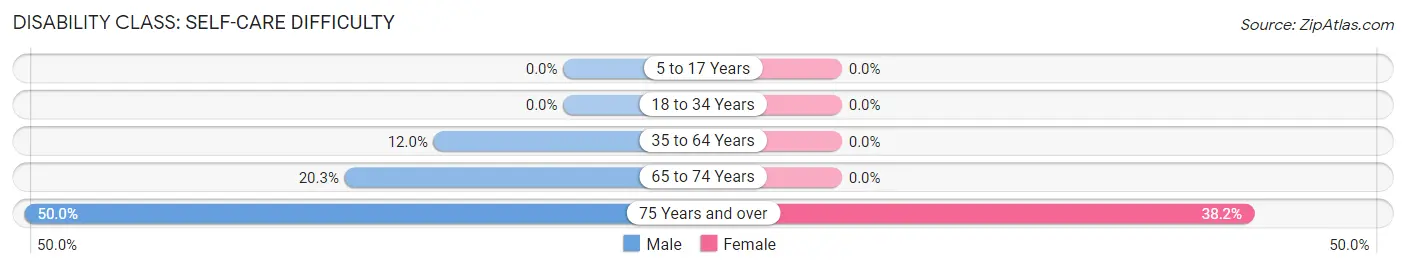
| Age Bracket | Male | Female |
| 5 to 17 Years | 0 (0.0%) | 0 (0.0%) |
| 18 to 34 Years | 0 (0.0%) | 0 (0.0%) |
| 35 to 64 Years | 16 (12.0%) | 0 (0.0%) |
| 65 to 74 Years | 14 (20.3%) | 0 (0.0%) |
| 75 Years and over | 33 (50.0%) | 13 (38.2%) |
Technology Access in River Road
Computing Device Access in River Road
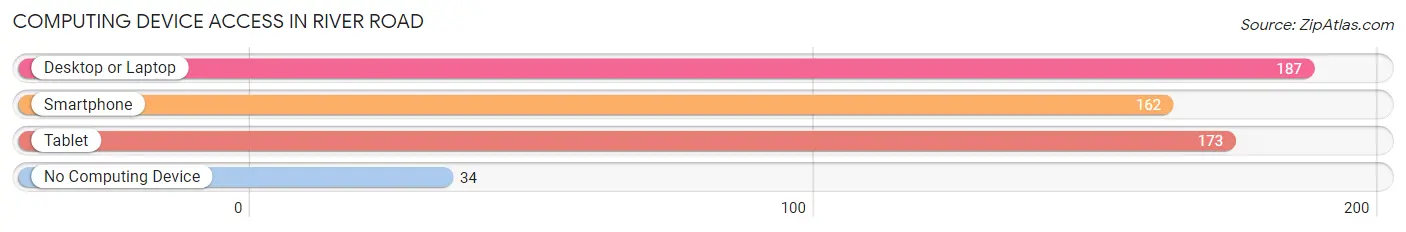
| Device Type | # Households | % Households |
| Desktop or Laptop | 187 | 84.6% |
| Smartphone | 162 | 73.3% |
| Tablet | 173 | 78.3% |
| No Computing Device | 34 | 15.4% |
| Total | 221 | 100.0% |
Internet Access in River Road
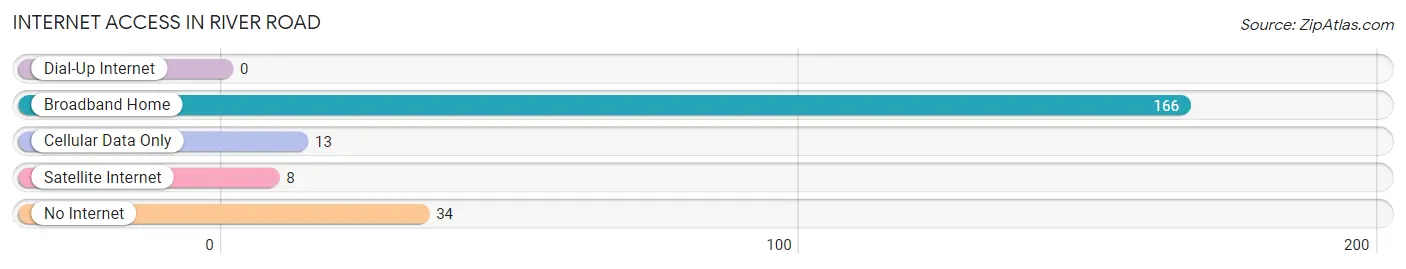
| Internet Type | # Households | % Households |
| Dial-Up Internet | 0 | 0.0% |
| Broadband Home | 166 | 75.1% |
| Cellular Data Only | 13 | 5.9% |
| Satellite Internet | 8 | 3.6% |
| No Internet | 34 | 15.4% |
| Total | 221 | 100.0% |
River Road Summary
Roads are an integral part of any community, providing access to goods, services, and people. The River Road in Washington is no exception. This road has a long and varied history, geography, economy, and demographics that have shaped the area and its people.
History
The River Road in Washington has a long and varied history. The area was first inhabited by the Chinook and Cowlitz tribes, who used the river for fishing and transportation. In the early 1800s, the area was explored by Lewis and Clark, who noted the abundance of salmon in the river. In the mid-1800s, the area was settled by pioneers, who built farms and homesteads along the river.
The River Road was built in the late 1800s to connect the small towns and settlements along the river. The road was used for transportation and commerce, and it quickly became an important part of the local economy. In the early 1900s, the road was improved and widened to accommodate the increasing traffic.
In the mid-1900s, the River Road was widened again to accommodate the growing number of cars and trucks. The road was also improved to make it safer for drivers. In the late 1900s, the road was widened once more to accommodate the increasing number of vehicles.
Geography
The River Road in Washington is located in the western part of the state, near the Columbia River. The road runs along the river for approximately 30 miles, from the town of Longview to the town of Kalama. The road is mostly flat, with some rolling hills and curves. The terrain is mostly forested, with some open fields and pastures.
The area around the River Road is mostly rural, with small towns and farms dotting the landscape. The area is known for its lush forests, abundant wildlife, and scenic views. The area is also home to several state parks, including the Columbia Hills State Park and the Lewis and Clark State Park.
Economy
The River Road in Washington is an important part of the local economy. The road is used for transportation and commerce, and it is a major source of employment for the area. The road is also used for recreational activities, such as fishing, camping, and hiking.
The area around the River Road is home to several industries, including logging, farming, and manufacturing. The area is also home to several small businesses, such as restaurants, shops, and service providers. The area is also home to several tourist attractions, such as the Columbia Hills State Park and the Lewis and Clark State Park.
Demographics
The River Road in Washington is home to a diverse population. According to the 2010 census, the population of the area was approximately 8,000 people. The population is mostly white, with a small percentage of African Americans, Asians, and Native Americans. The median household income in the area is approximately $50,000.
The area around the River Road is mostly rural, with small towns and farms dotting the landscape. The area is known for its lush forests, abundant wildlife, and scenic views. The area is also home to several state parks, including the Columbia Hills State Park and the Lewis and Clark State Park.
Conclusion
The River Road in Washington has a long and varied history, geography, economy, and demographics that have shaped the area and its people. The road is an important part of the local economy, providing access to goods, services, and people. The area is also home to several industries, small businesses, and tourist attractions. The area is also home to a diverse population, with a median household income of approximately $50,000. The River Road is an important part of the local community, providing access to goods, services, and people.
Common Questions
What is Per Capita Income in River Road?
Per Capita income in River Road is $26,739.
What is the Median Family Income in River Road?
Median Family Income in River Road is $93,304.
What is the Median Household income in River Road?
Median Household Income in River Road is $93,304.
What is Income or Wage Gap in River Road?
Income or Wage Gap in River Road is 37.3%.
Women in River Road earn 62.7 cents for every dollar earned by a man.
What is Inequality or Gini Index in River Road?
Inequality or Gini Index in River Road is 0.31.
What is the Total Population of River Road?
Total Population of River Road is 800.
What is the Total Male Population of River Road?
Total Male Population of River Road is 455.
What is the Total Female Population of River Road?
Total Female Population of River Road is 345.
What is the Ratio of Males per 100 Females in River Road?
There are 131.88 Males per 100 Females in River Road.
What is the Ratio of Females per 100 Males in River Road?
There are 75.82 Females per 100 Males in River Road.
What is the Median Population Age in River Road?
Median Population Age in River Road is 43.8 Years.
What is the Average Family Size in River Road
Average Family Size in River Road is 3.6 People.
What is the Average Household Size in River Road
Average Household Size in River Road is 3.6 People.
How Large is the Labor Force in River Road?
There are 316 People in the Labor Forcein in River Road.
What is the Percentage of People in the Labor Force in River Road?
53.5% of People are in the Labor Force in River Road.
What is the Unemployment Rate in River Road?
Unemployment Rate in River Road is 10.8%.