Porter, WA Map & Demographics
Porter Map
Porter Overview
$58,286
PER CAPITA INCOME
$100,667
AVG FAMILY INCOME
0.48
INEQUALITY / GINI INDEX
146
TOTAL POPULATION
75
MALE POPULATION
71
FEMALE POPULATION
105.63
MALES / 100 FEMALES
94.67
FEMALES / 100 MALES
65.1
MEDIAN AGE
2.2
AVG FAMILY SIZE
2.0
AVG HOUSEHOLD SIZE
66
LABOR FORCE [ PEOPLE ]
45.2%
PERCENT IN LABOR FORCE
24.2%
UNEMPLOYMENT RATE
Income in Porter
Income Overview in Porter
| Characteristic | Number | Measure |
| Per Capita Income | 146 | $58,286 |
| Median Family Income | 58 | $100,667 |
| Mean Family Income | 58 | $136,552 |
| Median Household Income | 74 | $0 |
| Mean Household Income | 74 | $112,342 |
| Income Deficit | 58 | $0 |
| Wage / Income Gap (%) | 146 | 0.00% |
| Wage / Income Gap ($) | 146 | 100.00¢ per $1 |
| Gini / Inequality Index | 146 | 0.48 |
Earnings by Sex in Porter
| Sex | Number | Average Earnings |
| Male | 25 (37.9%) | $0 |
| Female | 41 (62.1%) | $0 |
| Total | 66 (100.0%) | $0 |
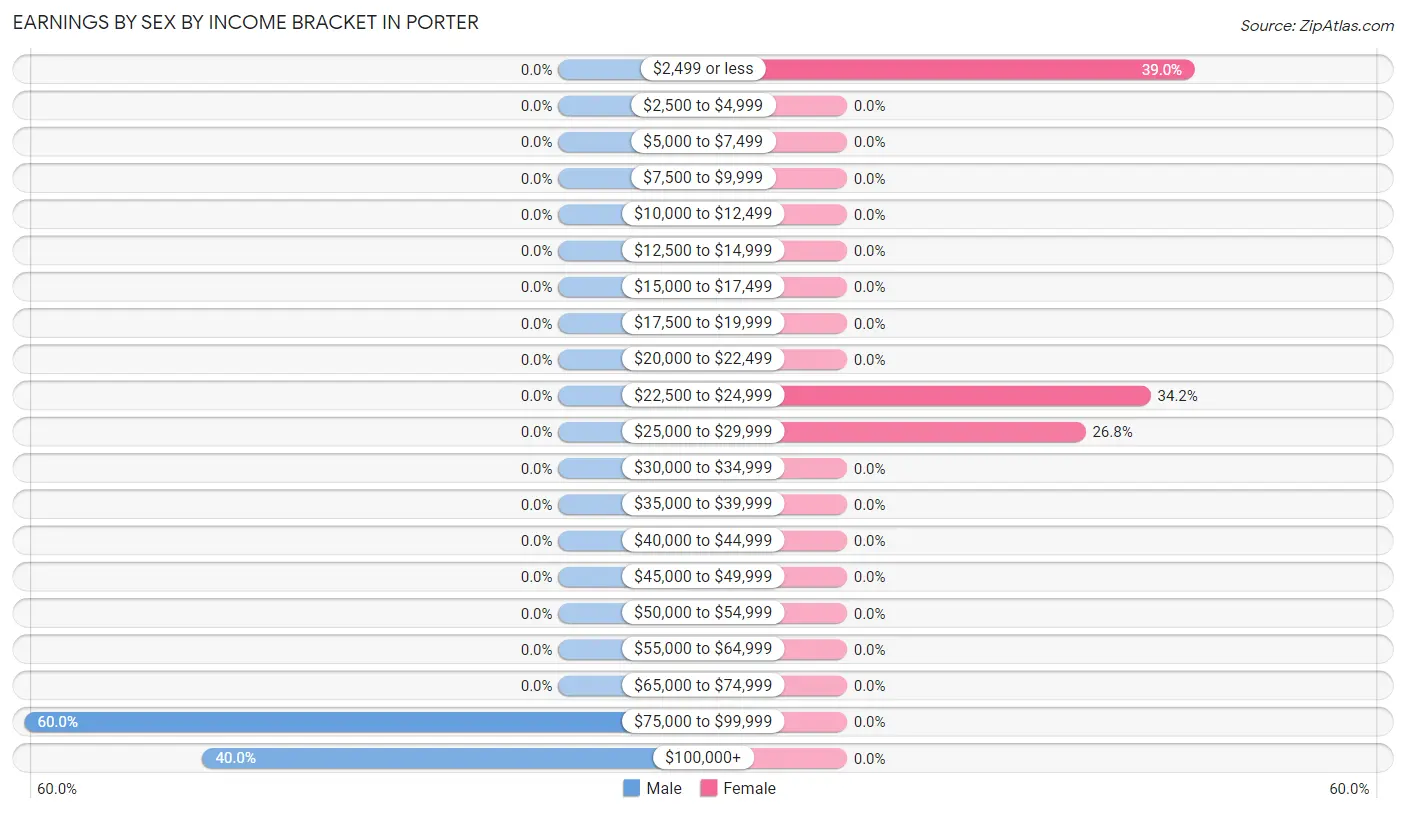
Earnings by Sex by Income Bracket in Porter
The most common earnings brackets in Porter are $75,000 to $99,999 for men (15 | 60.0%) and $2,499 or less for women (16 | 39.0%).
| Income | Male | Female |
| $2,499 or less | 0 (0.0%) | 16 (39.0%) |
| $2,500 to $4,999 | 0 (0.0%) | 0 (0.0%) |
| $5,000 to $7,499 | 0 (0.0%) | 0 (0.0%) |
| $7,500 to $9,999 | 0 (0.0%) | 0 (0.0%) |
| $10,000 to $12,499 | 0 (0.0%) | 0 (0.0%) |
| $12,500 to $14,999 | 0 (0.0%) | 0 (0.0%) |
| $15,000 to $17,499 | 0 (0.0%) | 0 (0.0%) |
| $17,500 to $19,999 | 0 (0.0%) | 0 (0.0%) |
| $20,000 to $22,499 | 0 (0.0%) | 0 (0.0%) |
| $22,500 to $24,999 | 0 (0.0%) | 14 (34.2%) |
| $25,000 to $29,999 | 0 (0.0%) | 11 (26.8%) |
| $30,000 to $34,999 | 0 (0.0%) | 0 (0.0%) |
| $35,000 to $39,999 | 0 (0.0%) | 0 (0.0%) |
| $40,000 to $44,999 | 0 (0.0%) | 0 (0.0%) |
| $45,000 to $49,999 | 0 (0.0%) | 0 (0.0%) |
| $50,000 to $54,999 | 0 (0.0%) | 0 (0.0%) |
| $55,000 to $64,999 | 0 (0.0%) | 0 (0.0%) |
| $65,000 to $74,999 | 0 (0.0%) | 0 (0.0%) |
| $75,000 to $99,999 | 15 (60.0%) | 0 (0.0%) |
| $100,000+ | 10 (40.0%) | 0 (0.0%) |
| Total | 25 (100.0%) | 41 (100.0%) |
Earnings by Sex by Educational Attainment in Porter
| Educational Attainment | Male Income | Female Income |
| Less than High School | - | - |
| High School Diploma | - | - |
| College or Associate's Degree | - | - |
| Bachelor's Degree | - | - |
| Graduate Degree | - | - |
| Total | - | - |
Family Income in Porter
Family Income Brackets in Porter
According to the Porter family income data, there are 15 families falling into the $100,000 to $149,999 income range, which is the most common income bracket and makes up 25.9% of all families.
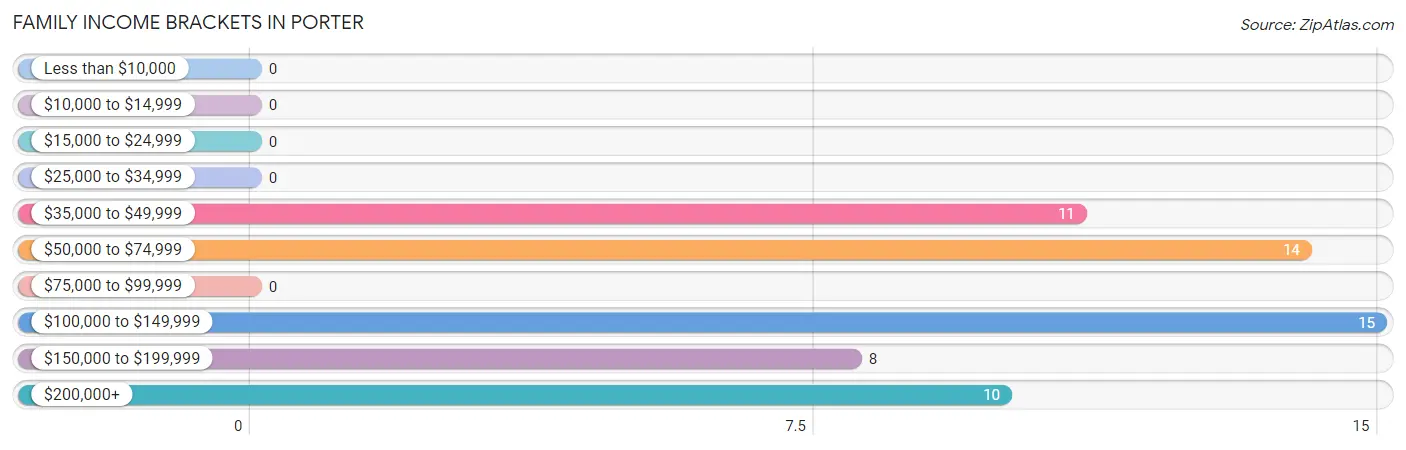
| Income Bracket | # Families | % Families |
| Less than $10,000 | 0 | 0.0% |
| $10,000 to $14,999 | 0 | 0.0% |
| $15,000 to $24,999 | 0 | 0.0% |
| $25,000 to $34,999 | 0 | 0.0% |
| $35,000 to $49,999 | 11 | 19.0% |
| $50,000 to $74,999 | 14 | 24.1% |
| $75,000 to $99,999 | 0 | 0.0% |
| $100,000 to $149,999 | 15 | 25.9% |
| $150,000 to $199,999 | 8 | 13.8% |
| $200,000+ | 10 | 17.2% |
Family Income by Famaliy Size in Porter
2-person families (50 | 86.2%) account for the highest median family income in Porter with $80,000 per family, while 2-person families (50 | 86.2%) have the highest median income of $40,000 per family member.
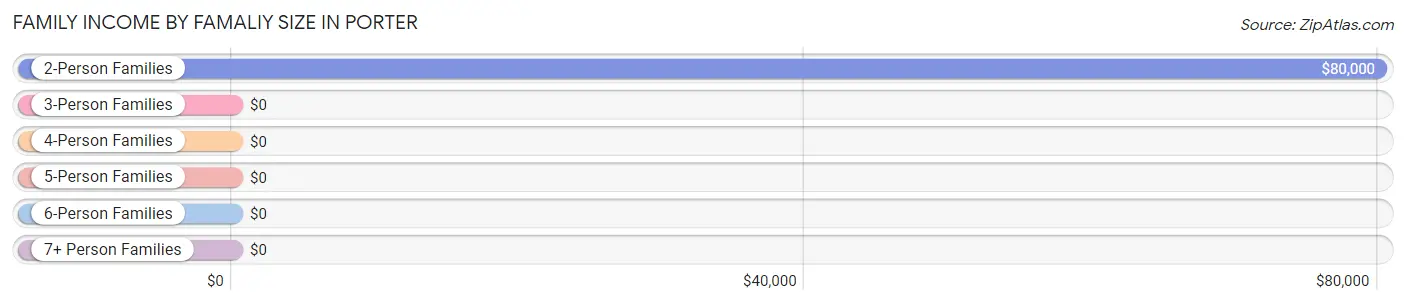
| Income Bracket | # Families | Median Income |
| 2-Person Families | 50 (86.2%) | $80,000 |
| 3-Person Families | 8 (13.8%) | $0 |
| 4-Person Families | 0 (0.0%) | $0 |
| 5-Person Families | 0 (0.0%) | $0 |
| 6-Person Families | 0 (0.0%) | $0 |
| 7+ Person Families | 0 (0.0%) | $0 |
| Total | 58 (100.0%) | $100,667 |
Family Income by Number of Earners in Porter
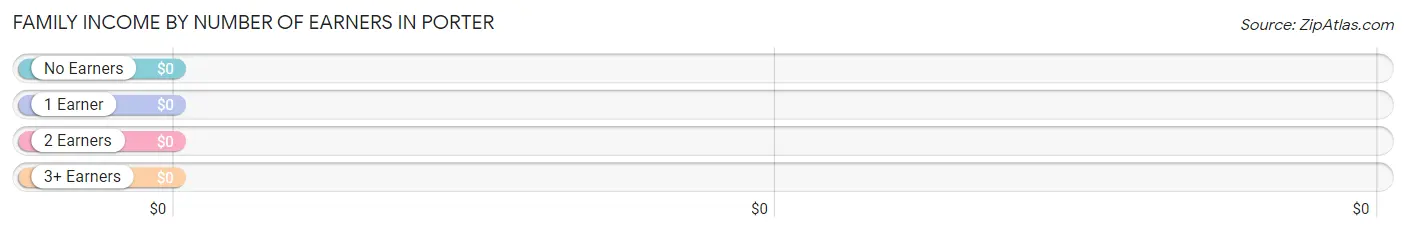
| Number of Earners | # Families | Median Income |
| No Earners | 11 (19.0%) | $0 |
| 1 Earner | 32 (55.2%) | $0 |
| 2 Earners | 15 (25.9%) | $0 |
| 3+ Earners | 0 (0.0%) | $0 |
| Total | 58 (100.0%) | $100,667 |
Household Income in Porter
Household Income Brackets in Porter
With 17 households falling in the category, the $35,000 to $49,999 income range is the most frequent in Porter, accounting for 23.0% of all households.
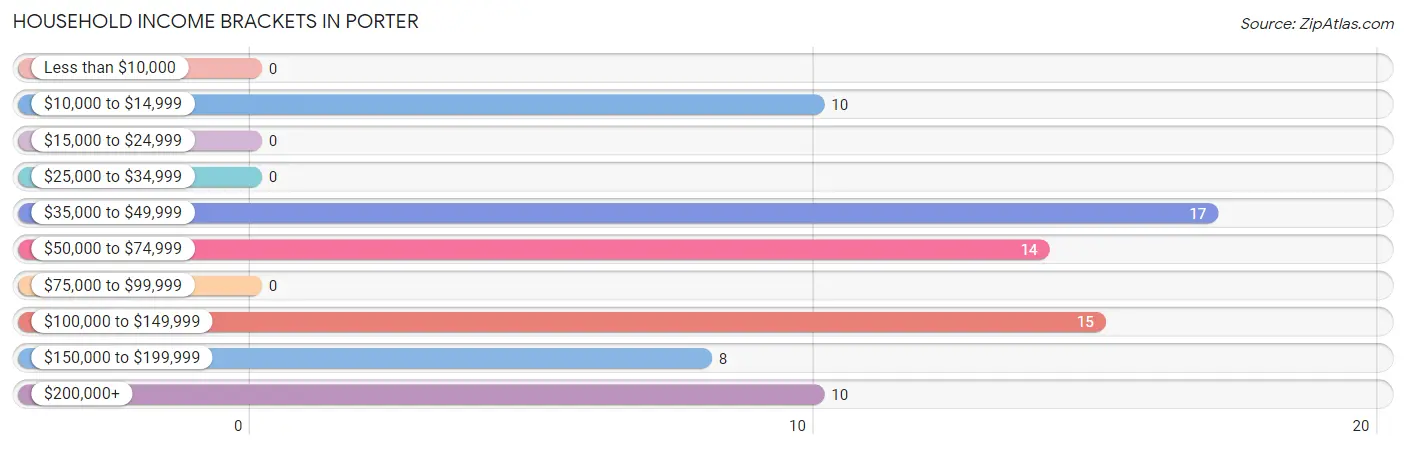
| Income Bracket | # Households | % Households |
| Less than $10,000 | 0 | 0.0% |
| $10,000 to $14,999 | 10 | 13.5% |
| $15,000 to $24,999 | 0 | 0.0% |
| $25,000 to $34,999 | 0 | 0.0% |
| $35,000 to $49,999 | 17 | 23.0% |
| $50,000 to $74,999 | 14 | 18.9% |
| $75,000 to $99,999 | 0 | 0.0% |
| $100,000 to $149,999 | 15 | 20.3% |
| $150,000 to $199,999 | 8 | 10.8% |
| $200,000+ | 10 | 13.5% |
Household Income by Householder Age in Porter
The median household income in Porter is $0, with the highest median household income of $42,386 found in the 65+ years age bracket for the primary householder. A total of 41 households (55.4%) fall into this category.
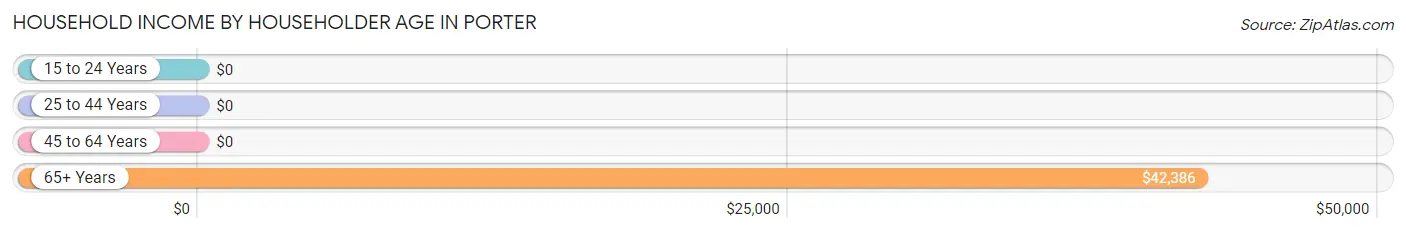
| Income Bracket | # Households | Median Income |
| 15 to 24 Years | 0 (0.0%) | $0 |
| 25 to 44 Years | 0 (0.0%) | $0 |
| 45 to 64 Years | 33 (44.6%) | $0 |
| 65+ Years | 41 (55.4%) | $42,386 |
| Total | 74 (100.0%) | $0 |
Poverty in Porter
Income Below Poverty by Sex and Age in Porter
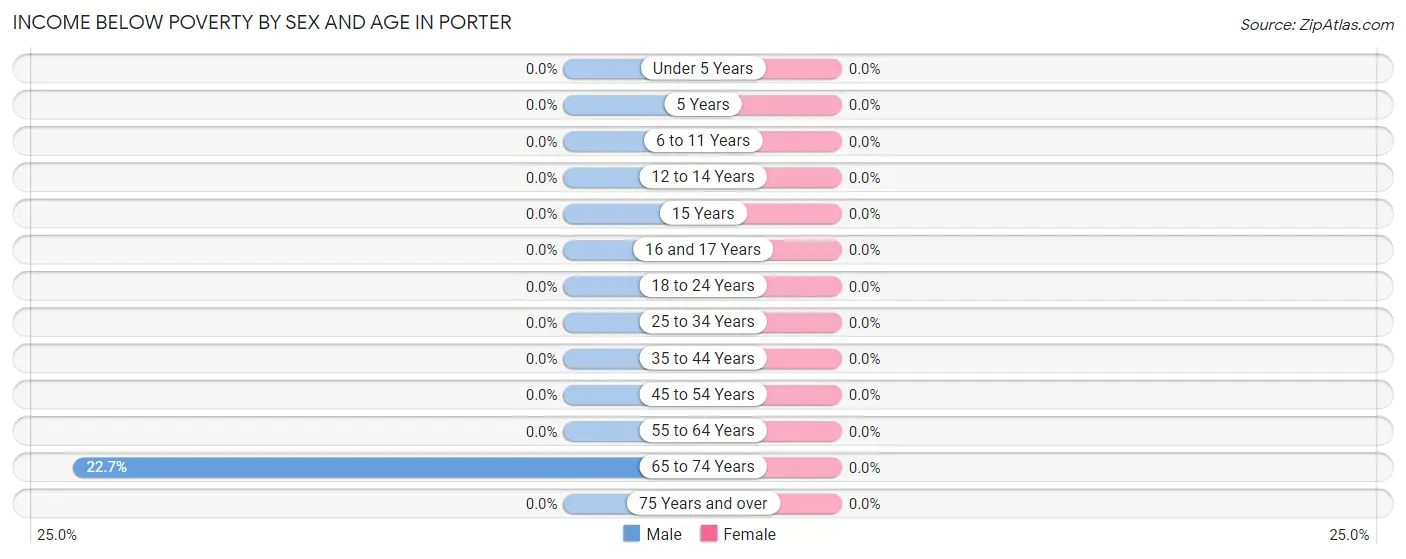
| Age Bracket | Male | Female |
| Under 5 Years | 0 (0.0%) | 0 (0.0%) |
| 5 Years | 0 (0.0%) | 0 (0.0%) |
| 6 to 11 Years | 0 (0.0%) | 0 (0.0%) |
| 12 to 14 Years | 0 (0.0%) | 0 (0.0%) |
| 15 Years | 0 (0.0%) | 0 (0.0%) |
| 16 and 17 Years | 0 (0.0%) | 0 (0.0%) |
| 18 to 24 Years | 0 (0.0%) | 0 (0.0%) |
| 25 to 34 Years | 0 (0.0%) | 0 (0.0%) |
| 35 to 44 Years | 0 (0.0%) | 0 (0.0%) |
| 45 to 54 Years | 0 (0.0%) | 0 (0.0%) |
| 55 to 64 Years | 0 (0.0%) | 0 (0.0%) |
| 65 to 74 Years | 10 (22.7%) | 0 (0.0%) |
| 75 Years and over | 0 (0.0%) | 0 (0.0%) |
| Total | 10 (13.3%) | 0 (0.0%) |
Income Above Poverty by Sex and Age in Porter
According to the poverty statistics in Porter, males aged 55 to 64 years and females aged 55 to 64 years are the age groups that are most secure financially, with 100.0% of males and 100.0% of females in these age groups living above the poverty line.
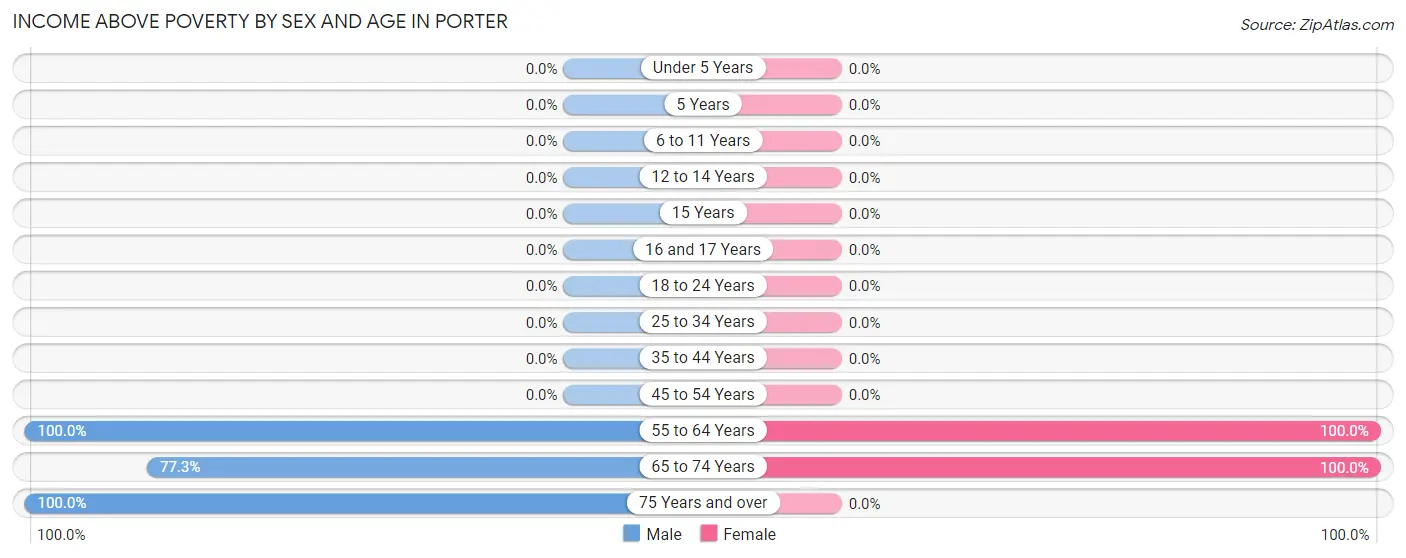
| Age Bracket | Male | Female |
| Under 5 Years | 0 (0.0%) | 0 (0.0%) |
| 5 Years | 0 (0.0%) | 0 (0.0%) |
| 6 to 11 Years | 0 (0.0%) | 0 (0.0%) |
| 12 to 14 Years | 0 (0.0%) | 0 (0.0%) |
| 15 Years | 0 (0.0%) | 0 (0.0%) |
| 16 and 17 Years | 0 (0.0%) | 0 (0.0%) |
| 18 to 24 Years | 0 (0.0%) | 0 (0.0%) |
| 25 to 34 Years | 0 (0.0%) | 0 (0.0%) |
| 35 to 44 Years | 0 (0.0%) | 0 (0.0%) |
| 45 to 54 Years | 0 (0.0%) | 0 (0.0%) |
| 55 to 64 Years | 25 (100.0%) | 45 (100.0%) |
| 65 to 74 Years | 34 (77.3%) | 26 (100.0%) |
| 75 Years and over | 6 (100.0%) | 0 (0.0%) |
| Total | 65 (86.7%) | 71 (100.0%) |
Income Below Poverty Among Married-Couple Families in Porter
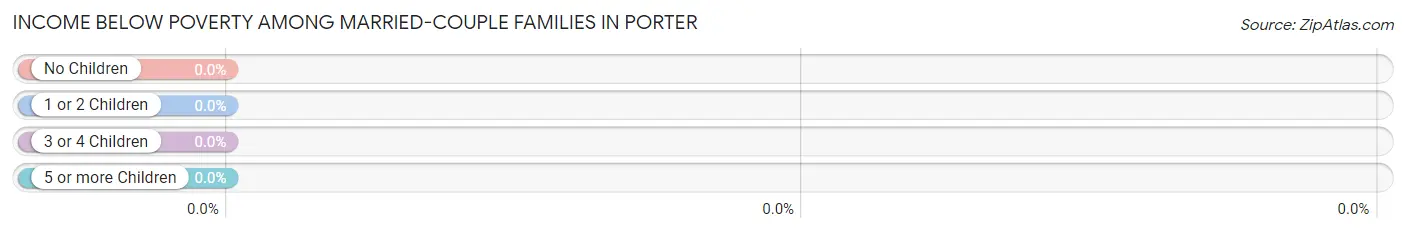
| Children | Above Poverty | Below Poverty |
| No Children | 58 (100.0%) | 0 (0.0%) |
| 1 or 2 Children | 0 (0.0%) | 0 (0.0%) |
| 3 or 4 Children | 0 (0.0%) | 0 (0.0%) |
| 5 or more Children | 0 (0.0%) | 0 (0.0%) |
| Total | 58 (100.0%) | 0 (0.0%) |
Income Below Poverty Among Single-Parent Households in Porter

| Children | Single Father | Single Mother |
| No Children | 0 (0.0%) | 0 (0.0%) |
| 1 or 2 Children | 0 (0.0%) | 0 (0.0%) |
| 3 or 4 Children | 0 (0.0%) | 0 (0.0%) |
| 5 or more Children | 0 (0.0%) | 0 (0.0%) |
| Total | 0 (0.0%) | 0 (0.0%) |
Income Below Poverty Among Married-Couple vs Single-Parent Households in Porter
| Children | Married-Couple Families | Single-Parent Households |
| No Children | 0 (0.0%) | 0 (0.0%) |
| 1 or 2 Children | 0 (0.0%) | 0 (0.0%) |
| 3 or 4 Children | 0 (0.0%) | 0 (0.0%) |
| 5 or more Children | 0 (0.0%) | 0 (0.0%) |
| Total | 0 (0.0%) | 0 (0.0%) |
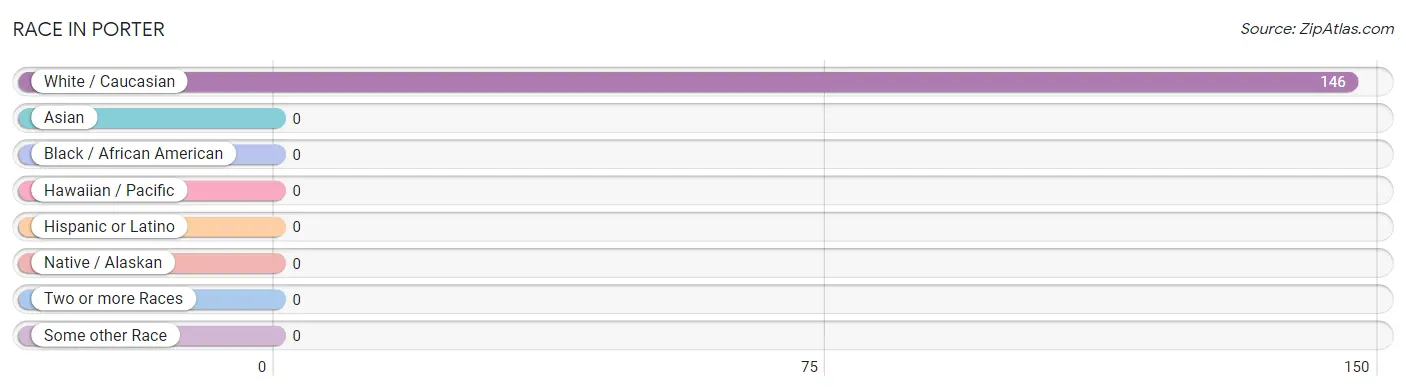
Race in Porter
The most populous races in Porter are , and White / Caucasian (146 | 100.0%).
| Race | # Population | % Population |
| Asian | 0 | 0.0% |
| Black / African American | 0 | 0.0% |
| Hawaiian / Pacific | 0 | 0.0% |
| Hispanic or Latino | 0 | 0.0% |
| Native / Alaskan | 0 | 0.0% |
| White / Caucasian | 146 | 100.0% |
| Two or more Races | 0 | 0.0% |
| Some other Race | 0 | 0.0% |
| Total | 146 | 100.0% |
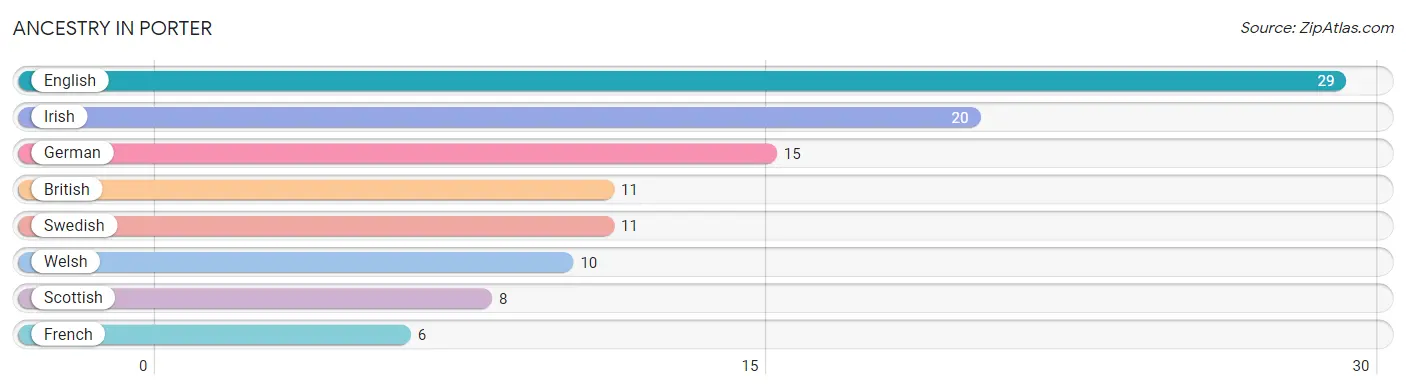
Ancestry in Porter
The most populous ancestries reported in Porter are English (29 | 19.9%), Irish (20 | 13.7%), German (15 | 10.3%), British (11 | 7.5%), and Swedish (11 | 7.5%), together accounting for 58.9% of all Porter residents.
| Ancestry | # Population | % Population |
| British | 11 | 7.5% |
| English | 29 | 19.9% |
| French | 6 | 4.1% |
| German | 15 | 10.3% |
| Irish | 20 | 13.7% |
| Scottish | 8 | 5.5% |
| Swedish | 11 | 7.5% |
| Welsh | 10 | 6.9% | View All 8 Rows |
Immigrants in Porter

| Immigration Origin | # Population | % Population | View All 0 Rows |
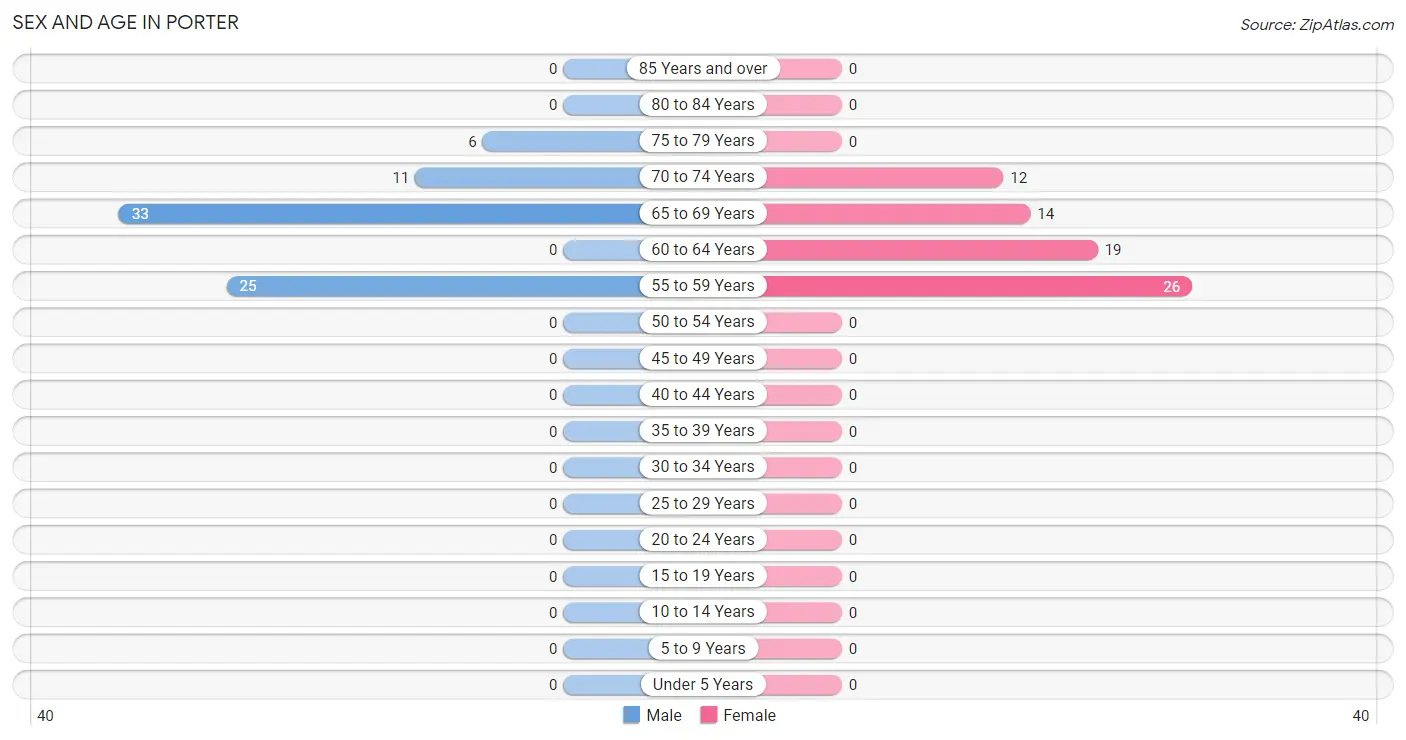
Sex and Age in Porter
Sex and Age in Porter
The most populous age groups in Porter are 65 to 69 Years (33 | 44.0%) for men and 55 to 59 Years (26 | 36.6%) for women.
| Age Bracket | Male | Female |
| Under 5 Years | 0 (0.0%) | 0 (0.0%) |
| 5 to 9 Years | 0 (0.0%) | 0 (0.0%) |
| 10 to 14 Years | 0 (0.0%) | 0 (0.0%) |
| 15 to 19 Years | 0 (0.0%) | 0 (0.0%) |
| 20 to 24 Years | 0 (0.0%) | 0 (0.0%) |
| 25 to 29 Years | 0 (0.0%) | 0 (0.0%) |
| 30 to 34 Years | 0 (0.0%) | 0 (0.0%) |
| 35 to 39 Years | 0 (0.0%) | 0 (0.0%) |
| 40 to 44 Years | 0 (0.0%) | 0 (0.0%) |
| 45 to 49 Years | 0 (0.0%) | 0 (0.0%) |
| 50 to 54 Years | 0 (0.0%) | 0 (0.0%) |
| 55 to 59 Years | 25 (33.3%) | 26 (36.6%) |
| 60 to 64 Years | 0 (0.0%) | 19 (26.8%) |
| 65 to 69 Years | 33 (44.0%) | 14 (19.7%) |
| 70 to 74 Years | 11 (14.7%) | 12 (16.9%) |
| 75 to 79 Years | 6 (8.0%) | 0 (0.0%) |
| 80 to 84 Years | 0 (0.0%) | 0 (0.0%) |
| 85 Years and over | 0 (0.0%) | 0 (0.0%) |
| Total | 75 (100.0%) | 71 (100.0%) |
Families and Households in Porter
Median Family Size in Porter
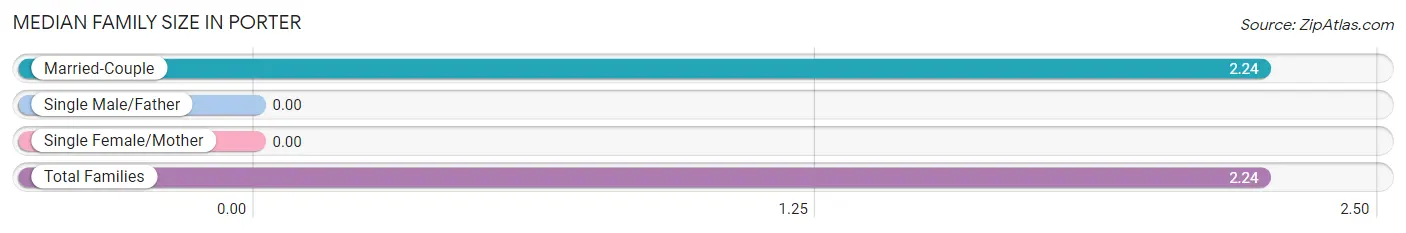
| Family Type | # Families | Family Size |
| Married-Couple | 58 (100.0%) | 2.24 |
| Single Male/Father | 0 (0.0%) | - |
| Single Female/Mother | 0 (0.0%) | - |
| Total Families | 58 (100.0%) | 2.24 |
Median Household Size in Porter
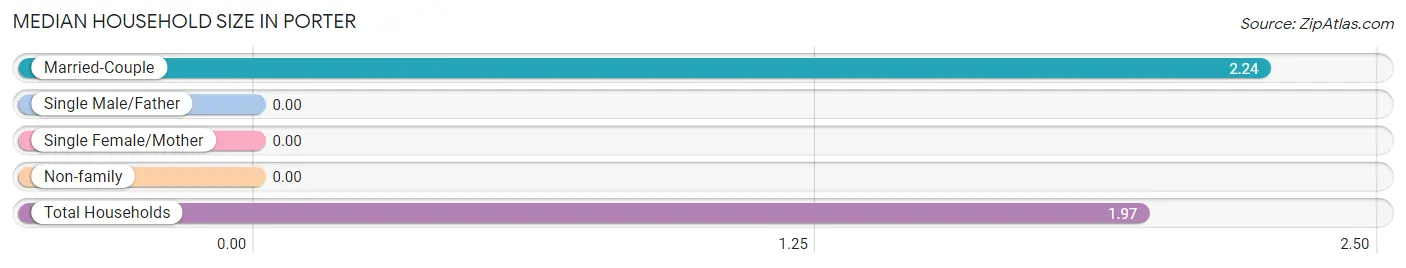
| Household Type | # Households | Household Size |
| Married-Couple | 58 (78.4%) | 2.24 |
| Single Male/Father | 0 (0.0%) | - |
| Single Female/Mother | 0 (0.0%) | - |
| Non-family | 16 (21.6%) | - |
| Total Households | 74 (100.0%) | 1.97 |
Household Size by Marriage Status in Porter
Out of a total of 74 households in Porter, 58 (78.4%) are family households, while 16 (21.6%) are nonfamily households. The most numerous type of family households are 2-person households, comprising 50, and the most common type of nonfamily households are 1-person households, comprising 16.
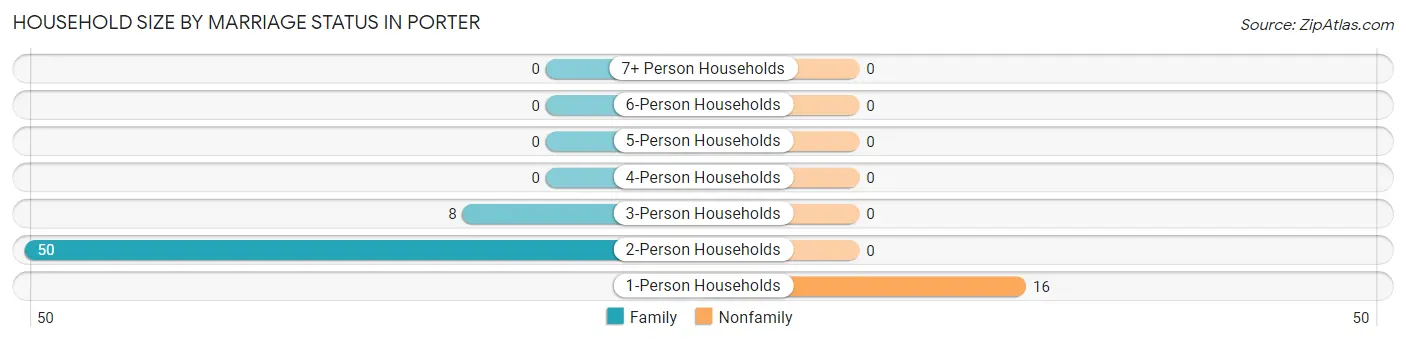
| Household Size | Family Households | Nonfamily Households |
| 1-Person Households | - | 16 (21.6%) |
| 2-Person Households | 50 (67.6%) | 0 (0.0%) |
| 3-Person Households | 8 (10.8%) | 0 (0.0%) |
| 4-Person Households | 0 (0.0%) | 0 (0.0%) |
| 5-Person Households | 0 (0.0%) | 0 (0.0%) |
| 6-Person Households | 0 (0.0%) | 0 (0.0%) |
| 7+ Person Households | 0 (0.0%) | 0 (0.0%) |
| Total | 58 (78.4%) | 16 (21.6%) |
Female Fertility in Porter
Fertility by Age in Porter
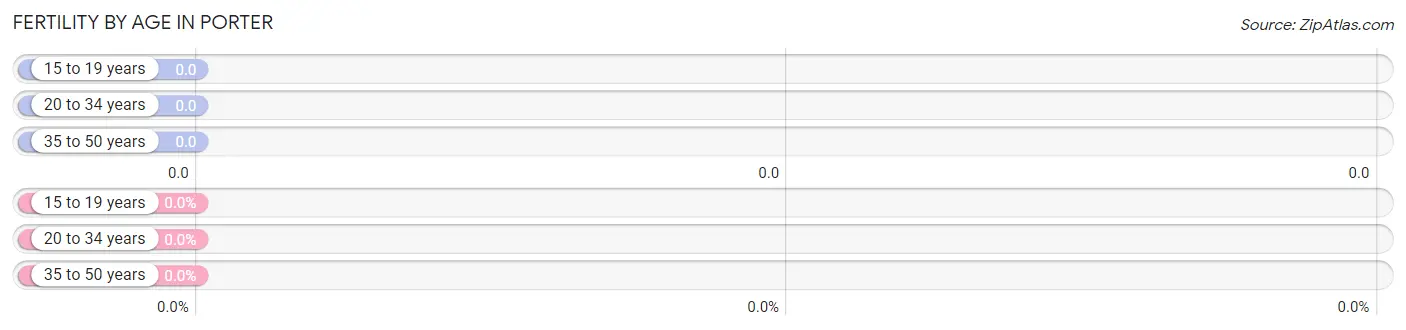
| Age Bracket | Women with Births | Births / 1,000 Women |
| 15 to 19 years | 0 (0.0%) | 0.0 |
| 20 to 34 years | 0 (0.0%) | 0.0 |
| 35 to 50 years | 0 (0.0%) | 0.0 |
| Total | 0 (0.0%) | 0.0 |
Fertility by Age by Marriage Status in Porter
| Age Bracket | Married | Unmarried |
| 15 to 19 years | 0 (0.0%) | 0 (0.0%) |
| 20 to 34 years | 0 (0.0%) | 0 (0.0%) |
| 35 to 50 years | 0 (0.0%) | 0 (0.0%) |
| Total | 0 (0.0%) | 0 (0.0%) |
Fertility by Education in Porter
| Educational Attainment | Women with Births | Births / 1,000 Women |
| Less than High School | 0 (0.0%) | 0.0 |
| High School Diploma | 0 (0.0%) | 0.0 |
| College or Associate's Degree | 0 (0.0%) | 0.0 |
| Bachelor's Degree | 0 (0.0%) | 0.0 |
| Graduate Degree | 0 (0.0%) | 0.0 |
| Total | 0 (0.0%) | 0.0 |
Fertility by Education by Marriage Status in Porter
| Educational Attainment | Married | Unmarried |
| Less than High School | 0 (0.0%) | 0 (0.0%) |
| High School Diploma | 0 (0.0%) | 0 (0.0%) |
| College or Associate's Degree | 0 (0.0%) | 0 (0.0%) |
| Bachelor's Degree | 0 (0.0%) | 0 (0.0%) |
| Graduate Degree | 0 (0.0%) | 0 (0.0%) |
| Total | 0 (0.0%) | 0 (0.0%) |
Employment Characteristics in Porter
Employment by Class of Employer in Porter
Among the 50 employed individuals in Porter, private company employees (15 | 30.0%), local government employees (14 | 28.0%), and state government employees (11 | 22.0%) make up the most common classes of employment.
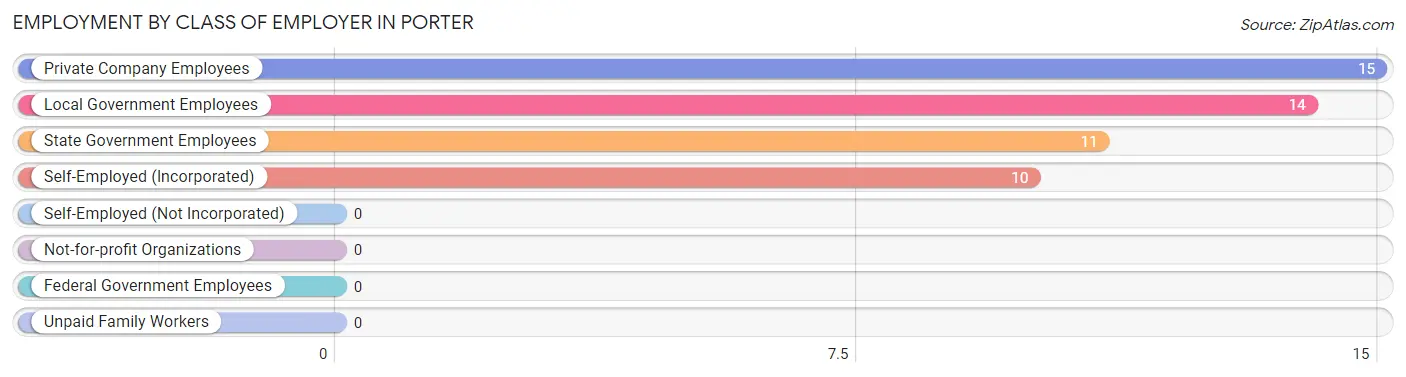
| Employer Class | # Employees | % Employees |
| Private Company Employees | 15 | 30.0% |
| Self-Employed (Incorporated) | 10 | 20.0% |
| Self-Employed (Not Incorporated) | 0 | 0.0% |
| Not-for-profit Organizations | 0 | 0.0% |
| Local Government Employees | 14 | 28.0% |
| State Government Employees | 11 | 22.0% |
| Federal Government Employees | 0 | 0.0% |
| Unpaid Family Workers | 0 | 0.0% |
| Total | 50 | 100.0% |
Employment Status by Age in Porter
According to the labor force statistics for Porter, out of the total population over 16 years of age (146), 45.2% or 66 individuals are in the labor force, with 24.2% or 16 of them unemployed. The age group with the highest labor force participation rate is 55 to 59 years, with 80.4% or 41 individuals in the labor force. Within the labor force, the 55 to 59 years age range has the highest percentage of unemployed individuals, with 39.0% or 16 of them being unemployed.
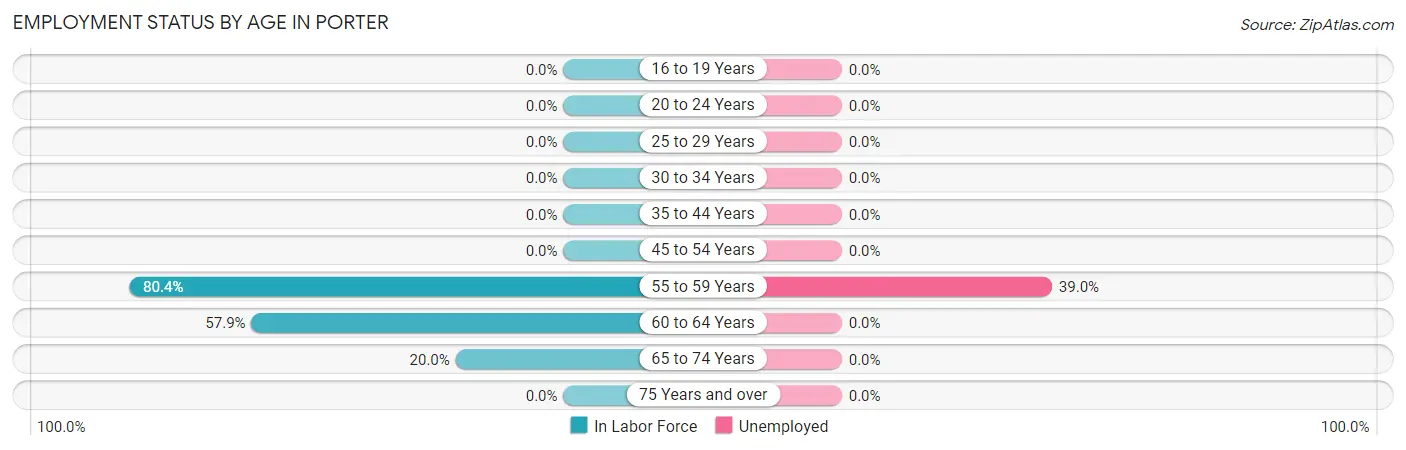
| Age Bracket | In Labor Force | Unemployed |
| 16 to 19 Years | 0 (0.0%) | 0 (0.0%) |
| 20 to 24 Years | 0 (0.0%) | 0 (0.0%) |
| 25 to 29 Years | 0 (0.0%) | 0 (0.0%) |
| 30 to 34 Years | 0 (0.0%) | 0 (0.0%) |
| 35 to 44 Years | 0 (0.0%) | 0 (0.0%) |
| 45 to 54 Years | 0 (0.0%) | 0 (0.0%) |
| 55 to 59 Years | 41 (80.4%) | 16 (39.0%) |
| 60 to 64 Years | 11 (57.9%) | 0 (0.0%) |
| 65 to 74 Years | 14 (20.0%) | 0 (0.0%) |
| 75 Years and over | 0 (0.0%) | 0 (0.0%) |
| Total | 66 (45.2%) | 16 (24.2%) |
Employment Status by Educational Attainment in Porter
According to labor force statistics for Porter, 74.3% of individuals (52) out of the total population between 25 and 64 years of age (70) are in the labor force, with 30.8% or 16 of them being unemployed. The group with the highest labor force participation rate are those with the educational attainment of high school diploma, with 100.0% or 31 individuals in the labor force. Within the labor force, individuals with high school diploma education have the highest percentage of unemployment, with 51.6% or 16 of them being unemployed.
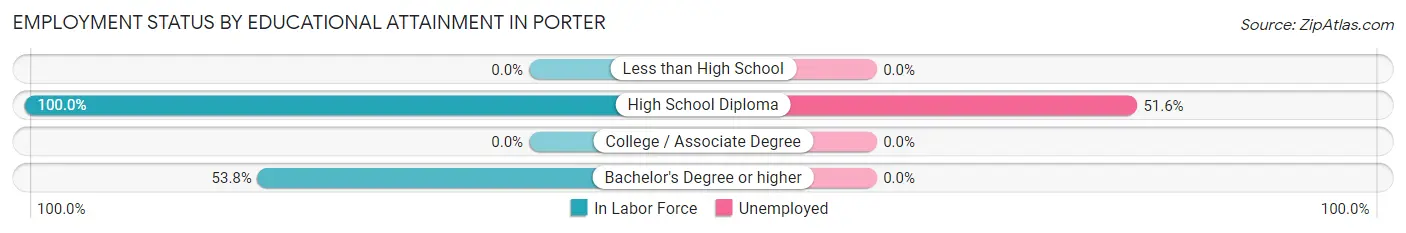
| Educational Attainment | In Labor Force | Unemployed |
| Less than High School | 0 (0.0%) | 0 (0.0%) |
| High School Diploma | 31 (100.0%) | 16 (51.6%) |
| College / Associate Degree | 0 (0.0%) | 0 (0.0%) |
| Bachelor's Degree or higher | 21 (53.8%) | 0 (0.0%) |
| Total | 52 (74.3%) | 22 (30.8%) |
Employment Occupations by Sex in Porter
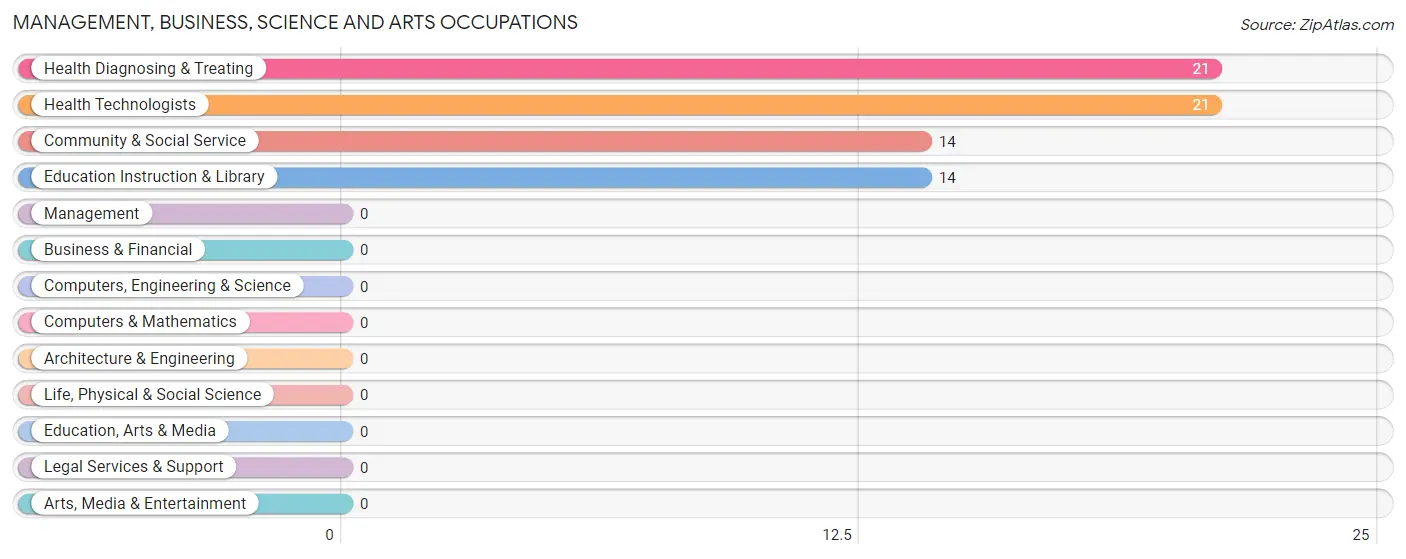
Management, Business, Science and Arts Occupations
The most common Management, Business, Science and Arts occupations in Porter are Health Diagnosing & Treating (21 | 42.0%), Health Technologists (21 | 42.0%), Community & Social Service (14 | 28.0%), and Education Instruction & Library (14 | 28.0%).
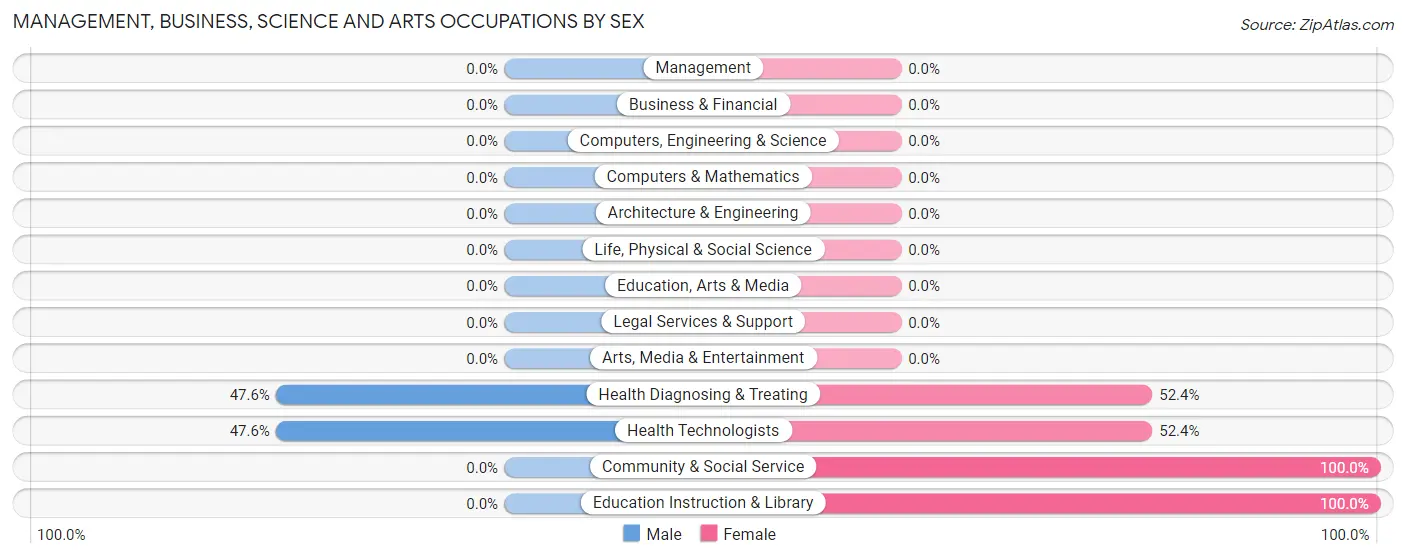
Management, Business, Science and Arts Occupations by Sex
Within the Management, Business, Science and Arts occupations in Porter, the most male-oriented occupations are Health Diagnosing & Treating (47.6%), and Health Technologists (47.6%), while the most female-oriented occupations are Community & Social Service (100.0%), Education Instruction & Library (100.0%), and Health Diagnosing & Treating (52.4%).
| Occupation | Male | Female |
| Management | 0 (0.0%) | 0 (0.0%) |
| Business & Financial | 0 (0.0%) | 0 (0.0%) |
| Computers, Engineering & Science | 0 (0.0%) | 0 (0.0%) |
| Computers & Mathematics | 0 (0.0%) | 0 (0.0%) |
| Architecture & Engineering | 0 (0.0%) | 0 (0.0%) |
| Life, Physical & Social Science | 0 (0.0%) | 0 (0.0%) |
| Community & Social Service | 0 (0.0%) | 14 (100.0%) |
| Education, Arts & Media | 0 (0.0%) | 0 (0.0%) |
| Legal Services & Support | 0 (0.0%) | 0 (0.0%) |
| Education Instruction & Library | 0 (0.0%) | 14 (100.0%) |
| Arts, Media & Entertainment | 0 (0.0%) | 0 (0.0%) |
| Health Diagnosing & Treating | 10 (47.6%) | 11 (52.4%) |
| Health Technologists | 10 (47.6%) | 11 (52.4%) |
| Total (Category) | 10 (28.6%) | 25 (71.4%) |
| Total (Overall) | 25 (50.0%) | 25 (50.0%) |
Services Occupations
Services Occupations by Sex
| Occupation | Male | Female |
| Healthcare Support | 0 (0.0%) | 0 (0.0%) |
| Security & Protection | 0 (0.0%) | 0 (0.0%) |
| Firefighting & Prevention | 0 (0.0%) | 0 (0.0%) |
| Law Enforcement | 0 (0.0%) | 0 (0.0%) |
| Food Preparation & Serving | 0 (0.0%) | 0 (0.0%) |
| Cleaning & Maintenance | 0 (0.0%) | 0 (0.0%) |
| Personal Care & Service | 0 (0.0%) | 0 (0.0%) |
| Total (Category) | 0 (0.0%) | 0 (0.0%) |
| Total (Overall) | 25 (50.0%) | 25 (50.0%) |
Sales and Office Occupations
Sales and Office Occupations by Sex
| Occupation | Male | Female |
| Sales & Related | 0 (0.0%) | 0 (0.0%) |
| Office & Administration | 0 (0.0%) | 0 (0.0%) |
| Total (Category) | 0 (0.0%) | 0 (0.0%) |
| Total (Overall) | 25 (50.0%) | 25 (50.0%) |
Natural Resources, Construction and Maintenance Occupations
The most common Natural Resources, Construction and Maintenance occupations in Porter are , and Construction & Extraction (15 | 30.0%).
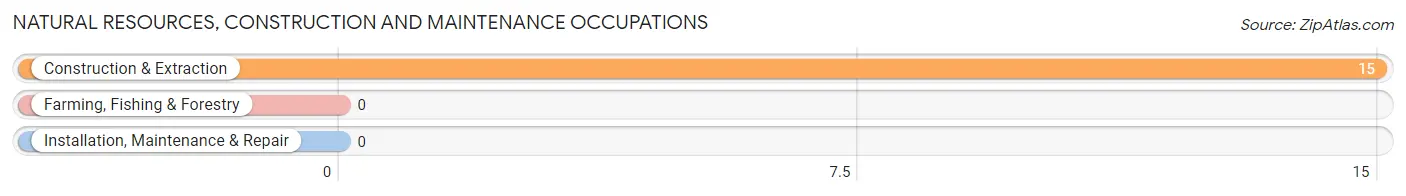
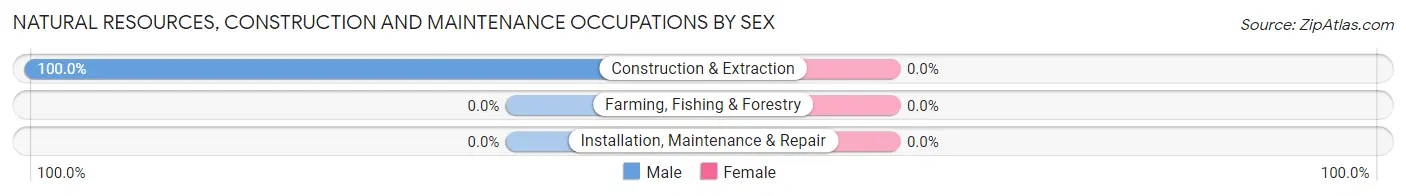
Natural Resources, Construction and Maintenance Occupations by Sex
| Occupation | Male | Female |
| Farming, Fishing & Forestry | 0 (0.0%) | 0 (0.0%) |
| Construction & Extraction | 15 (100.0%) | 0 (0.0%) |
| Installation, Maintenance & Repair | 0 (0.0%) | 0 (0.0%) |
| Total (Category) | 15 (100.0%) | 0 (0.0%) |
| Total (Overall) | 25 (50.0%) | 25 (50.0%) |
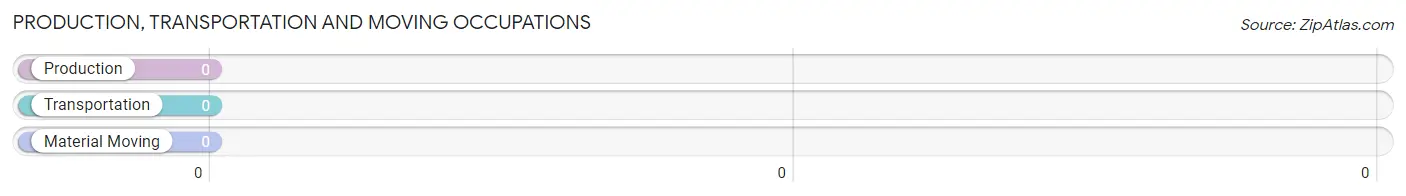
Production, Transportation and Moving Occupations
Production, Transportation and Moving Occupations by Sex
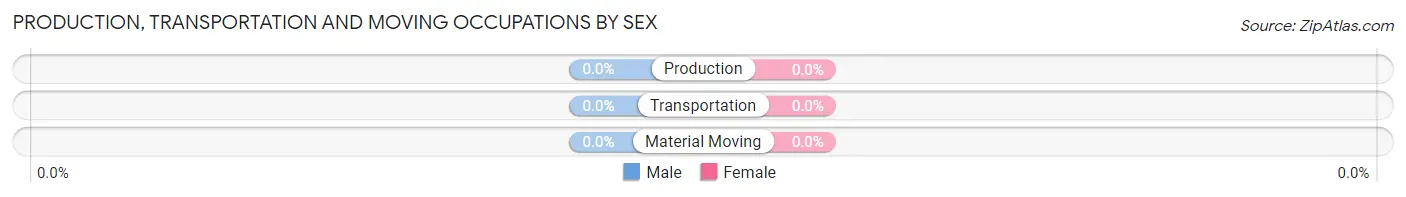
| Occupation | Male | Female |
| Production | 0 (0.0%) | 0 (0.0%) |
| Transportation | 0 (0.0%) | 0 (0.0%) |
| Material Moving | 0 (0.0%) | 0 (0.0%) |
| Total (Category) | 0 (0.0%) | 0 (0.0%) |
| Total (Overall) | 25 (50.0%) | 25 (50.0%) |
Employment Industries by Sex in Porter
Employment Industries in Porter
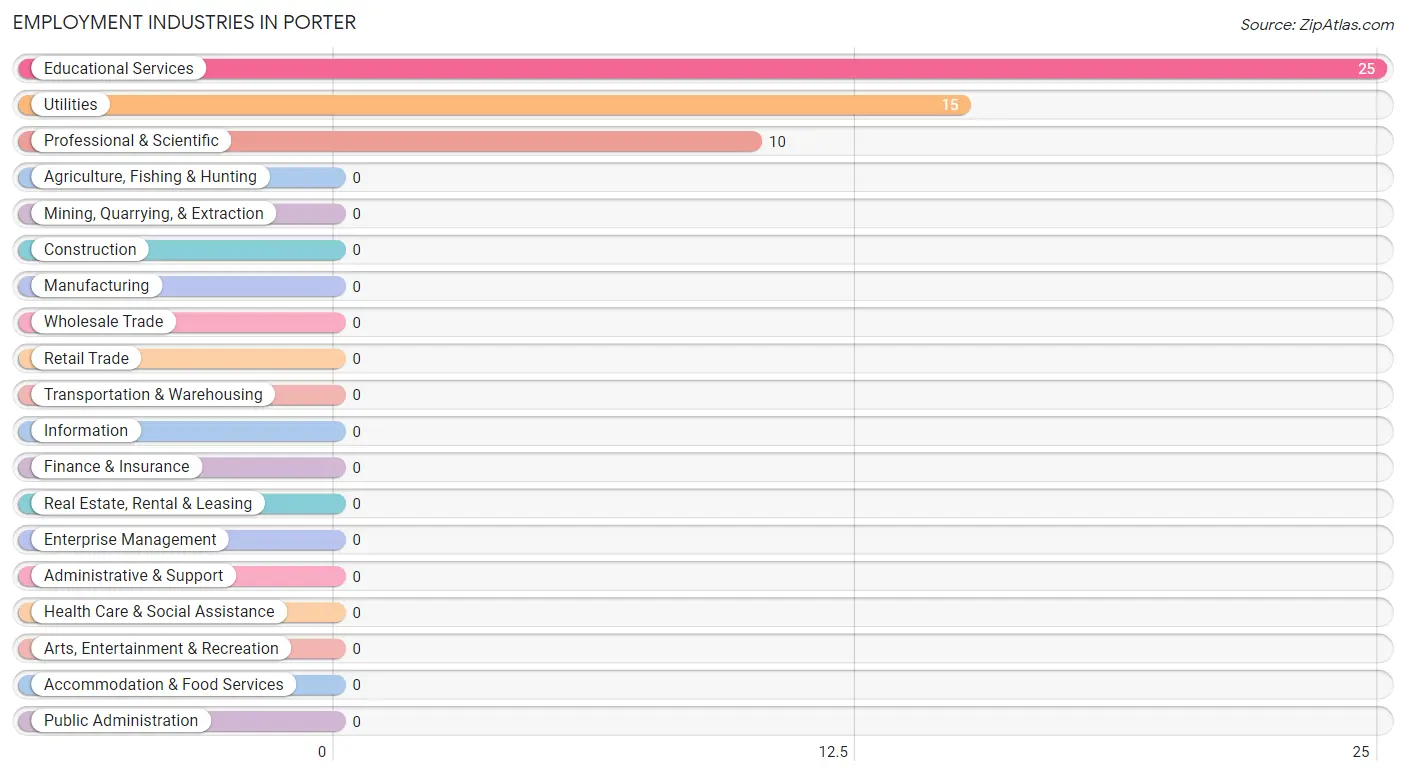
The major employment industries in Porter include Educational Services (25 | 50.0%), Utilities (15 | 30.0%), and Professional & Scientific (10 | 20.0%).
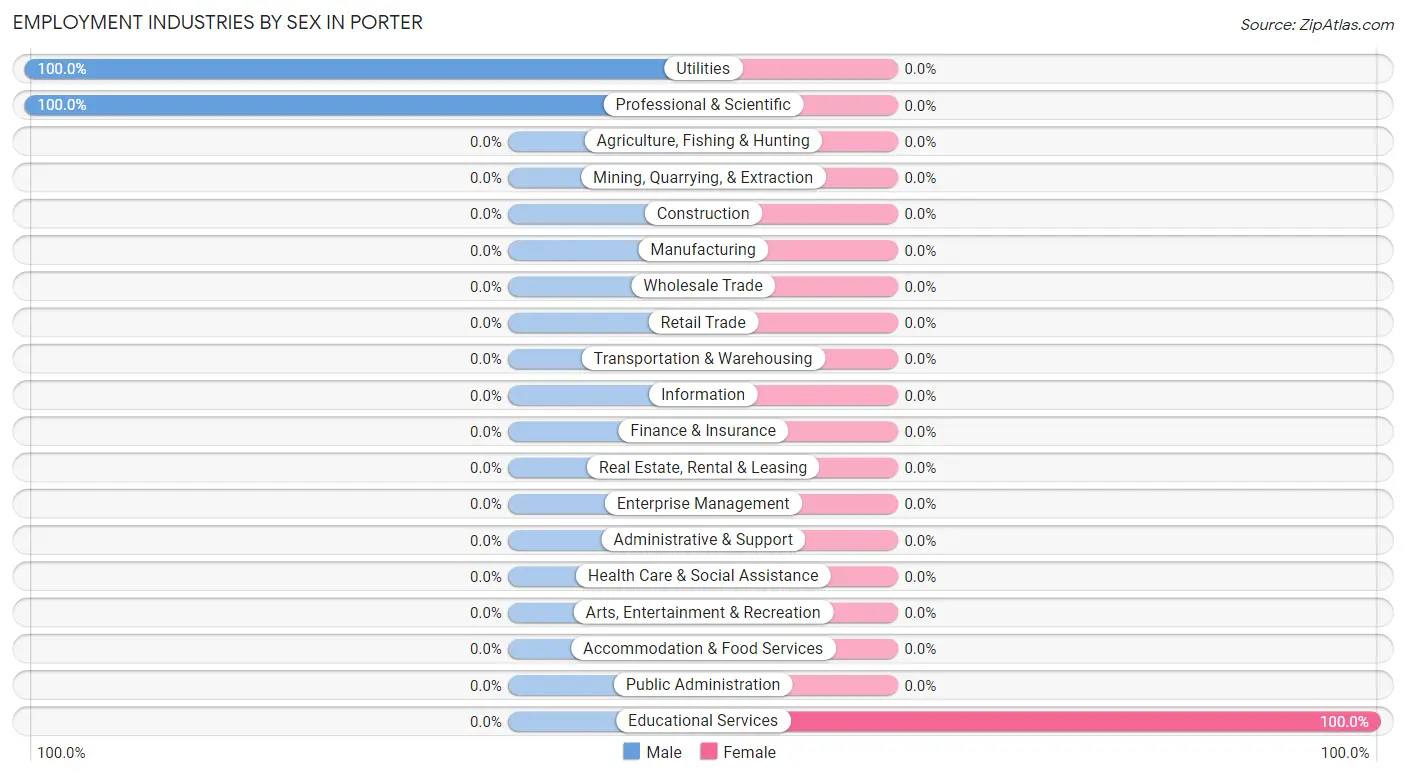
Employment Industries by Sex in Porter
| Industry | Male | Female |
| Agriculture, Fishing & Hunting | 0 (0.0%) | 0 (0.0%) |
| Mining, Quarrying, & Extraction | 0 (0.0%) | 0 (0.0%) |
| Construction | 0 (0.0%) | 0 (0.0%) |
| Manufacturing | 0 (0.0%) | 0 (0.0%) |
| Wholesale Trade | 0 (0.0%) | 0 (0.0%) |
| Retail Trade | 0 (0.0%) | 0 (0.0%) |
| Transportation & Warehousing | 0 (0.0%) | 0 (0.0%) |
| Utilities | 15 (100.0%) | 0 (0.0%) |
| Information | 0 (0.0%) | 0 (0.0%) |
| Finance & Insurance | 0 (0.0%) | 0 (0.0%) |
| Real Estate, Rental & Leasing | 0 (0.0%) | 0 (0.0%) |
| Professional & Scientific | 10 (100.0%) | 0 (0.0%) |
| Enterprise Management | 0 (0.0%) | 0 (0.0%) |
| Administrative & Support | 0 (0.0%) | 0 (0.0%) |
| Educational Services | 0 (0.0%) | 25 (100.0%) |
| Health Care & Social Assistance | 0 (0.0%) | 0 (0.0%) |
| Arts, Entertainment & Recreation | 0 (0.0%) | 0 (0.0%) |
| Accommodation & Food Services | 0 (0.0%) | 0 (0.0%) |
| Public Administration | 0 (0.0%) | 0 (0.0%) |
| Total | 25 (50.0%) | 25 (50.0%) |
Education in Porter
School Enrollment in Porter
| School Level | # Students | % Students |
| Nursery / Preschool | 0 | 0.0% |
| Kindergarten | 0 | 0.0% |
| Elementary School | 0 | 0.0% |
| Middle School | 0 | 0.0% |
| High School | 0 | 0.0% |
| College / Undergraduate | 0 | 0.0% |
| Graduate / Professional | 0 | 0.0% |
| Total | 0 | 0.0% |
School Enrollment by Age by Funding Source in Porter
| Age Bracket | Public School | Private School |
| 3 to 4 Year Olds | 0 (0.0%) | 0 (0.0%) |
| 5 to 9 Year Old | 0 (0.0%) | 0 (0.0%) |
| 10 to 14 Year Olds | 0 (0.0%) | 0 (0.0%) |
| 15 to 17 Year Olds | 0 (0.0%) | 0 (0.0%) |
| 18 to 19 Year Olds | 0 (0.0%) | 0 (0.0%) |
| 20 to 24 Year Olds | 0 (0.0%) | 0 (0.0%) |
| 25 to 34 Year Olds | 0 (0.0%) | 0 (0.0%) |
| 35 Years and over | 0 (0.0%) | 0 (0.0%) |
| Total | 0 (0.0%) | 0 (0.0%) |
Educational Attainment by Field of Study in Porter
Bio, nature & agricultural (20 | 34.5%), liberal arts & history (11 | 19.0%), literature & languages (10 | 17.2%), education (9 | 15.5%), and psychology (8 | 13.8%) are the most common fields of study among 58 individuals in Porter who have obtained a bachelor's degree or higher.
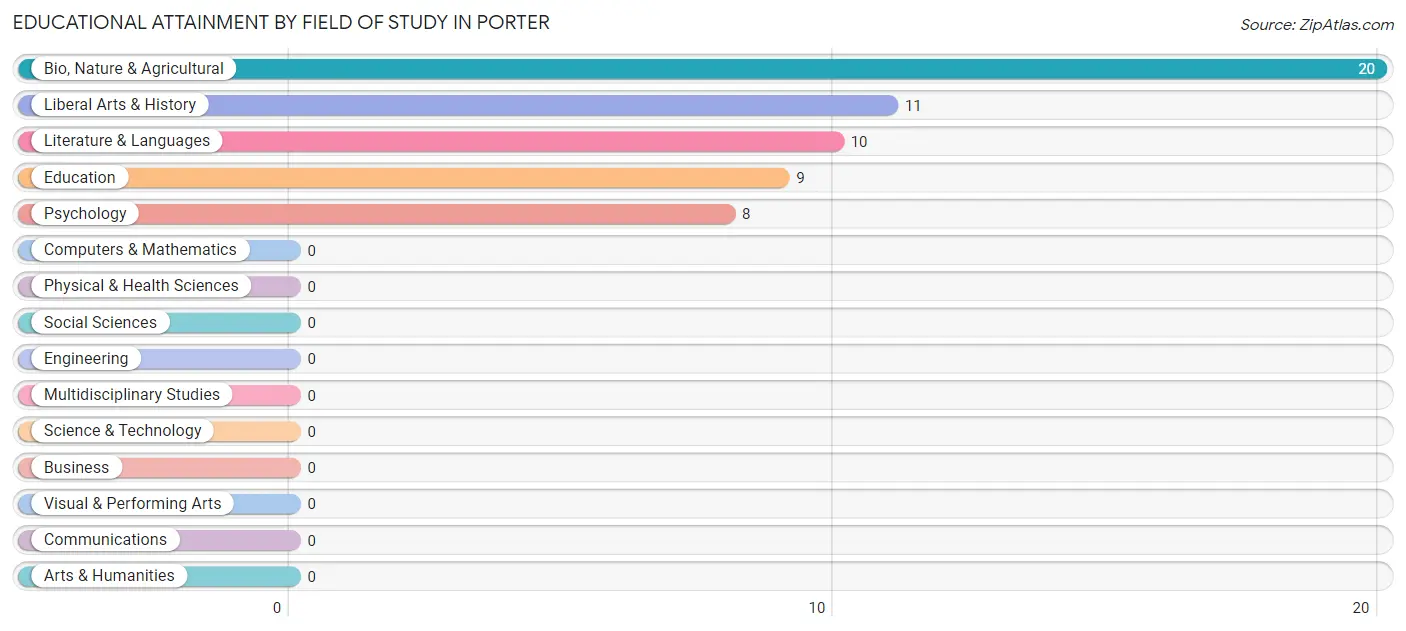
| Field of Study | # Graduates | % Graduates |
| Computers & Mathematics | 0 | 0.0% |
| Bio, Nature & Agricultural | 20 | 34.5% |
| Physical & Health Sciences | 0 | 0.0% |
| Psychology | 8 | 13.8% |
| Social Sciences | 0 | 0.0% |
| Engineering | 0 | 0.0% |
| Multidisciplinary Studies | 0 | 0.0% |
| Science & Technology | 0 | 0.0% |
| Business | 0 | 0.0% |
| Education | 9 | 15.5% |
| Literature & Languages | 10 | 17.2% |
| Liberal Arts & History | 11 | 19.0% |
| Visual & Performing Arts | 0 | 0.0% |
| Communications | 0 | 0.0% |
| Arts & Humanities | 0 | 0.0% |
| Total | 58 | 100.0% |
Transportation & Commute in Porter
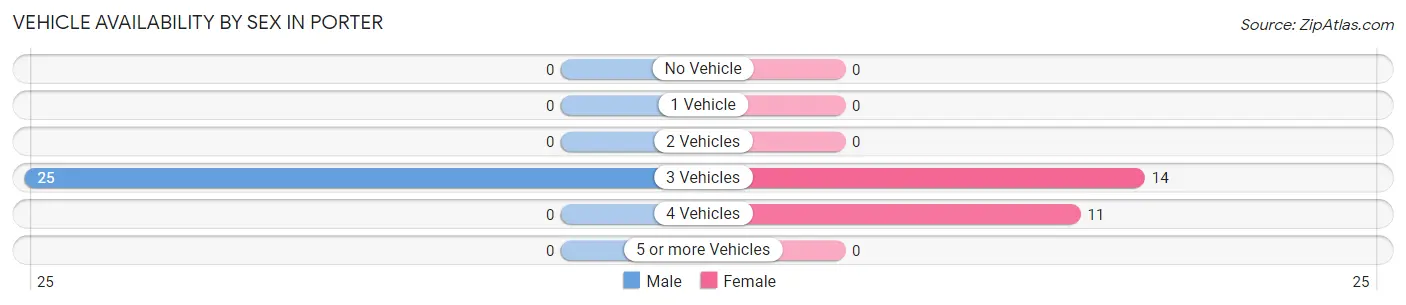
Vehicle Availability by Sex in Porter
The most prevalent vehicle ownership categories in Porter are males with 3 vehicles (25, accounting for 100.0%) and females with 3 vehicles (14, making up 100.0%).
| Vehicles Available | Male | Female |
| No Vehicle | 0 (0.0%) | 0 (0.0%) |
| 1 Vehicle | 0 (0.0%) | 0 (0.0%) |
| 2 Vehicles | 0 (0.0%) | 0 (0.0%) |
| 3 Vehicles | 25 (100.0%) | 14 (56.0%) |
| 4 Vehicles | 0 (0.0%) | 11 (44.0%) |
| 5 or more Vehicles | 0 (0.0%) | 0 (0.0%) |
| Total | 25 (100.0%) | 25 (100.0%) |
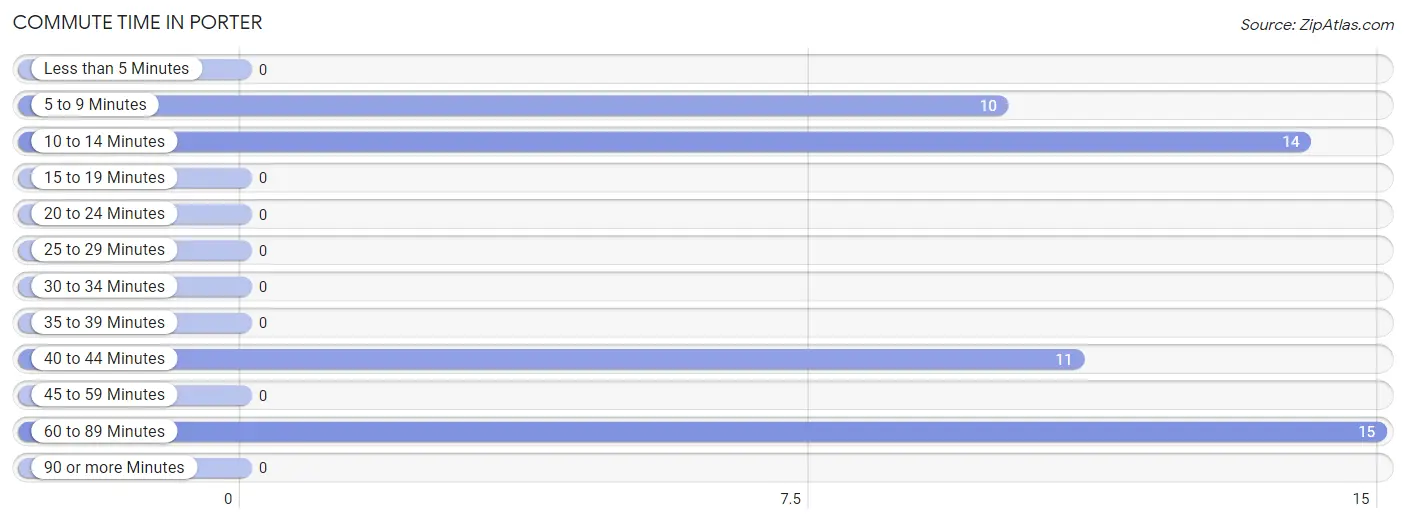
Commute Time in Porter
The most frequently occuring commute durations in Porter are 60 to 89 minutes (15 commuters, 30.0%), 10 to 14 minutes (14 commuters, 28.0%), and 40 to 44 minutes (11 commuters, 22.0%).
| Commute Time | # Commuters | % Commuters |
| Less than 5 Minutes | 0 | 0.0% |
| 5 to 9 Minutes | 10 | 20.0% |
| 10 to 14 Minutes | 14 | 28.0% |
| 15 to 19 Minutes | 0 | 0.0% |
| 20 to 24 Minutes | 0 | 0.0% |
| 25 to 29 Minutes | 0 | 0.0% |
| 30 to 34 Minutes | 0 | 0.0% |
| 35 to 39 Minutes | 0 | 0.0% |
| 40 to 44 Minutes | 11 | 22.0% |
| 45 to 59 Minutes | 0 | 0.0% |
| 60 to 89 Minutes | 15 | 30.0% |
| 90 or more Minutes | 0 | 0.0% |
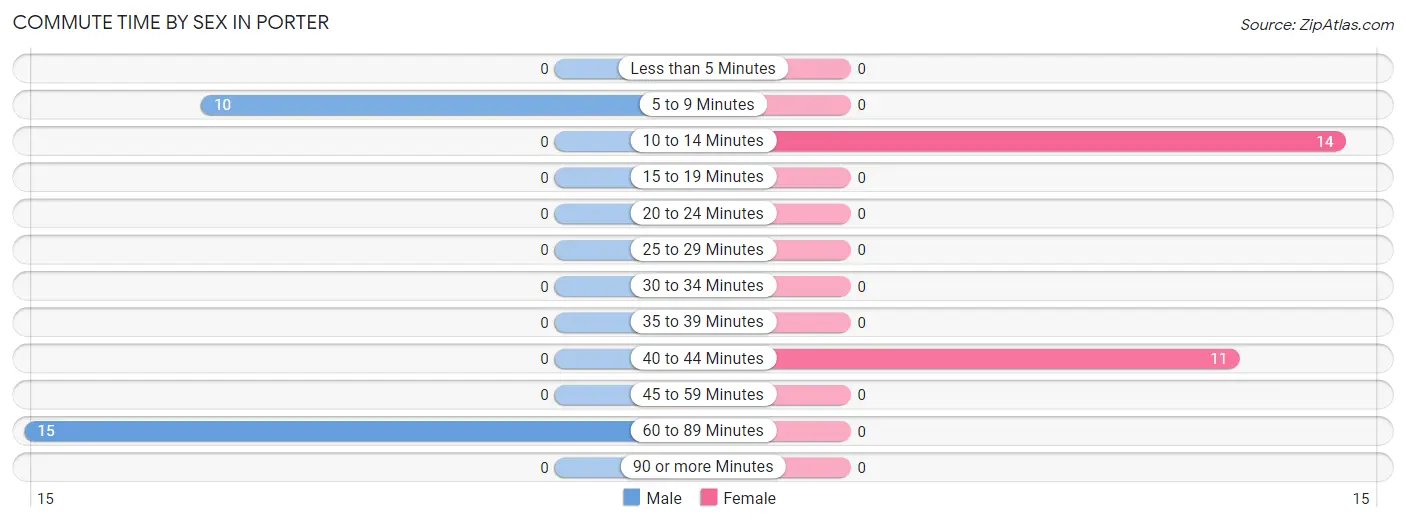
Commute Time by Sex in Porter
The most common commute times in Porter are 60 to 89 minutes (15 commuters, 60.0%) for males and 10 to 14 minutes (14 commuters, 56.0%) for females.
| Commute Time | Male | Female |
| Less than 5 Minutes | 0 (0.0%) | 0 (0.0%) |
| 5 to 9 Minutes | 10 (40.0%) | 0 (0.0%) |
| 10 to 14 Minutes | 0 (0.0%) | 14 (56.0%) |
| 15 to 19 Minutes | 0 (0.0%) | 0 (0.0%) |
| 20 to 24 Minutes | 0 (0.0%) | 0 (0.0%) |
| 25 to 29 Minutes | 0 (0.0%) | 0 (0.0%) |
| 30 to 34 Minutes | 0 (0.0%) | 0 (0.0%) |
| 35 to 39 Minutes | 0 (0.0%) | 0 (0.0%) |
| 40 to 44 Minutes | 0 (0.0%) | 11 (44.0%) |
| 45 to 59 Minutes | 0 (0.0%) | 0 (0.0%) |
| 60 to 89 Minutes | 15 (60.0%) | 0 (0.0%) |
| 90 or more Minutes | 0 (0.0%) | 0 (0.0%) |
Time of Departure to Work by Sex in Porter
The most frequent times of departure to work in Porter are 8:00 AM to 8:29 AM (15, 60.0%) for males and 9:00 AM to 9:59 AM (14, 56.0%) for females.
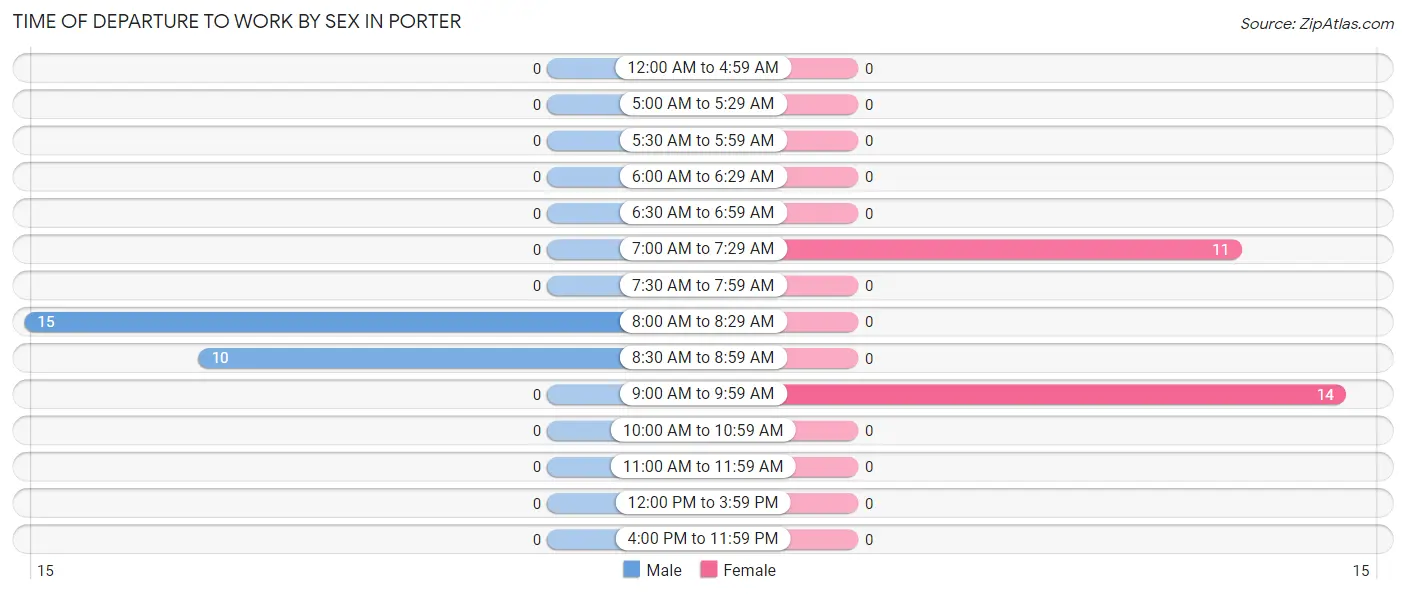
| Time of Departure | Male | Female |
| 12:00 AM to 4:59 AM | 0 (0.0%) | 0 (0.0%) |
| 5:00 AM to 5:29 AM | 0 (0.0%) | 0 (0.0%) |
| 5:30 AM to 5:59 AM | 0 (0.0%) | 0 (0.0%) |
| 6:00 AM to 6:29 AM | 0 (0.0%) | 0 (0.0%) |
| 6:30 AM to 6:59 AM | 0 (0.0%) | 0 (0.0%) |
| 7:00 AM to 7:29 AM | 0 (0.0%) | 11 (44.0%) |
| 7:30 AM to 7:59 AM | 0 (0.0%) | 0 (0.0%) |
| 8:00 AM to 8:29 AM | 15 (60.0%) | 0 (0.0%) |
| 8:30 AM to 8:59 AM | 10 (40.0%) | 0 (0.0%) |
| 9:00 AM to 9:59 AM | 0 (0.0%) | 14 (56.0%) |
| 10:00 AM to 10:59 AM | 0 (0.0%) | 0 (0.0%) |
| 11:00 AM to 11:59 AM | 0 (0.0%) | 0 (0.0%) |
| 12:00 PM to 3:59 PM | 0 (0.0%) | 0 (0.0%) |
| 4:00 PM to 11:59 PM | 0 (0.0%) | 0 (0.0%) |
| Total | 25 (100.0%) | 25 (100.0%) |
Housing Occupancy in Porter
Occupancy by Ownership in Porter
Of the total 74 dwellings in Porter, owner-occupied units account for 68 (91.9%), while renter-occupied units make up 6 (8.1%).
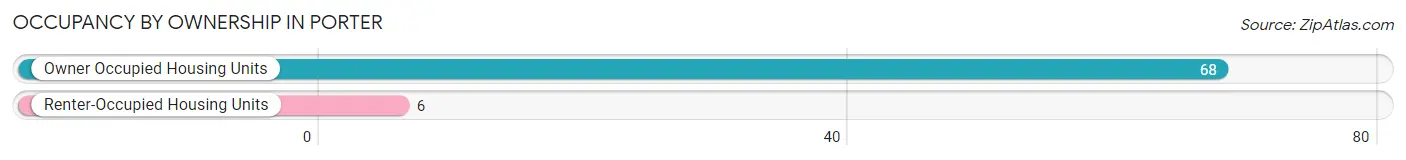
| Occupancy | # Housing Units | % Housing Units |
| Owner Occupied Housing Units | 68 | 91.9% |
| Renter-Occupied Housing Units | 6 | 8.1% |
| Total Occupied Housing Units | 74 | 100.0% |
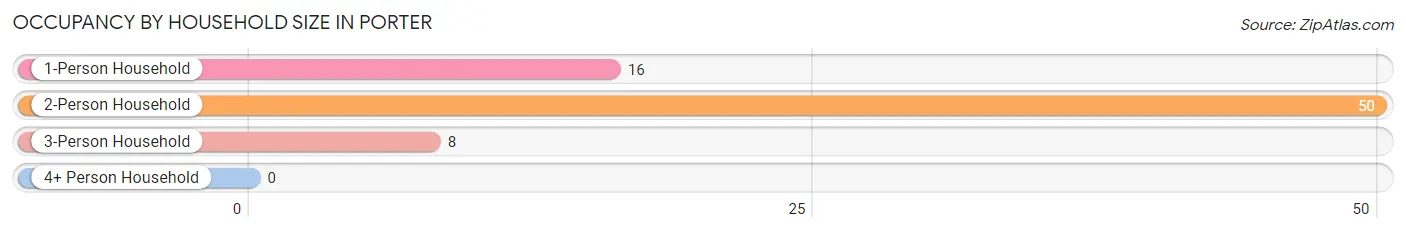
Occupancy by Household Size in Porter
| Household Size | # Housing Units | % Housing Units |
| 1-Person Household | 16 | 21.6% |
| 2-Person Household | 50 | 67.6% |
| 3-Person Household | 8 | 10.8% |
| 4+ Person Household | 0 | 0.0% |
| Total Housing Units | 74 | 100.0% |
Occupancy by Ownership by Household Size in Porter
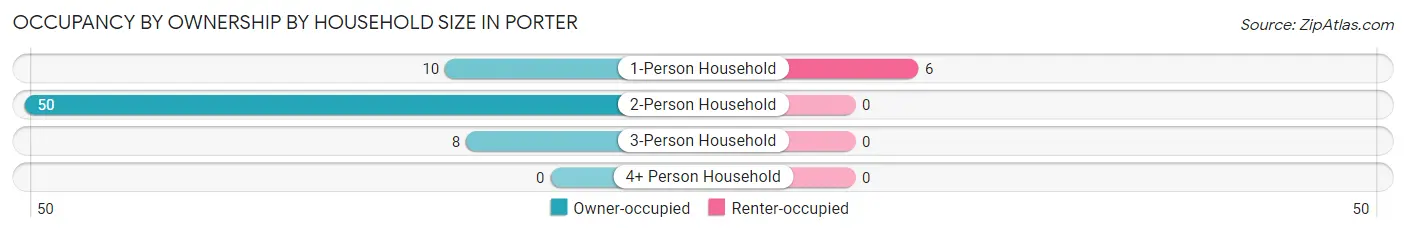
| Household Size | Owner-occupied | Renter-occupied |
| 1-Person Household | 10 (62.5%) | 6 (37.5%) |
| 2-Person Household | 50 (100.0%) | 0 (0.0%) |
| 3-Person Household | 8 (100.0%) | 0 (0.0%) |
| 4+ Person Household | 0 (0.0%) | 0 (0.0%) |
| Total Housing Units | 68 (91.9%) | 6 (8.1%) |
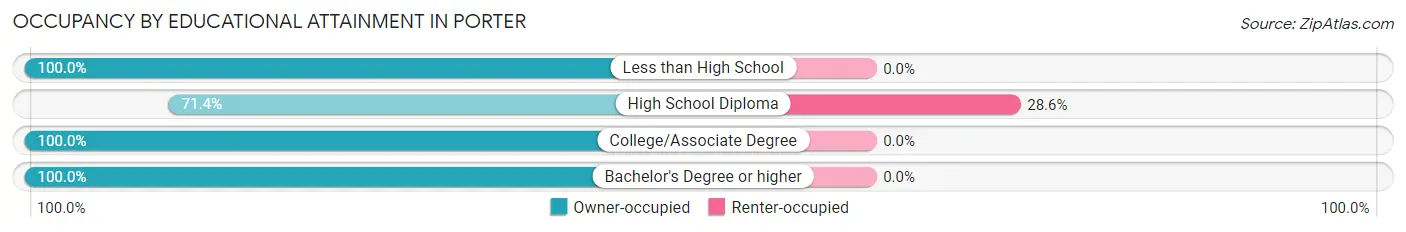
Occupancy by Educational Attainment in Porter
| Household Size | Owner-occupied | Renter-occupied |
| Less than High School | 11 (100.0%) | 0 (0.0%) |
| High School Diploma | 15 (71.4%) | 6 (28.6%) |
| College/Associate Degree | 14 (100.0%) | 0 (0.0%) |
| Bachelor's Degree or higher | 28 (100.0%) | 0 (0.0%) |
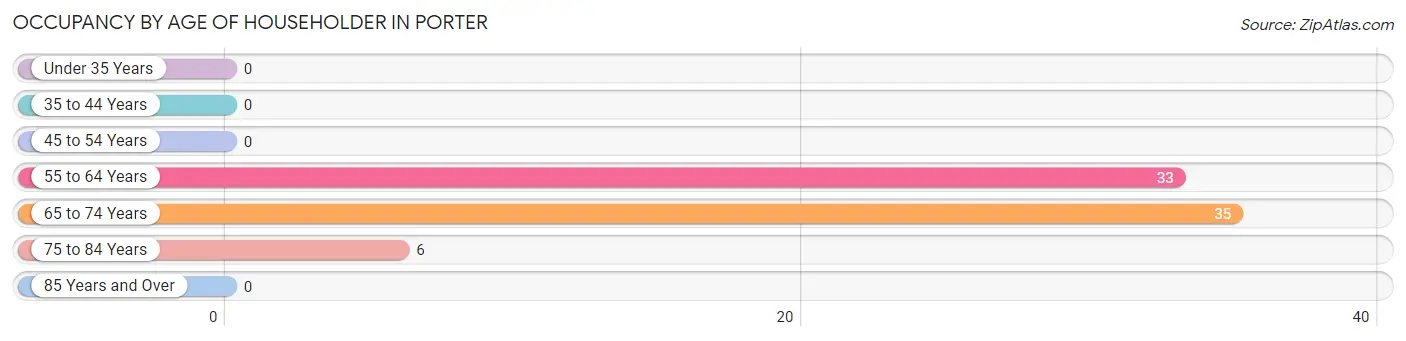
Occupancy by Age of Householder in Porter
| Age Bracket | # Households | % Households |
| Under 35 Years | 0 | 0.0% |
| 35 to 44 Years | 0 | 0.0% |
| 45 to 54 Years | 0 | 0.0% |
| 55 to 64 Years | 33 | 44.6% |
| 65 to 74 Years | 35 | 47.3% |
| 75 to 84 Years | 6 | 8.1% |
| 85 Years and Over | 0 | 0.0% |
| Total | 74 | 100.0% |
Housing Finances in Porter
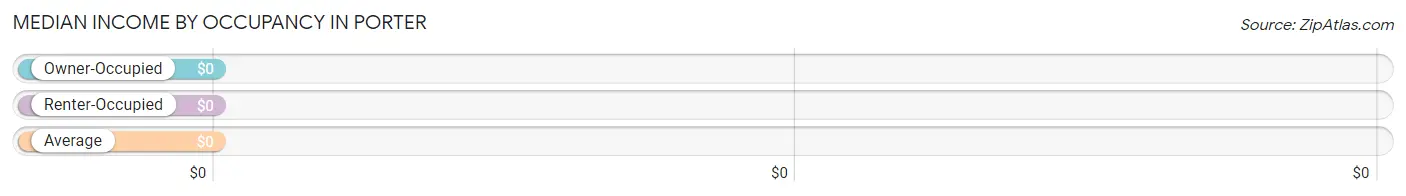
Median Income by Occupancy in Porter
| Occupancy Type | # Households | Median Income |
| Owner-Occupied | 68 (91.9%) | $0 |
| Renter-Occupied | 6 (8.1%) | $0 |
| Average | 74 (100.0%) | $0 |
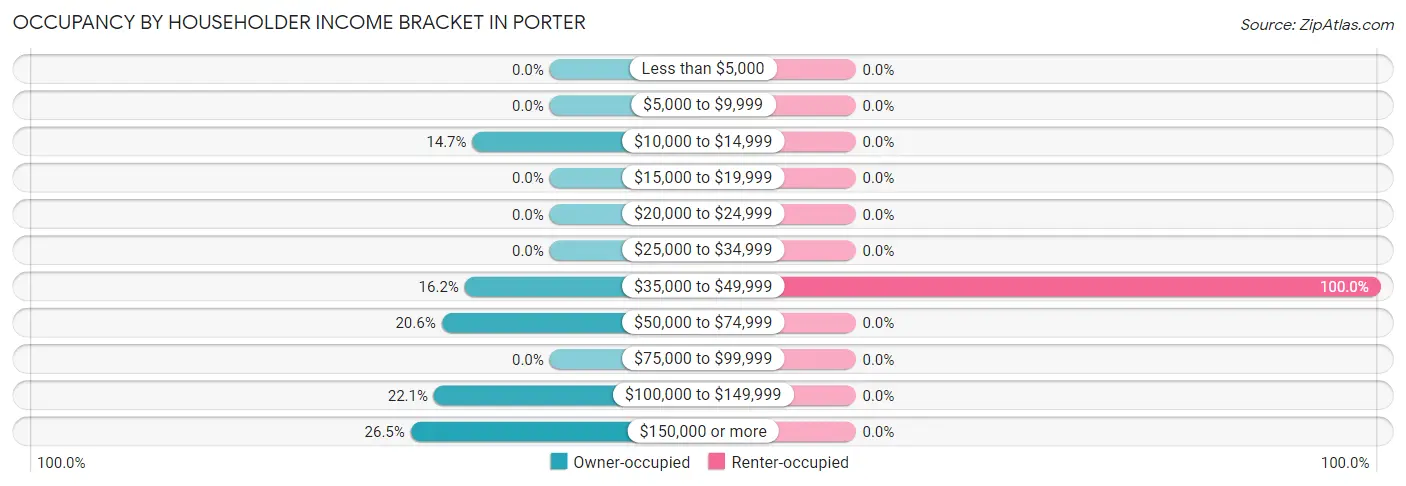
Occupancy by Householder Income Bracket in Porter
| Income Bracket | Owner-occupied | Renter-occupied |
| Less than $5,000 | 0 (0.0%) | 0 (0.0%) |
| $5,000 to $9,999 | 0 (0.0%) | 0 (0.0%) |
| $10,000 to $14,999 | 10 (14.7%) | 0 (0.0%) |
| $15,000 to $19,999 | 0 (0.0%) | 0 (0.0%) |
| $20,000 to $24,999 | 0 (0.0%) | 0 (0.0%) |
| $25,000 to $34,999 | 0 (0.0%) | 0 (0.0%) |
| $35,000 to $49,999 | 11 (16.2%) | 6 (100.0%) |
| $50,000 to $74,999 | 14 (20.6%) | 0 (0.0%) |
| $75,000 to $99,999 | 0 (0.0%) | 0 (0.0%) |
| $100,000 to $149,999 | 15 (22.1%) | 0 (0.0%) |
| $150,000 or more | 18 (26.5%) | 0 (0.0%) |
| Total | 68 (100.0%) | 6 (100.0%) |
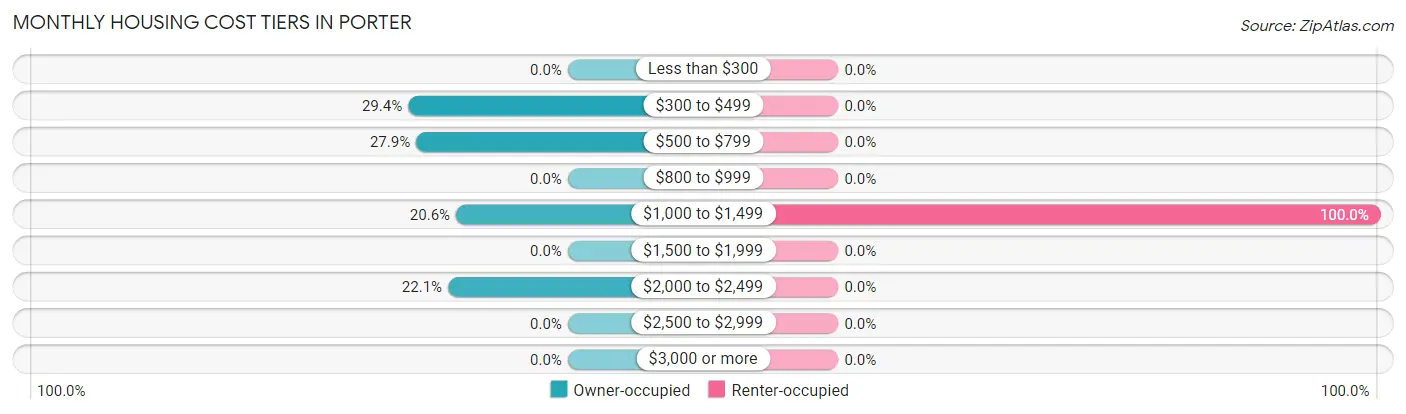
Monthly Housing Cost Tiers in Porter
| Monthly Cost | Owner-occupied | Renter-occupied |
| Less than $300 | 0 (0.0%) | 0 (0.0%) |
| $300 to $499 | 20 (29.4%) | 0 (0.0%) |
| $500 to $799 | 19 (27.9%) | 0 (0.0%) |
| $800 to $999 | 0 (0.0%) | 0 (0.0%) |
| $1,000 to $1,499 | 14 (20.6%) | 6 (100.0%) |
| $1,500 to $1,999 | 0 (0.0%) | 0 (0.0%) |
| $2,000 to $2,499 | 15 (22.1%) | 0 (0.0%) |
| $2,500 to $2,999 | 0 (0.0%) | 0 (0.0%) |
| $3,000 or more | 0 (0.0%) | 0 (0.0%) |
| Total | 68 (100.0%) | 6 (100.0%) |
Physical Housing Characteristics in Porter
Housing Structures in Porter
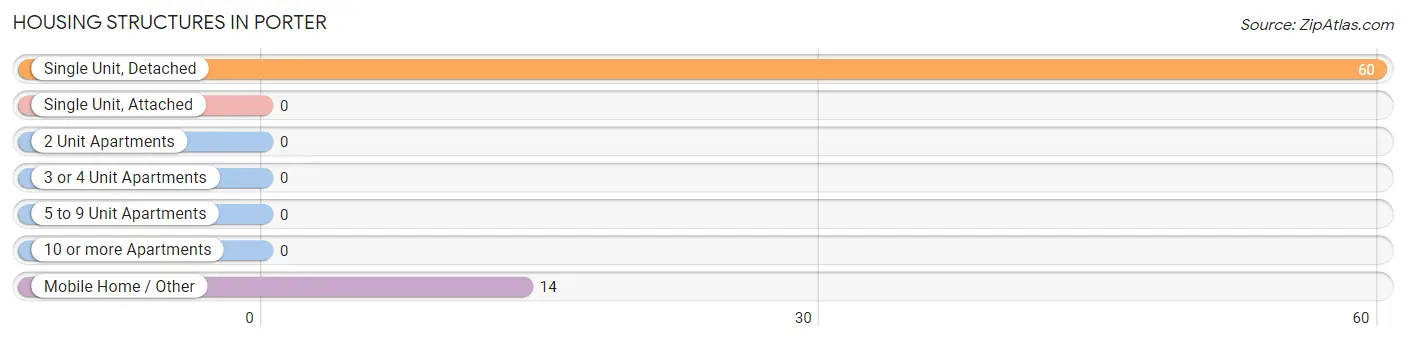
| Structure Type | # Housing Units | % Housing Units |
| Single Unit, Detached | 60 | 81.1% |
| Single Unit, Attached | 0 | 0.0% |
| 2 Unit Apartments | 0 | 0.0% |
| 3 or 4 Unit Apartments | 0 | 0.0% |
| 5 to 9 Unit Apartments | 0 | 0.0% |
| 10 or more Apartments | 0 | 0.0% |
| Mobile Home / Other | 14 | 18.9% |
| Total | 74 | 100.0% |
Housing Structures by Occupancy in Porter
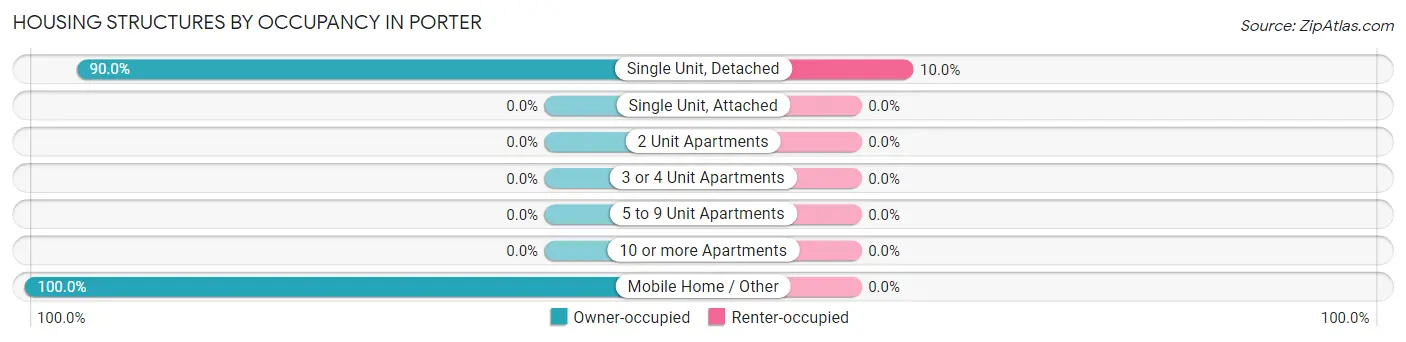
| Structure Type | Owner-occupied | Renter-occupied |
| Single Unit, Detached | 54 (90.0%) | 6 (10.0%) |
| Single Unit, Attached | 0 (0.0%) | 0 (0.0%) |
| 2 Unit Apartments | 0 (0.0%) | 0 (0.0%) |
| 3 or 4 Unit Apartments | 0 (0.0%) | 0 (0.0%) |
| 5 to 9 Unit Apartments | 0 (0.0%) | 0 (0.0%) |
| 10 or more Apartments | 0 (0.0%) | 0 (0.0%) |
| Mobile Home / Other | 14 (100.0%) | 0 (0.0%) |
| Total | 68 (91.9%) | 6 (8.1%) |
Housing Structures by Number of Rooms in Porter
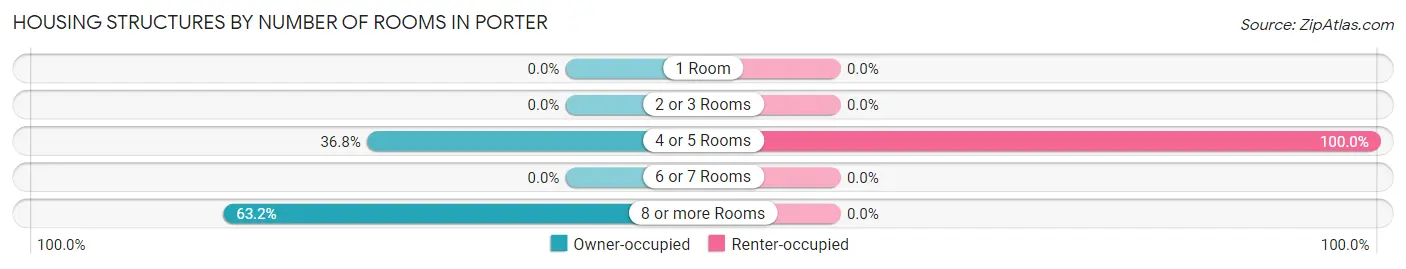
| Number of Rooms | Owner-occupied | Renter-occupied |
| 1 Room | 0 (0.0%) | 0 (0.0%) |
| 2 or 3 Rooms | 0 (0.0%) | 0 (0.0%) |
| 4 or 5 Rooms | 25 (36.8%) | 6 (100.0%) |
| 6 or 7 Rooms | 0 (0.0%) | 0 (0.0%) |
| 8 or more Rooms | 43 (63.2%) | 0 (0.0%) |
| Total | 68 (100.0%) | 6 (100.0%) |
Housing Structure by Heating Type in Porter
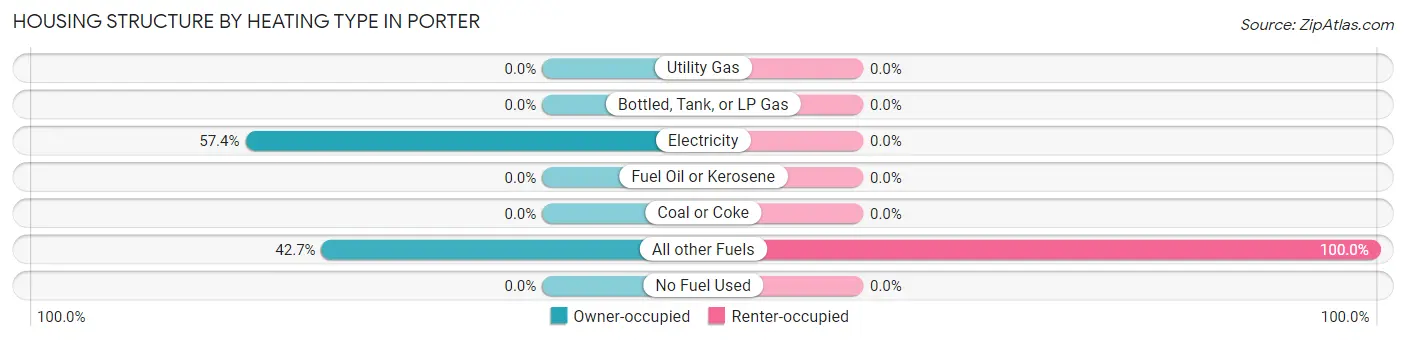
| Heating Type | Owner-occupied | Renter-occupied |
| Utility Gas | 0 (0.0%) | 0 (0.0%) |
| Bottled, Tank, or LP Gas | 0 (0.0%) | 0 (0.0%) |
| Electricity | 39 (57.4%) | 0 (0.0%) |
| Fuel Oil or Kerosene | 0 (0.0%) | 0 (0.0%) |
| Coal or Coke | 0 (0.0%) | 0 (0.0%) |
| All other Fuels | 29 (42.6%) | 6 (100.0%) |
| No Fuel Used | 0 (0.0%) | 0 (0.0%) |
| Total | 68 (100.0%) | 6 (100.0%) |
Household Vehicle Usage in Porter
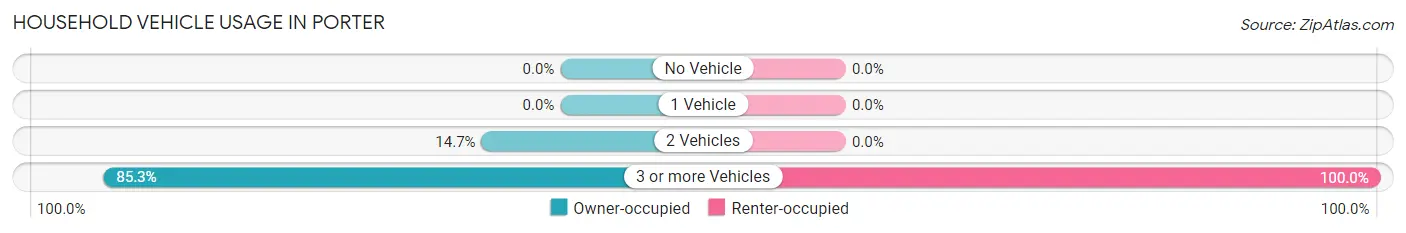
| Vehicles per Household | Owner-occupied | Renter-occupied |
| No Vehicle | 0 (0.0%) | 0 (0.0%) |
| 1 Vehicle | 0 (0.0%) | 0 (0.0%) |
| 2 Vehicles | 10 (14.7%) | 0 (0.0%) |
| 3 or more Vehicles | 58 (85.3%) | 6 (100.0%) |
| Total | 68 (100.0%) | 6 (100.0%) |
Real Estate & Mortgages in Porter
Real Estate and Mortgage Overview in Porter
| Characteristic | Without Mortgage | With Mortgage |
| Housing Units | 39 | 29 |
| Median Property Value | $347,200 | $0 |
| Median Household Income | - | - |
| Monthly Housing Costs | $498 | $0 |
| Real Estate Taxes | $3,950 | $0 |
Property Value by Mortgage Status in Porter
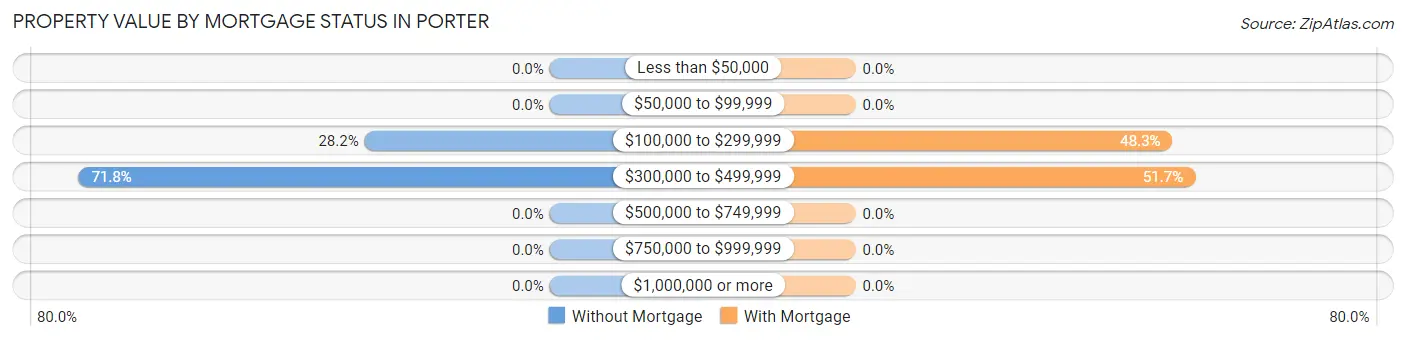
| Property Value | Without Mortgage | With Mortgage |
| Less than $50,000 | 0 (0.0%) | 0 (0.0%) |
| $50,000 to $99,999 | 0 (0.0%) | 0 (0.0%) |
| $100,000 to $299,999 | 11 (28.2%) | 14 (48.3%) |
| $300,000 to $499,999 | 28 (71.8%) | 15 (51.7%) |
| $500,000 to $749,999 | 0 (0.0%) | 0 (0.0%) |
| $750,000 to $999,999 | 0 (0.0%) | 0 (0.0%) |
| $1,000,000 or more | 0 (0.0%) | 0 (0.0%) |
| Total | 39 (100.0%) | 29 (100.0%) |
Household Income by Mortgage Status in Porter
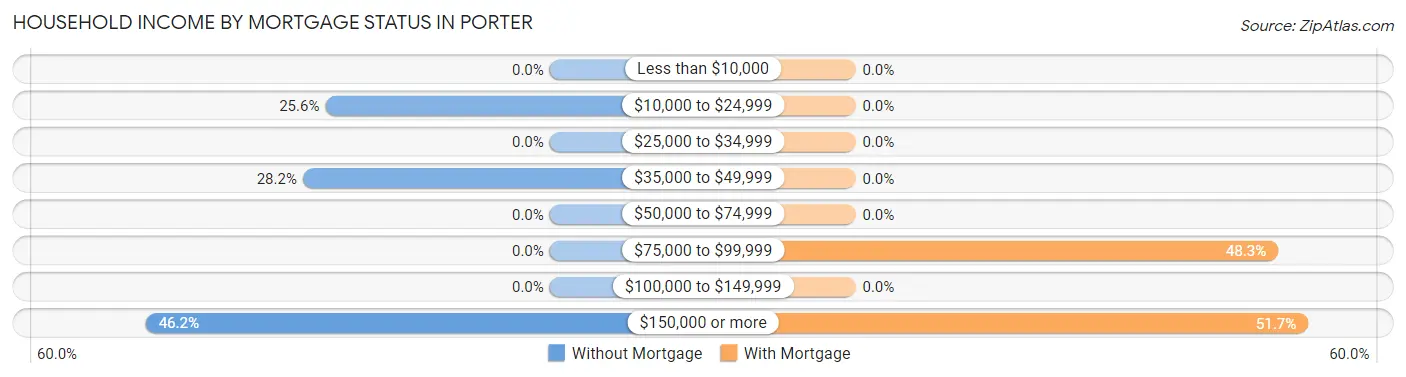
| Household Income | Without Mortgage | With Mortgage |
| Less than $10,000 | 0 (0.0%) | 0 (0.0%) |
| $10,000 to $24,999 | 10 (25.6%) | 0 (0.0%) |
| $25,000 to $34,999 | 0 (0.0%) | 0 (0.0%) |
| $35,000 to $49,999 | 11 (28.2%) | 0 (0.0%) |
| $50,000 to $74,999 | 0 (0.0%) | 0 (0.0%) |
| $75,000 to $99,999 | 0 (0.0%) | 14 (48.3%) |
| $100,000 to $149,999 | 0 (0.0%) | 0 (0.0%) |
| $150,000 or more | 18 (46.2%) | 15 (51.7%) |
| Total | 39 (100.0%) | 29 (100.0%) |
Property Value to Household Income Ratio in Porter
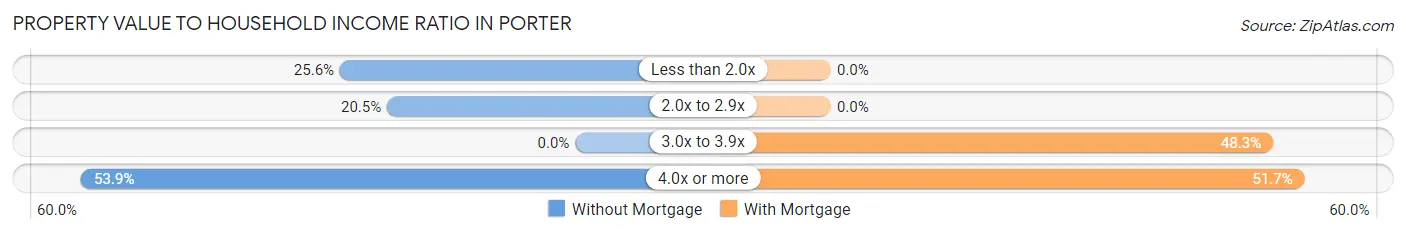
| Value-to-Income Ratio | Without Mortgage | With Mortgage |
| Less than 2.0x | 10 (25.6%) | 0 (0.0%) |
| 2.0x to 2.9x | 8 (20.5%) | 0 (0.0%) |
| 3.0x to 3.9x | 0 (0.0%) | 14 (48.3%) |
| 4.0x or more | 21 (53.8%) | 15 (51.7%) |
| Total | 39 (100.0%) | 29 (100.0%) |
Real Estate Taxes by Mortgage Status in Porter
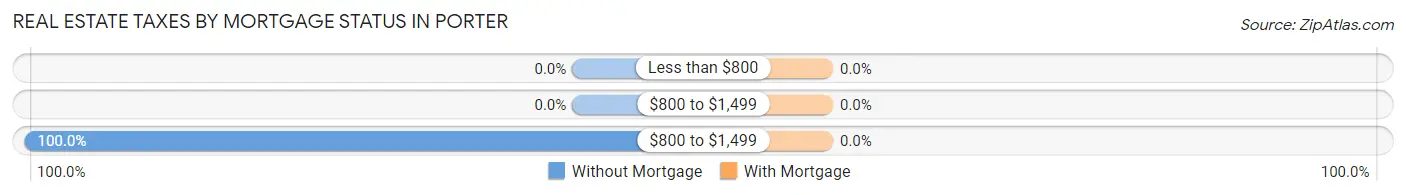
| Property Taxes | Without Mortgage | With Mortgage |
| Less than $800 | 0 (0.0%) | 0 (0.0%) |
| $800 to $1,499 | 0 (0.0%) | 0 (0.0%) |
| $800 to $1,499 | 39 (100.0%) | 0 (0.0%) |
| Total | 39 (100.0%) | 29 (100.0%) |
Health & Disability in Porter
Health Insurance Coverage by Age in Porter
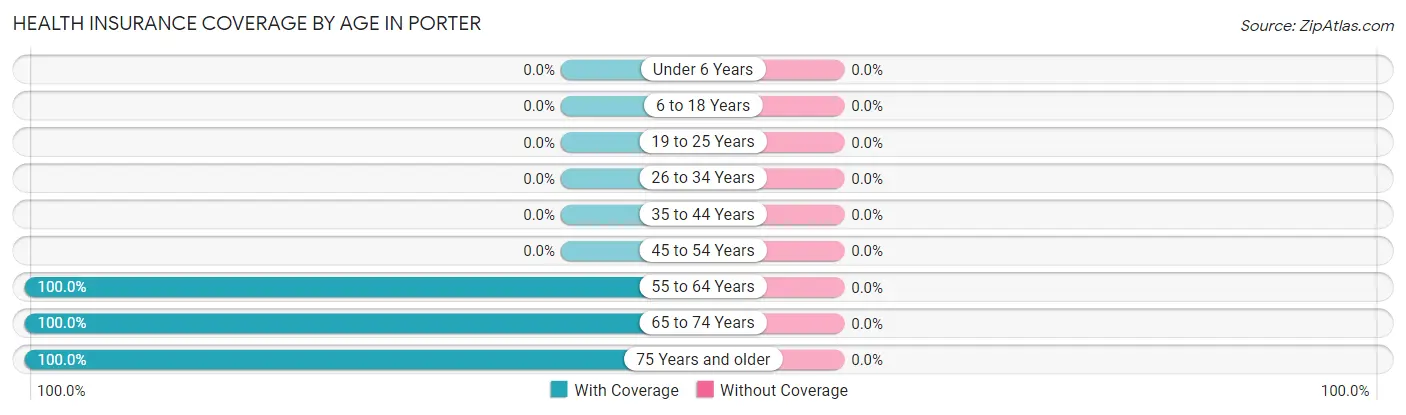
| Age Bracket | With Coverage | Without Coverage |
| Under 6 Years | 0 (0.0%) | 0 (0.0%) |
| 6 to 18 Years | 0 (0.0%) | 0 (0.0%) |
| 19 to 25 Years | 0 (0.0%) | 0 (0.0%) |
| 26 to 34 Years | 0 (0.0%) | 0 (0.0%) |
| 35 to 44 Years | 0 (0.0%) | 0 (0.0%) |
| 45 to 54 Years | 0 (0.0%) | 0 (0.0%) |
| 55 to 64 Years | 70 (100.0%) | 0 (0.0%) |
| 65 to 74 Years | 70 (100.0%) | 0 (0.0%) |
| 75 Years and older | 6 (100.0%) | 0 (0.0%) |
| Total | 146 (100.0%) | 0 (0.0%) |
Health Insurance Coverage by Citizenship Status in Porter
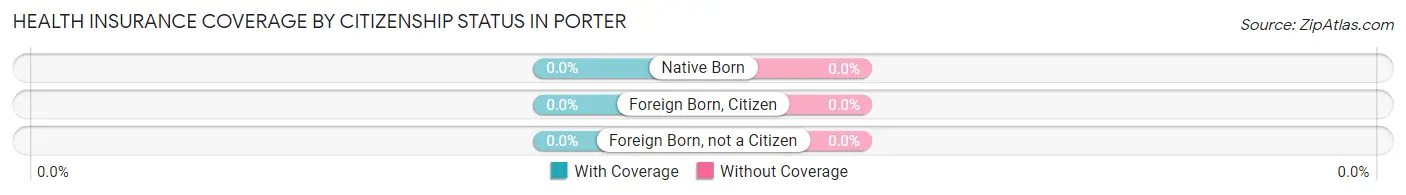
| Citizenship Status | With Coverage | Without Coverage |
| Native Born | 0 (0.0%) | 0 (0.0%) |
| Foreign Born, Citizen | 0 (0.0%) | 0 (0.0%) |
| Foreign Born, not a Citizen | 0 (0.0%) | 0 (0.0%) |
Health Insurance Coverage by Household Income in Porter
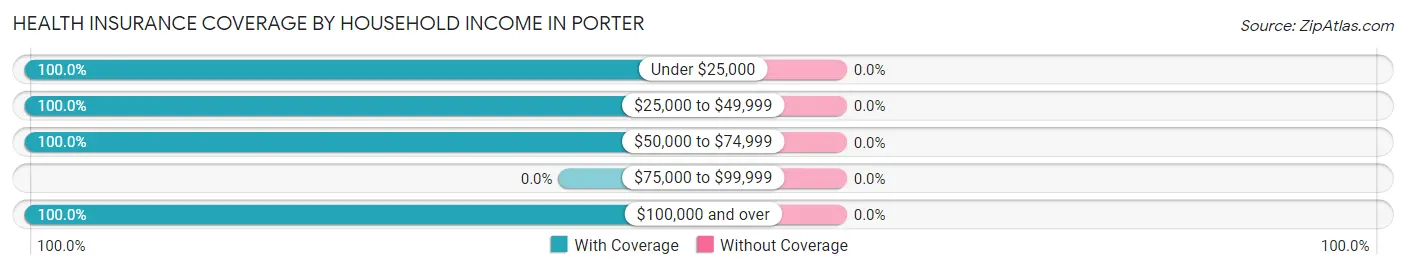
| Household Income | With Coverage | Without Coverage |
| Under $25,000 | 10 (100.0%) | 0 (0.0%) |
| $25,000 to $49,999 | 29 (100.0%) | 0 (0.0%) |
| $50,000 to $74,999 | 28 (100.0%) | 0 (0.0%) |
| $75,000 to $99,999 | 0 (0.0%) | 0 (0.0%) |
| $100,000 and over | 79 (100.0%) | 0 (0.0%) |
Public vs Private Health Insurance Coverage by Age in Porter
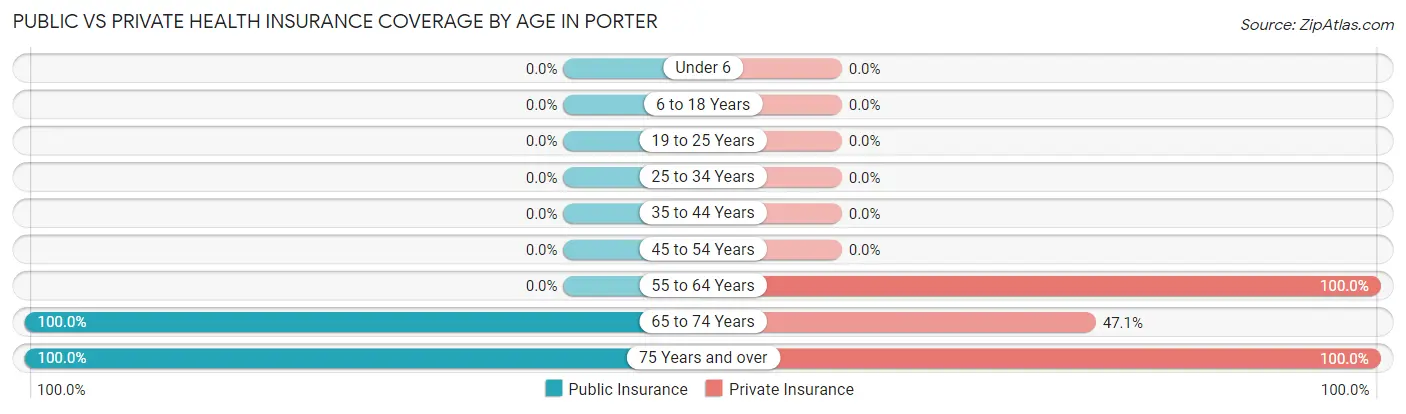
| Age Bracket | Public Insurance | Private Insurance |
| Under 6 | 0 (0.0%) | 0 (0.0%) |
| 6 to 18 Years | 0 (0.0%) | 0 (0.0%) |
| 19 to 25 Years | 0 (0.0%) | 0 (0.0%) |
| 25 to 34 Years | 0 (0.0%) | 0 (0.0%) |
| 35 to 44 Years | 0 (0.0%) | 0 (0.0%) |
| 45 to 54 Years | 0 (0.0%) | 0 (0.0%) |
| 55 to 64 Years | 0 (0.0%) | 70 (100.0%) |
| 65 to 74 Years | 70 (100.0%) | 33 (47.1%) |
| 75 Years and over | 6 (100.0%) | 6 (100.0%) |
| Total | 76 (52.0%) | 109 (74.7%) |
Disability Status by Sex by Age in Porter
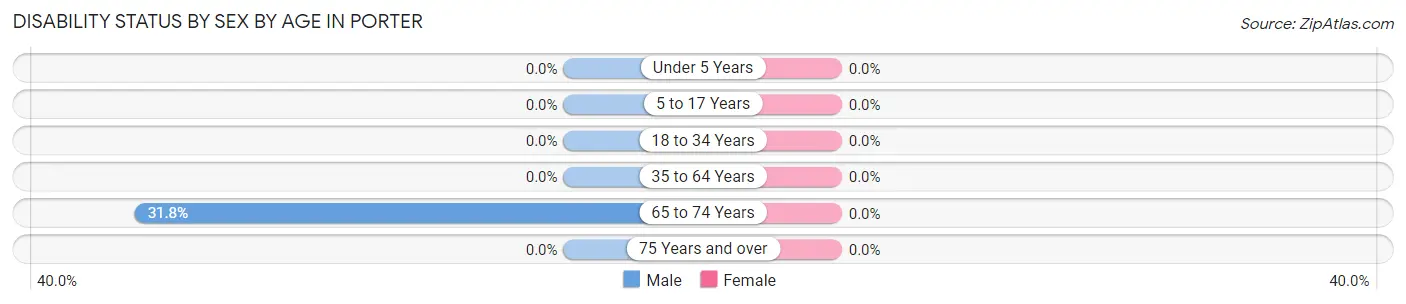
| Age Bracket | Male | Female |
| Under 5 Years | 0 (0.0%) | 0 (0.0%) |
| 5 to 17 Years | 0 (0.0%) | 0 (0.0%) |
| 18 to 34 Years | 0 (0.0%) | 0 (0.0%) |
| 35 to 64 Years | 0 (0.0%) | 0 (0.0%) |
| 65 to 74 Years | 14 (31.8%) | 0 (0.0%) |
| 75 Years and over | 0 (0.0%) | 0 (0.0%) |
Disability Class by Sex by Age in Porter
Disability Class: Hearing Difficulty
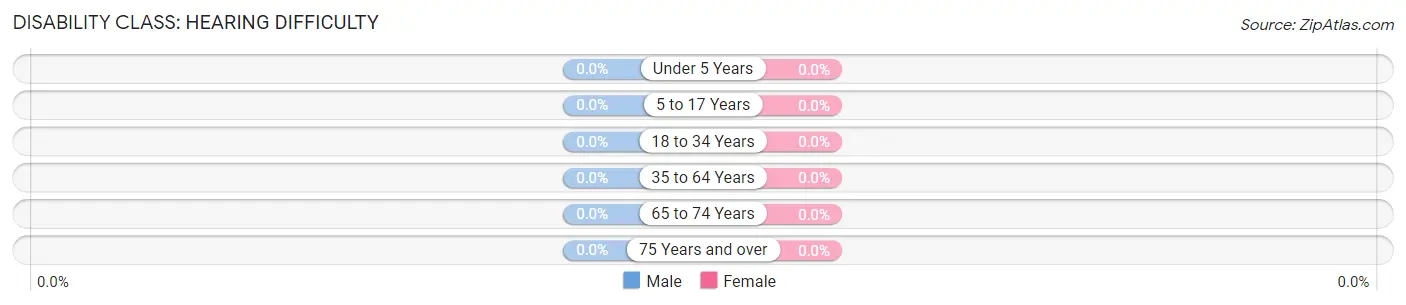
| Age Bracket | Male | Female |
| Under 5 Years | 0 (0.0%) | 0 (0.0%) |
| 5 to 17 Years | 0 (0.0%) | 0 (0.0%) |
| 18 to 34 Years | 0 (0.0%) | 0 (0.0%) |
| 35 to 64 Years | 0 (0.0%) | 0 (0.0%) |
| 65 to 74 Years | 0 (0.0%) | 0 (0.0%) |
| 75 Years and over | 0 (0.0%) | 0 (0.0%) |
Disability Class: Vision Difficulty
| Age Bracket | Male | Female |
| Under 5 Years | 0 (0.0%) | 0 (0.0%) |
| 5 to 17 Years | 0 (0.0%) | 0 (0.0%) |
| 18 to 34 Years | 0 (0.0%) | 0 (0.0%) |
| 35 to 64 Years | 0 (0.0%) | 0 (0.0%) |
| 65 to 74 Years | 0 (0.0%) | 0 (0.0%) |
| 75 Years and over | 0 (0.0%) | 0 (0.0%) |
Disability Class: Cognitive Difficulty

| Age Bracket | Male | Female |
| 5 to 17 Years | 0 (0.0%) | 0 (0.0%) |
| 18 to 34 Years | 0 (0.0%) | 0 (0.0%) |
| 35 to 64 Years | 0 (0.0%) | 0 (0.0%) |
| 65 to 74 Years | 0 (0.0%) | 0 (0.0%) |
| 75 Years and over | 0 (0.0%) | 0 (0.0%) |
Disability Class: Ambulatory Difficulty
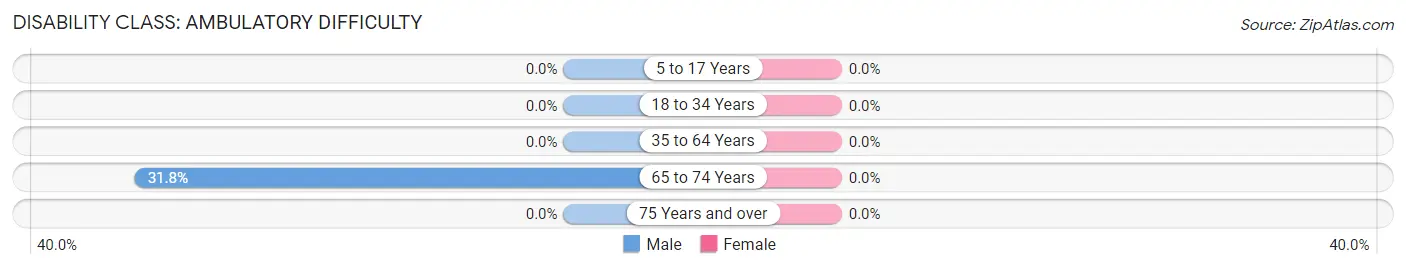
| Age Bracket | Male | Female |
| 5 to 17 Years | 0 (0.0%) | 0 (0.0%) |
| 18 to 34 Years | 0 (0.0%) | 0 (0.0%) |
| 35 to 64 Years | 0 (0.0%) | 0 (0.0%) |
| 65 to 74 Years | 14 (31.8%) | 0 (0.0%) |
| 75 Years and over | 0 (0.0%) | 0 (0.0%) |
Disability Class: Self-Care Difficulty
| Age Bracket | Male | Female |
| 5 to 17 Years | 0 (0.0%) | 0 (0.0%) |
| 18 to 34 Years | 0 (0.0%) | 0 (0.0%) |
| 35 to 64 Years | 0 (0.0%) | 0 (0.0%) |
| 65 to 74 Years | 0 (0.0%) | 0 (0.0%) |
| 75 Years and over | 0 (0.0%) | 0 (0.0%) |
Technology Access in Porter
Computing Device Access in Porter
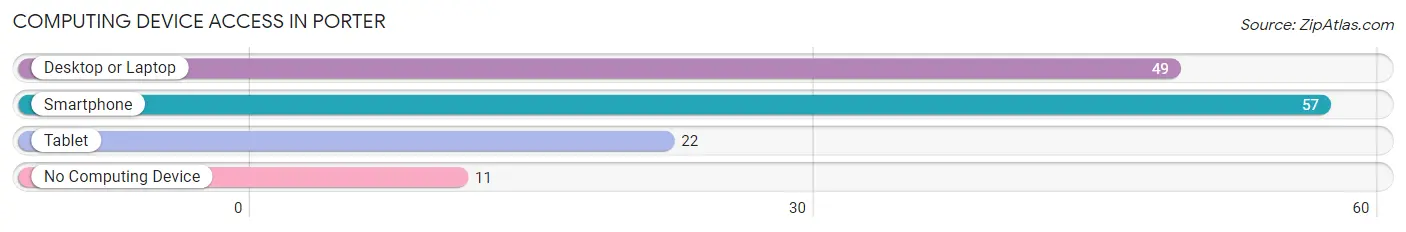
| Device Type | # Households | % Households |
| Desktop or Laptop | 49 | 66.2% |
| Smartphone | 57 | 77.0% |
| Tablet | 22 | 29.7% |
| No Computing Device | 11 | 14.9% |
| Total | 74 | 100.0% |
Internet Access in Porter
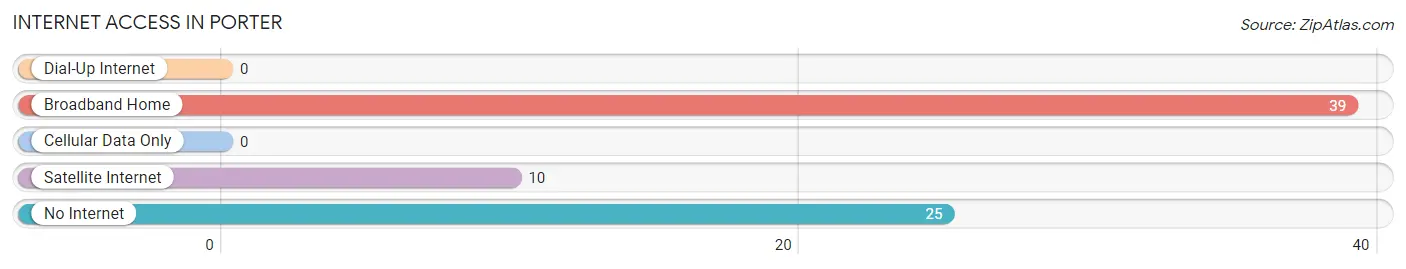
| Internet Type | # Households | % Households |
| Dial-Up Internet | 0 | 0.0% |
| Broadband Home | 39 | 52.7% |
| Cellular Data Only | 0 | 0.0% |
| Satellite Internet | 10 | 13.5% |
| No Internet | 25 | 33.8% |
| Total | 74 | 100.0% |
Porter Summary
Porter is a small town located in the state of Washington, United States. It is situated in the county of Spokane, and is part of the Spokane Metropolitan Statistical Area. The town has a population of approximately 1,000 people, and is located in the foothills of the Cascade Mountains.
Geography
Porter is located in the foothills of the Cascade Mountains, and is situated in the Spokane Valley. The town is located at an elevation of 1,890 feet, and is surrounded by rolling hills and forests. The town is located near the Spokane River, and is close to the Spokane International Airport. The town is also close to the cities of Spokane and Cheney.
Climate
Porter has a semi-arid climate, with hot summers and cold winters. The average temperature in the summer is around 75 degrees Fahrenheit, and the average temperature in the winter is around 30 degrees Fahrenheit. The town receives an average of 16 inches of precipitation per year, with most of the precipitation occurring in the winter months.
Economy
Porter’s economy is largely based on agriculture and tourism. The town is home to several farms, which produce a variety of crops, including wheat, barley, and hay. The town is also home to several wineries, which produce a variety of wines. Tourism is also an important part of the local economy, as the town is close to several popular attractions, including the Spokane River, the Spokane International Airport, and the Spokane Valley Mall.
Demographics
As of the 2010 census, the population of Porter was 1,000 people. The racial makeup of the town was 94.2% White, 0.7% African American, 0.7% Native American, 0.7% Asian, 0.3% Pacific Islander, and 3.1% from other races. The median household income in Porter was $45,000, and the median family income was $50,000.
Conclusion
Porter is a small town located in the state of Washington, United States. It is situated in the county of Spokane, and is part of the Spokane Metropolitan Statistical Area. The town has a population of approximately 1,000 people, and is located in the foothills of the Cascade Mountains. Porter’s economy is largely based on agriculture and tourism, and the town is home to several farms and wineries. The town also has a semi-arid climate, with hot summers and cold winters. The population of Porter is mostly White, with a small percentage of African American, Native American, Asian, and Pacific Islander residents.
Common Questions
What is Per Capita Income in Porter?
Per Capita income in Porter is $58,286.
What is the Median Family Income in Porter?
Median Family Income in Porter is $100,667.
What is Inequality or Gini Index in Porter?
Inequality or Gini Index in Porter is 0.48.
What is the Total Population of Porter?
Total Population of Porter is 146.
What is the Total Male Population of Porter?
Total Male Population of Porter is 75.
What is the Total Female Population of Porter?
Total Female Population of Porter is 71.
What is the Ratio of Males per 100 Females in Porter?
There are 105.63 Males per 100 Females in Porter.
What is the Ratio of Females per 100 Males in Porter?
There are 94.67 Females per 100 Males in Porter.
What is the Median Population Age in Porter?
Median Population Age in Porter is 65.1 Years.
What is the Average Family Size in Porter
Average Family Size in Porter is 2.2 People.
What is the Average Household Size in Porter
Average Household Size in Porter is 2.0 People.
How Large is the Labor Force in Porter?
There are 66 People in the Labor Forcein in Porter.
What is the Percentage of People in the Labor Force in Porter?
45.2% of People are in the Labor Force in Porter.
What is the Unemployment Rate in Porter?
Unemployment Rate in Porter is 24.2%.